August 2006 Newsletter
Issue Number 22
August 21, 2006
__________
Inflationary Recession Deteriorated Sharply in Second Quarter
Alternate Measures: Consumer Inflation Hits 11% with Annual GDP Growth Down 0.8%
July M3 Annual Growth at 9.1%
Fed's Pause Will Prove Short-Lived
Heavy Dollar Selling and Interest Rate Spike Loom
Introduced this month are the Shadow Government Statistics (SGS) alternate measures of Consumer Inflation and Gross Domestic Product, as well as a continuing series for estimated growth in M3 Money Supply -- abandoned by the Federal Reserve in March. While these different measures are graphed and discussed in the opening comments, the underlying methodologies are described in this month's Reporting/Market Focus. Separately, data for the SGS versions of the M3, GDP and CPI series are available for subscriber download through the Alternate Data tab on www.shadowstats.com. -- John Williams
The Federal Reserve's Open Market Committee "paused" in its string of rate hikes, citing moderating economic growth and hopes for moderating inflation. With the economy in a deepening inflationary recession, the Fed once more is feeding pabulum to the financial markets in an effort to fend off disorderly declines in the U.S. dollar and in the equity and credit markets.
In response, both the equity and credit markets have rallied. Further, a new Wall Street spin is being generated that inflation has peaked and that the Fed might start easing next year. The greenback, however, has not been buying all the super-hype, and therein lies the mechanism for triggering a resumption of the Fed's so-called tightening. At least initially, Mr. Bernanke should move to defend the dollar against the coming onslaught, in an effort to moderate the drain of liquidity from the U.S. markets.
Inflation is far from peaking, and interest rates are going to spike sharply. In a related manner, the run-up in oil prices is not over, and the price of gold has a tremendous upside move ahead of it. The ceasefire in Lebanon is far from the end of conflict in the Middle East, and the terror plot against the airlines -- uncovered in London -- also is not likely the last incident in the realm of the unthinkable.
What the activity of the last month has highlighted is how quickly some circumstances can change. Unfortunately, the intractable U.S. economic and financial condition and increasingly unstable global political conditions will not change for the better, quickly. In like manner, our outlook for a protracted, continuing U.S. economic downturn, mounting inflationary pressures and increasing financial-market instabilities will not change rapidly, either.
All of this brings us back to Mr. Bernanke, who has the unenviable job of having to juggle all these issues in such a manner so as to forestall inevitable market instabilities as long as possible. In the realm of juggling, the lengthy string of interest rate hikes, which just ended, was not accompanied by the expected tightening of monetary policy.
Although annual growth in the M1 money supply measure has been vacillating around zero, M2 has growth has remained in the 4% to 5% range, and M3 growth has continued to rise. While the Fed ceased publishing M3 back in March, Shadow Government Statistics has developed a continuing series of estimated annual M3 growth.

The new M3 series (see Reporting/Market Focus for methodology) shows an ongoing increase in annual growth for this broadest of money supply measures. With M3 growth at 9.1% in July, it is at its highest level since March 2002, when money growth was slowing from its 2001 peak of 13.3%. Then, the Fed was trying to offset the liquidity impact of the bursting stock-market bubble.
In the current circumstance, the Fed is pushing on the proverbial string. Rapid M3 growth is not stimulating economic activity. It is, however, helping to add upside pressure on inflation. Raising rates will do little to contain inflation that is driven by commodity supply problems (such as with oil). If the current inflation problem were based on strong economic demand, the rates might help, but such is not the case. On the other hand, overly aggressive pumping up of the broad money supply actually will add to inflation pressures, despite soft economic demand, which is the case.
Annual growth in key economic data continued to collapse in the reporting of the last month, while official annual CPI inflation remained above four percent. The SGS Alternate GDP measure shows a deepening and protracted recession, while the SGS Alternate Consumer Inflation measure is at a 25-year high.
Key Economic Indicators Keep Tumbling. As discussed in the Flash Update of July 24th, deteriorating growth in retail sales and housing starts locked in recession signals last month, and those growth patterns have shown continued decline in the latest reporting. Monthly growth in July payroll employment remained statistically indistinguishable from no change/contraction for a fourth month, while help-wanted advertising continued at a 45-year low, and other employment indicators continued to signal a softening jobs market. Recent strength in industrial production has been tied to unusually severe, nationwide heat waves. For a number of factories, increased air conditioning usage gets counted by the Fed as a spike in production.
The official June/July inflation readings have been slow to pick up the recent surge in oil prices, as is typical in such reporting. August should reflect some catch up, regardless of current downside volatility in crude oil prices.
The Alert of July 28th showed GDP manipulation, where the use of incredibly low GDP inflation rates prevented a quarterly contraction in real (inflation-adjusted) growth. Generally, the lower the inflation rate used to deflate GDP, the higher will be the reported real growth. Regardless, the 2.5% second-quarter GDP growth rate, which presently is statistically indistinguishable from an outright contraction, should face some downward revision based on the latest revisions to and reporting of retail sales and the monthly trade deficit (see the respective reporting sections).
The GDP series is the most heavily politicized of the popular government economic reports. In conjunction with the annual GDP revisions, Shadow Government Statistics this month introduces an alternate measure of estimated annual real GDP growth (see the Reporting/Market Focus section for methodology and further detail).

Incorporating the downside revisions to recent annual real GDP growth, the SGS series not only shows the 2000/2001 recession to have been much deeper and longer than officially reported, but also that the current downturn is just the second leg of a double-dip recession.
Special Consumer Inflation Focus. Subscriber questions increasingly have centered on issues with consumer inflation and various measures of the same. The following table shows the current status of a variety of inflation measures. Where the Bureau of Labor Statistics regularly reports on six unemployment measures, ranging from U-1 to U-6, SGS now will report regularly on eight inflation measures, ranging from I-1 to I-8.
                          Eight Levels of Inflation
                    Annual Inflation for May to July 2006


          Measure                                May    June   July
          I-1 Core PCE Deflator                   2.2%   2.4%   n.a.
          I-2 Core C-CPI                          2.2%   2.4%   2.5%
          I-3 Core CPI-U                          2.4%   2.6%   2.7%
          I-4 PCE Deflator                        3.4%   3.5%   n.a.
          I-5 C-CPI-U                             3.4%   3.7%   3.5%
          I-6 CPI-U                               4.2%   4.3%   4.1%
          I-7 Pre-Clinton CPI-U                   7.3%   7.4%   7.3%
          I-8 SGS Alternate Consumer Inflation   10.8%  11.0%  11.0%
The key is how you define consumer inflation. I operate on the premise that the post-World War II CPI concept of inflation measured based on a fixed-basket of goods -- a measure of the changes in prices related to maintaining a constant standard of living -- was a reasonable, meaningful and useful approach for most consumers (see the CPI background article on the home page{LINK}).
Some years back, then Fed Chairman Alan Greenspan began making public noises about how the CPI overstated inflation. Where the fixed-basket of goods approach would measure the cost of steak, year after year, Mr. Greenspan argued that if steak went up in price, people would buy more hamburger meat, mitigating the increase in their cost of living. The fact that switching the CPI concept to a substitution-based basket of market goods from a fixed-basket violated the original intent, purpose and concept of the CPI, never seemed to be a concern to those in Washington. Artificially reducing reported CPI inflation would have a variety of benefits, beginning with reduction of the budget deficit due to the cutting of cost-of-living adjustments for Social Security payments.
Accordingly, geometric weighting was introduced to the CPI reporting methodology, which had the effect of mimicking a substitution basis. Since the revised CPI still did not show as low an inflation rate as a fully substitution-based index would, Mr. Greenspan began focusing the Fed's inflation targeting and measurement on the inflation rate used to deflate personal consumption expenditure (PCE) in the GDP. Such was a substitution-based measure.
More recently, the BLS introduced the Chained CPI-U (C-CPI-U) as an experimental substitution-based inflation index, which closes follows PCE inflation.
Yet, as oil prices began their current uptrend, substitution-based inflation reporting still was not low enough for the former Fed Chairman, as he began embracing the concept of "core" inflation, inflation net of food and energy price changes. Eliminating bothersome price increases in energy and food products -- such as seen with oil at present -- would make the Fed's job of containing reported inflation all the easier.
In general, if a government economic measure does match common public experience, it has little use outside of academia or the spin-doctoring rooms of the Fed and Wall Street. The two SGS measures included in the above table have gimmicked methodological changes removed from the reporting so as to reflect more accurately the common public experience as embodied by the post-World War II CPI.
In summary, measures I-1 to I-3 reflect the core inflation rates respectively of the substitution based PCE and C-CPI-U measures and the geometrically weighted CPI-U. Measures I-4 to I-6 are the same measures with energy and food inflation included. The CPI-U (I-6) is the measure popularly followed by the financial press, when it is not involved in hyping core inflation.
I-7 is the CPI-U with the effects of geometric weighting (as estimated by SGS) reversed. This is the top series in the CPI graph on the SGS home page www.shadowstats.com.
The eighth measure (I-8) reflects the new SGS Alternate Consumer Inflation measure, which reverses the methodological gimmicks of the last 25 years or so, plus an adjustment for the geometric weighting that is not otherwise accounted for in BLS historic bookkeeping.

The July 2006 SGS Alternate Consumer Inflation measure shows inflation at a 25-year high of 11.0%. The methodology is discussed in the Reporting/Market Focus section.
The following graph shows the relative impact of the historical methodological changes to the CPI-U and as removed with the SGS alternate measure. The graph shows that inflation was contained in a self-correcting process before the founding of the Federal Reserve in 1913 and the abandonment of the gold standard in 1933.
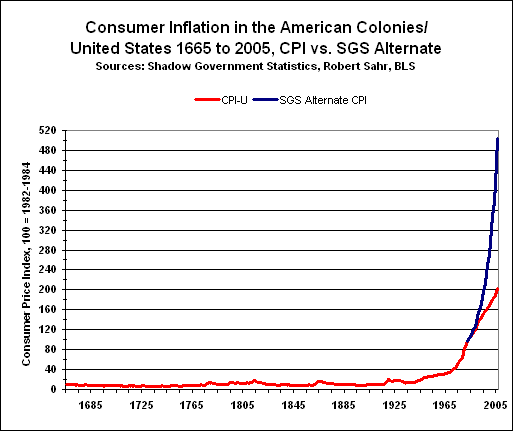
This graph plots the level of consumer prices during the last 341 years. Data for the period 1665 to 1913 were estimated by Robert Sahr of Oregon State University, using the research of John J. McCusker of Trinity University, San Antonio, Texas. The continuing line that takes the lower track (1913 to 2006) is the official reporting of the annual-average CPI-U by the Bureau of Labor Statistics (BLS), with June 2006 used for 2006. The line that tracks to the upside represents official CPI-U reporting net of methodical changes used during the last 25 years to suppress inflation reporting. This SGS Alternate Consumer Inflation measure is estimated by a reverse engineering of BLS estimates used in constructing Consumer Price Index Research Series Using Current Methods (CPI-U-RS) plus SGS estimates of the 1990s switch from arithmetic to geometric weighting, as applied to the official CPI-U estimates.
In general, the broad economic outlook has not changed, and the financial markets increasingly are concerned over developing signs of both uncontained inflation and a developing recession. Indeed, the 2005 to 2007 (perhaps 2008) inflationary recession continues to deepen.
A contracting economy, inflation and risks of intensifying dollar selling are upon us and continue to offer the worst of all environments for increasingly less-Pollyannaish financial markets. The exception of course is the gold market, where the traditional inflation-hedge and flight-to-safety/quality vehicle will continue earning its keep as the dollar weakens, inflation accelerates and the global political situation continues to deteriorate.
The Shadow Government Statistics' Early Warning System (EWS) was activated in May 2005 and signaled the onset of a formal recession in July 2005. The EWS looks at historical growth patterns of key leading economic indicators in advance of major economic booms and busts and sets growth trigger points that generate warnings of major upturns or downturns when predetermined growth limits are breached. Since the beginning of 2005 a number of key indicators had been holding near or at their fail-safe points. Seven indicators now have moved beyond those levels, signaling a recession.
Retail sales, help-wanted advertising and housing starts generated such signals in the last two months. Once beyond their fail-safe points, these indicators never have sent out false alarms, either for an economic boom or bust.
The false economic boom massaged into first-quarter GDP reporting was a precursor to the overstatement of second-quarter GDP growth. The reported annualized real growth of 2.5% should have been a contraction. Irrespective of underlying reality, negative GDP growth is not likely to surface in regular government reporting until after the November election. Such is helped by rampant political manipulation of many key numbers. The National Bureau of Economic Research (NBER) eventually should time the downturn to mid-2005 and announce same also sometime after the election, so as not to be deemed politically motivated in its timing.
Whether or not there is a recession will be a hot topic in the popular financial media, with politics helping to fuel the debate as the election nears. Those Wall Street economists who act as shills for the market will keep up their "strong growth is just around the corner" hype regardless of any and all evidence to the contrary.
From the standpoint of common experience, this downturn will be considered the second leg of a double-dip recession, not an independent contraction as will be claimed officially.
Most economic data have softened, with the trend accelerating sharply. Regular monthly contractions are near for both payroll employment and industrial production, although political manipulation and weather distortions can keep the official payroll and production data afloat for a while longer. Significant deterioration also will be seen in corporate profits and federal tax receipts, despite any near-term volatility to the contrary. Depressed tax receipts will combine with negligible fiscal discipline and ongoing war spending to accelerate deterioration in the federal finances.
This general outlook is predicated on economic activity that already has taken place and does not consider any risks from exogenous factors such as renewed terrorist activity in the United States, world war, major natural disasters or a financial panic.
Market perceptions of the downturn in business activity are increasing sharply. As expectations begin to anticipate weak data, traditional expectations also are being lowered for inflation, despite the obvious oil problem. Worsening stagflation, however, seems to have gained a good foothold in some consensus thinking. Still, consensus forecasts generally will tend to be surprised on the downside for economic reports and on the upside for inflation reports, for some time to come.
The roots of the current difficulties are structural in nature. A consumer starved of income growth and overburdened with debt cannot sustain the real (inflation-adjusted) growth in consumption needed to keep GDP growth in positive territory. The income weakness is a direct result of the loss of a significant manufacturing base to offshore locations and the ensuing explosive, perpetual growth of the U.S. trade deficit.
Exacerbating economic and financial woes will be unusually high inflation during this contraction. Gold prices already signal inflation and other troubles. Fueled by high oil prices, weakness in the U.S. dollar and accelerating Fed monetization of federal debt, inflation will not be brought under control simply by weakness in economic demand. Instead, persistently high prices only will serve to intensify the recession, making it exceptionally long and protracted. Ongoing inflation woes and dollar problems will maintain upside pressure on long-term interest rates, reversing what currently is an inverted yield curve that some view as a recession signal.
Faltering economic activity and mounting inflation have created a nightmarish conundrum for the political operatives at the Federal Reserve. Soft economic numbers and high inflation are being spun as "conflicting data," but an inflationary recession is in play, and there is little the Fed can do about it.
The hype fed to the investing public -- that a weak economy means low inflation and interest rates -- cannot work in the current environment. Any conflicts that arise are not in the economic data but in simplistic views on economic activity espoused by Wall Street, or in the statistical manipulation goals of the politicians. Those latter issues explain Fed Chairman Bernanke's continued tap dancing on the inflation outlook. Such is anchored in putting a positive spin on an impossible situation and avoiding a financial-market meltdown before November 7th, but the markets have not been overly cooperative.
In the present circumstance, inflation driven by robust economic demand would be a happy event, but such is not to be. Rather, the purchasing power of the U.S. dollar is being lost to wasting diseases, eroded by foreign exchange weakness in the trade-deficit plagued greenback, malfeasance in domestic fiscal and monetary policies, and external disruptions such as cartel-orchestrated price surges in oil. All the latter factors are in play.
From the Federal Reserve's perspective, at present, mixed signals are the best that can be offered to the markets. Allowing for the possibility of renewing the faux "tightening," signals Mr. Bernanke's devotion to keeping inflation under control. The Fed's "pause" in hiking interest rates signals Mr. Bernanke's devotion to maintaining solid economic growth. While the tap dancing may keep market sentiment gyrating for a while, the Fed is in an untenable position. Raising rates will do little to contain a non-demand driven inflation, while holding or lowering rates will do little to stimulate the structurally-impaired economy.
From the standpoint of the federal government, traditional economic stimuli in the form of tax cuts or increased federal spending have reached their practical limits with the current budget-deficit excesses.
Due to the inability of the government or central bank to stabilize this environment, risks of the current situation evolving into a hyperinflationary depression are extraordinarily high. Such a development involving the world's reserve currency would lead to a collapse of the current global currency system. In order to regain public confidence, monetary authorities likely would structure gold into the base of any new international currency system.
The unfolding inflationary recession is the worst of all worlds for the financial markets. Particularly hard hit will be the U.S. dollar, with significant downside moves looming for both equity and bond prices. Despite recent extreme volatility, the price of gold is headed much higher. At such time as the system re-stabilizes, post-crisis, there will be exceptional investment opportunities for those who have been able to preserve their wealth, capital and liquidity.
The key financial markets remain in "transition" and are anticipating lower inflation and interest rates, and stronger corporate profit performance, than will come to pass. In terms of the broad financial market picture through year-end, the U.S. dollar should sell off sharply on a trade-weighted basis, particularly against the Swiss franc. As a partial result of the mounting dollar and inflation difficulties, the domestic yield curve will turn positive and steepen sharply, due particularly to rising long-term interest rates. The combination of the weak dollar and higher rates should not play out happily among equities. Concerns tied to the dollar, inflation and global instabilities suggest an upbeat year-end for the precious metals.
As to Federal Reserve policy, dollar and inflation woes are good bets to trigger renewed hikes in the targeted federal funds rate, before 2007. What drives present-day Fed policy is an effort to avoid -- at least to delay as long as possible -- a global financial panic and currency-system collapse. As with the recent "pause" in rate hikes, the Fed's actions are designed to placate the financial markets as much as possible and do not encompass a planning horizon much beyond a week or two. Accordingly, the Fed most likely will focus on the dollar as a policy guide, resuming rate hikes when they are deemed necessary to keep the dollar from entering freefall.
Equities -- The stock market continues to prove that it is the least rational of the financial markets, with the Dow Jones Industrial Average moving to a three-month high as we go to press.
Other than as something of a mirror of excessive inflation, stock prices are relatively strong despite underlying fundamentals that are miserable. The economy remains in an inflationary recession, and that concept has started to gain recognition among a growing number of analysts. Implications are for declining corporate profits and competing investment opportunities in the credit market as interest rates rise. With a terrible dollar tumble ahead, investment opportunity competition also will be had from assets denominated in something other than U.S. dollars, as well as from gold.
Once again, fall is approaching, and the squirreling season is almost upon us. I once retained a mass psychologist in an effort to explain why stock market crashes tended to take place in October and November. His answer was that humans had a vestigial squirreling instinct. As the squirrels start gathering acorns for the winter, so too do investment strategies among humans sometimes go through a shift.
When the dollar takes its major tumble, and foreign holdings of dollar assets get dumped at a near-panicked rate, the ensuing U.S. liquidity crisis should be enough to take stock prices to relative levels that only could be viewed as nightmarish by the Pollyanna crowd. Such could happen anytime, with no warning; the current circumstance also could linger beyond year-end.
Credit Markets -- Contrary to developing hype, inflation has not peaked, and the Fed's next move likely will be further interest rate hikes in defense of the U.S. dollar, instead of a shift to easing in 2007. Oil prices and inflation movement should soon dispel the latest Wall Street sales pitch.
Underlying fundamentals still indicate that long-term interest rates are headed sharply higher by the end of the year. This move in rates will be dominated by rising inflation, by a weakening dollar and by foreign investors increasingly moving their assets out of dollar-denominated instruments.
A number of factors drive interest rate movements, including economic activity, inflation, credit demand, political stability and relative dollar strength and accompanying cash inflows and outflows from abroad. Flight-to-safety concerns and anti-inflation hype, as seen at present, will have short-lived dampening impacts on treasury yields, but it is the recession that will offer major downside pressure on rates. An expectation of some slowing growth is why consensus forecasts still are for a relatively stable interest-rate environment.
The yield curve on Treasuries recently has turned even more negative, with the constant maturity 10-year yield at 4.87% and the 3-month bill at 5.07%. An added couple of hundred basis points at the long end will do a great deal towards flipping the yield curve to a fairly normal positive slope.
U.S. Dollar -- On average, the U.S. dollar held its own in July, relative to June, but selling pressure has picked up again in August. The shift in Fed policy away from raising interest rates has been a factor, especially where inflation pressures generally are moving rates to the upside outside the United States.
The dollar's tumble has just begun, with very negative and disorderly markets awaiting the greenback. As the downturn in the value of the U.S. currency accelerates, fallout in the credit and equity markets should not be pleasant.
Underlying fundamentals are so bad, they only could be marginally worse. Driving relative currency values are relative conditions in domestic economic activity, inflation, interest rates, government financial conditions and political stability. Though not fully recognized, all these factors for the United States -- relative to its major trading partners -- are negative. The U.S. economy is in recession, inflation is spiking and interest rates are rising abroad, while the Fed -- at least temporarily -- has stopped raising rates at home. The actual U.S. federal deficit is beyond containment, and, barring short-term variations with international tensions, the President's popularity rating is the lowest recorded in the 70-year history of such surveying.
Timing is uncertain, but the break in the dollar should come quickly, with little if any further advance warning. Serious shocks loom in U.S. economic and fiscal data and deteriorating domestic politics, and heavy selling pressure against the U.S. currency could intensify at any time. New record lows for the dollar are likely before the end of 2006, despite any overt or covert supportive intervention by any central bank(s).
Generally, the weaker the dollar, the greater will be the ultimate inflation pressure and liquidity squeeze in the U.S. equity and capital markets.
U.S. Dollar Indices. The Shadow Government Statistics' Financial-Weighted U.S. Dollar Index is based on dollar exchange rates weighted for respective global currency trading volumes. For July, the monthly dollar average gained just 0.03% after June's 1.07% gain. July's year-to-year change turned increasingly negative, down 3.54% after June's 1.78% decline.
In the same directions, but more heavily influenced by the U.S. dollar's monthly gain relative to the Canadian dollar, July's monthly average of the Federal Reserve's Major Currency Trade-Weighted U.S. Dollar Index rose by 0.51% following June's 1.10% gain. July's year-to-year contraction, however, deepened to 4.31%, after June's 3.86% drop.
The relative strength in the financial- versus trade-weighted dollar, though somewhat muted, still remains at a level that usually precedes a major dollar sell-off.
Gold -- The roller coaster ride in the price of gold -- from May's near-term top of over $720 per troy ounce to below $570 in mid-June and then up again -- has slowed down, with trading in the lower six-hundreds. The recent stall undoubtedly reflects some short-term easing of oil price prices and a lull in Middle East tensions, but those conditions are not likely to last long. Inflation and dollar weakness already are weighing upon the global financial system, and a sudden increase in global political stability does not loom in the foreseeable future. The fundamentals that are so negative for the U.S. dollar and the equity and credit markets, are fuel for gold buying.
As a hedge against currency problems and inflation, and as the preferred safe-haven vehicle, the price of gold generally should move higher and set new historical highs in the months ahead. The currency and inflation issues are chronic and will deteriorate sharply before an ultimate collapse in the global currency system. Such does not prevent interim wild gold price gyrations, however, particularly if central banks think they see an opportunity to tarnish gold's image. One of the alluring features of the precious metal, of course, is that is does not tarnish.


The updated gold versus oil and Swiss franc graphs are little changed, other than for some upside movement in the average prices of gold and oil during July. All the political gimmicks, spin doctors and statistical manipulations still are not fooling a number of investors. In the gold versus Swiss franc chart, again, look for the Swiss franc ultimately to move higher to meet the gold line, not the other way around.
With the President's ratings continuing to bottom bounce and roll at historic lows, near-term economic reporting will remain gimmicked and managed. As a result, reported economic performance will continue having less than usual relevance to actual underlying activity, and upcoming reporting of the major series often will be determined by political need rather than by the economic factors that should drive the results.
Employment/Unemployment -- July's 113,000 payroll gain again was well shy of market expectations, again, and the unemployment rate even increased, as discussed in the August 8th Flash Update. The message from the BLS played to the Administration's needs to salve the inflation-rattled credit markets, not so much towards selling the Bush Administration's jobs creating performance.
The popularly followed seasonally-adjusted unemployment rate U-3 for July rose to 4.75% from June's 4.60%, an increase that was inside the published +/- 0.2% error margin. The unadjusted U-3 unemployment rose to 5.0% from June's 4.8%, and the broader U-6 unemployment measure rose to 8.8% from 8.7% in June. July's seasonally-adjusted U-6 rose to 8.5% from 8.4%.
Including the long-term "discouraged workers" defined away during the Clinton administration, total unemployment remains roughly 12%. The household survey also showed seasonally-adjusted July employment (those people with at least one job) down by 34,000, after June's 387,000 increase.
For July, the payroll survey's seasonally-adjusted gain of 113,000 (124,000 net of revisions) held close to the published reporting error of +/- 108,000 for the fourth straight month. This means the reported July gain was statistically indistinguishable from negligible monthly growth. The July increase followed an upwardly revised June gain of 124,000 (was 121,000). Annual growth in unadjusted July employment continued easing, down to 1.30% from 1.39% in June.
July's payroll gain of 113,000 included a negative bias of 57,000 jobs in the "net birth/death" adjustment, a fudge factor that was reduced from the minus 72,000 used for July 2005. The fudge factor swings back into positive territory in August (it was a 125,000 gain in August 2005), which could add some upside reporting pressure to next month's payrolls.
The latest report was against a background of continued collapsing growth in help-wanted advertising, rising new claims for unemployment insurance and weak July purchasing managers employment indices (see the respective sections).
Next Release (September 1): The political needs of the Administration remain great and will continue to offset the impact of sharply slowing economic activity in the employment data, even more so in the unemployment data.
While underlying reality would suggest further downside surprises to August payroll reporting, some sort of improvement will be needed before the election. Given a swing in the August birth-death numbers back into positive territory, that upside surprise could be in the August payroll report.
Unemployment appears to be the ongoing vehicle for the politicians' good news, and, with appropriate massaging, still should see some pre-election improvement, irrespective of diverging reality.
Gross Domestic Product (GDP) -- The "advance" estimate of annualized real (inflation-adjusted) growth for second-quarter 2006 GDP was 2.46% +/- 3.0%, down from 5.58% in the first quarter. As reported, the growth rate was statistically indistinguishable from a contraction.
As discussed in the SGS Alert of July 29th{LINK}, quarterly growth would have been negative but for the unusual reporting of quarterly inflation changes. Also, as expected, previously reported GDP growth suffered downward revisions back to 2003, as a benchmark revision backed out some of the previously gimmicked numbers. The net benchmark changes were shown in graphs in the referenced Alert.
As detailed in the Opening Comments and the Reporting/Market Focus, the SGS Alternate GDP measure has been introduced this month. The alternate measure shows annual GDP growth already to be in contraction.
That said, annual real GDP growth, per official reporting, slowed to 3.49% in the second quarter, down from 3.69% in the first quarter.
Final sales -- GDP net of inventory changes -- gained 2.0% in the second quarter, down from 5.58% in the first quarter.
The GDP inflation rate (deflator) in the second quarter incredibly held at 3.30% versus 3.26% in the prior quarter, despite explosive growth in quarterly CPI inflation.
GDP reporting generally is used as political propaganda and usually has little or no relationship to underlying economic reality. Given the long-term upside methodological biases built into the GDP, an annual rate of contraction of 0.8% would have been closer to reality.
Next Release (August 30): The "preliminary" estimate for second-quarter 2006 GDP could show a downward revision, based on recent retail sales and trade deficit reporting and revisions. Nonetheless, politics would favor some upside adjustment. More than any other series, forthcoming GDP numbers likely will be dominated by the political needs of the Administration.
Consumer Price Index (CPI) -- The focus of this month's Opening Comments is consumer inflation and the introduction of the Shadow Government Statistics Alternate CPI measure (methodology discussed in the Reporting/Market Focus). The opening table of eight consumer inflation measures will become a regular feature of this section.
Also, the BLS has announced it will begin publishing the CPI to three decimal places, starting with January 2007. While this will generate more precise measurements of monthly and annual official CPI changes, it will do nothing to improve overall CPI accuracy or relevance.
The BLS reported the seasonally-adjusted June CPI-U up by 0.44% (0.30% unadjusted), following June's 0.20% (0.29% unadjusted) and May's 0.45% (0.50% unadjusted). On a not-seasonally-adjusted basis, July's annual inflation rate was 4.15%, against 4.32% in June and 4.17% in May.
The "experimental" Chained Consumer Price Index (C-CPI-U), the fully substitution based CPI that presumably is the eventual replacement for current CPI reporting, showed annual inflation of 3.52% in July, versus 3.77% in June and 3.44% in May.
Adjusted to pre-Clinton methodology, annual CPI growth was about 7.3% as of July, versus 7.4% and 7.3% respectively for June and May. The SGS Alternate Consumer Inflation measure, which reverses gimmicked changes to official CPI reporting methodologies of recent decades, shows annual inflation at 11.0% in July, versus 11.0% and 10.8% in June and May.
Annual Core CPI-U inflation rate, which excludes the necessities of food and energy, rose to 2.7% in July, up from 2.6% in June and 2.4% in May. In contrast, the SGS Base CPI-U annual inflation rate, which includes only the necessities, held at 4.4% versus 4.4% in June and 4.6% in May. The SGS rate, however, still suffers the standard CPI-U methodological understatement.
Next Release (September 15): Inflation has not peaked, and the August CPI generally should surprise soft consensus forecasts on the upside. "Core" inflation has started to firm and increasingly should reflect the effects of staggering oil prices permeating all levels of the economy.
Despite short-term volatility, annual inflation will remain high and should continue to accelerate to the upside as the year progresses, with increasing upside pressures seen not only from oil prices, but also from a weak U.S. dollar. Seasonally-adjusted monthly inflation was 0.56% for August 2005, which means that monthly August 2006 inflation above or below that level will move the reported annual inflation rate in tandem.
Federal Deficit -- As discussed in prior newsletters, the official, accounting-gimmicked 2005 deficit (fiscal year ended September 30th) was $318.5 billion, but it was eleven times higher -- at $3.5 trillion -- on a GAAP basis, per the U.S. Treasury (see the December 2005 SGS Supplement for detail). The official, accounting-gimmicked deficit for 2004 was $412.8 billion.
The Administration is touting a projected decline for the gimmicked 2006 number to $295.8 billion from 2005's $318.5 billion. This change is little more than statistical noise in the big picture and appears due to accounting games and to special short-lived tax breaks that stimulated corporate tax receipts. The "narrowing" deficit is not due to booming economic activity.
As of July 2006, the tenth month in fiscal 2006, the twelve-month rolling accounting-gimmicked deficit was $255.4 billion, down from $275.5 billion in June, and against $319.1 billion in July 2005.
Separate from the GAAP-based numbers and official deficit reporting, the change in gross federal debt is a fair indicator of actual net cash outlays by the government. As of fiscal year-end 2005, the gross federal debt was $7.933 trillion, up $554 billion from September 2004, which, in turn, was up by $596 billion from September 2003.
The gross federal debt as of July 31, 2006 was $8.444 trillion, up $24 billion from June and up $557 billion from July 2005, which, in turn, was up $571 billion from July 2004.
Going forward, the official federal deficit will inflate, as government finances suffer tax revenue losses from the intensifying recession and relative tax receipt declines after the expiration of the tax incentives. While GDP growth estimates can be gimmicked, incoming tax receipts remain an independent estimate of underlying economic reality and eventually will reflect the economy's mounting difficulties.
Initial Claims for Unemployment Insurance -- Annual change in initial claims again moved at an accelerating pace into less negative territory (an economic negative). On a smoothed basis for the 17 weeks ended August 5th, annual change narrowed to a 2.8% decline from July 8th's 4.8% decline.
The volatility of the seasonally-adjusted weekly numbers is due partially to the seasonal-adjustment process. When the series is viewed in terms of the year-to-year change in the 17-week (four-month) moving average, however, such usually is a fair indicator of current economic activity.
Real Average Weekly Earnings -- July's seasonally-adjusted real earnings declined by 0.1% for the month, after a 0.5% increase in June (revised from 0.6%) and a 0.7% decline in May. July's real earnings also were down 0.1% from the year before, versus an unchanged June and May's annual 0.2% contraction. Both monthly and annual growth rates should continue deteriorating in August, in tandem with upside moves in reported inflation.
Volatility in this series comes primarily from variations in reported CPI growth. Allowing for the biases built into the CPI-W series used in deflating the average weekly earnings, annual change in this series signals ongoing severe financial strain on U.S. households and continuing recession.
Retail Sales -- While July retail sales showed a monthly upturn, annual growth continued to collapse, generating a deepening recession signal. Downward revisions to second-quarter data also suggest a possible downward revision in the upcoming "preliminary" estimate of second-quarter 2006 real GDP growth.
July's seasonally-adjusted monthly increase of 1.4% (1.1% net of revisions) +/- 0.7% followed a revised 0.4% decline in June (previously a 0.1% decline). Net of CPI inflation, July sales were up 1.0%, following June's 0.6% decline. With prior-period revisions, inflation-adjusted retail sales contracted at an annualized quarterly pace of 1.5% in the second quarter, versus an initially reported decline of 1.2%. This change -- in conjunction with negative revisions to the monthly trade data -- raises a fair risk of a downside revision to second-quarter GDP reporting.
When inflation-adjusted year-to-year growth in retail sales falls below 1.8% (using the official CPI-U for deflation), such signals recession. Before inflation adjustment, July's annual growth slowed to 4.8% from June's 5.4%. Net of inflation, July's annual growth was 0.7%, down from June's 1.1%, indicating a deepening recession signal. The recession signal was first generated last month, as discussed in the Flash Update of July 24th.
Next Release (September 14): August retail sales should come in below softening expectations, reflecting declining economic activity. Real (inflation-adjusted) growth should remain negative on a monthly basis, with annual growth continuing to slow.
Industrial Production -- Distorted by unusually hot weather, seasonally-adjusted July production gained 0.4%, following a 0.8% surge in June and no change in May. Unseasonably hot weather -- as seen recently -- spikes not only utility usage (up 2.0% in July), but also reported production in a number manufacturing categories, where activity is estimated by electricity consumption. Turn up the air conditioning in a computer factory, and the Federal Reserve thinks computer production is on the rise. Year-to-year change in July was up by 4.9% from 4.4% in both June and May.
Next Release (September 15): Look for industrial production increasingly to mirror the recession, with regular monthly contractions and a pattern of slowing annual growth setting in. Such will surprise market expectations on the downside. As the unusual heat waves subside, August and September reporting should start to offer some downside shocks.
New Orders for Durable Goods -- Volatile durable goods orders recovered in June with seasonally-adjusted orders gaining 3.1% (3.6% net of revisions) for the month, following May's revised 0.3% gain (previously a 0.8% decline). June's annual growth rate picked up to 6.2% from 5.9% in May.
The widely followed nondefense capital goods orders also rose in June, up by 1.3%, after May's unrevised 1.9% decline.
At one time, durable goods orders was one of the better leading indicators of broad economic activity, when smoothed using a six-month moving average. After the semi-conductor industry stopped reporting new orders, however, the series' predictive ability suffered a serious setback.
Trade Balance -- As discussed in the SGS Alert of June 12th, trade deficit reporting is being manipulated. The phony trade numbers are being used to help support a faltering U.S. currency and have been used to prop GDP reporting. Nonetheless, the June data showed a negative twist for economic reporting.
The reported improvement in June's seasonally-adjusted trade deficit to $64.8 billion from May's $65.0 billion, actually reflected a meaningful deterioration. The June "improvement" was only after May's $63.8 billion deficit was revised to $65.0 billion. The change was unusually large and suggests further unconscionable manipulations resulting from the recent annual revisions. The June reporting revisions were bad enough to result in some downward revisions to the upcoming "preliminary" estimate of second-quarter 2006 GDP growth.
Despite the manipulations, there is little question that the trade deficit remains in a phase of meaningful deterioration.
Next Release (September 12): Contrary to likely consensus expectations for a minor monthly change, the July trade deficit should widen sharply. Despite near-term manipulations, upcoming deficit reports will surge beyond consensus forecasts and regularly set new record monthly deficits in the months ahead.
Consumer Confidence -- July consumer confidence measures were reasonably flat but continued sinking on an annual basis. The Conference Board's July consumer confidence index rose by 1.0%, after a 0.7% increase in June, while the University of Michigan's May consumer sentiment eased by 0.2%.
On a three-month moving-average basis for July, annual growth in the Conference Board's measure slowed to 1.8% from 4.3% in the prior month, while the University of Michigan number was down 11.0%, following June's 7.1% decline. These lagging, not leading, indicators are signaling that the economy remains in recession.
Short-Term Credit Measures -- Annual growth in short-term credit measures for businesses remains powerful, holding double-digit annual percentage growth, while annual growth in consumer credit picked up a little steam in June.
Growth in seasonally-adjusted consumer credit remained sub-par, but showed some improvement in the most recent reporting. Annual growth rose to 3.5% in June, up from 2.9% in May. Without growth in income, growth in personal consumption can be supported over the short-term only by debt expansion or savings liquidation, and consumer debt expansion -- though moving -- is still tepid enough to contain economic growth.
Annual growth in commercial paper outstanding in July notched higher to 17.0% from June's 16.8%. Annual growth in commercial and industrial loans also inched higher to 13.8% in June, up from 13.7% in May. Rising sales can fuel short-term credit needs, but so too can slowing sales, slowing collections and rising inventories.
Producer Price Index (PPI) -- The seasonally-adjusted July finished goods PPI rose just 0.1% (0.2% unadjusted), following June's 0.5% (0.3% unadjusted) gain and May's 0.2% (0.4% unadjusted) increase. July's annual PPI inflation fell back to 4.2% from June's 4.9% and May's 4.5%. Seasonally-adjusted July intermediate goods rose by 0.5% for the month, while crude goods were up 3.1%.
Next Release (September 19): Despite a large component of random volatility in monthly price variations, PPI inflation reporting over the next six-to-nine months, including August, should top depressed expectations. "Core" inflation, in particular, should offer upside surprises to consensus forecasts despite reporting games played by the BLS.
Purchasing Managers Survey (Non-Manufacturing) -- Reporting on this series has been combined with the manufacturing series under the Better-Quality Numbers.
The following numbers are generally good-quality leading indicators of economic activity and inflation that offer an alternative to the politically-hyped numbers when the economy really is not so perfect. In some instances, using a three-month moving average improves the quality of the economic signal and is so noted in the text.
Economic Indicators
Purchasing Managers Survey - Manufacturing New Orders -- The July new orders index declined by 3.1% to 56.1 after June's increase of 7.8% to 57.9. This measure breached its fail-safe point a year ago, generating an SGS early warning indicator of pending recession.
The Commerce Department provides suspect seasonal factors for the series, and the resulting adjusted monthly numbers can be misleading in the reporting of month-to-month change. This problem is overcome by using year-to-year change on a three-month moving average basis. On that basis, the July index fell by 0.8% versus June's 3.3% increase. The index gradually has notched lower from its peak annual growth of 42.6% in April of 2004.
Published by the Institute for Supply Management (ISM), the new orders component of the purchasing managers survey is a particularly valuable indicator of economic activity. The index is a diffusion index, where a reading above 50.0 indicates rising new orders.
The overall July ISM manufacturing rose to 54.7 from 53.8 in June. An index level of 50.0 divides a growing versus contracting manufacturing sector. The July employment component rose to 50.7 from June's contraction-territory reading of 48.7.
The service-sector ISM index does not have much meaning related to broad economic activity. Unlike its older counterpart, the manufacturing survey, if service companies such as law firms, hospitals or fast-food restaurants have "increased orders," that does not necessarily mean that economic activity is increasing. That said, the overall services index fell again in July, down by 5.3% from June to 54.8.
Both the services employment and prices paid components, however, have some meaning. The July employment component rose by 4.8% to 54.5. The prices paid component is covered under the Inflation Indicators.
Help Wanted Advertising Index (HWA) -- The June help-wanted advertising held at May's 45-year low of 33. Although this series never recovered from the last recession -- just bottom bouncing and rolling -- with the annual contraction in the three-month moving average sinking to 12.2% from 8.7% in May, it is sending out a deepening signal for fresh economic contraction.
Housing Starts -- As discussed in the July 24th Flash Update, seasonally-adjusted June housing starts fell 5.3%, after a 6.6% gain May. With year-to-year change down by 11.0%, the annual change on a three-month moving-average basis fell to a 9.0% decline, which generated a recession signal. The pattern continued in July reporting, with starts down by 2.5% from June, which in turn was revised to a 5.7% monthly decline. July's three-month moving-average year-to-year change dropped to a 9.6% contraction, reaffirming the recession signal.
In related data, respective annual contractions in June of 11.1% and 8.9%, for both new and existing home sales, also are consistent with a deepening recession.
Money Supply -- Real annual growth rates for M1 and M2 remain consistent with a recession, while the nominal (unadjusted) annual growth in M3 -- as estimated by the SGS Continuing M3 Series (see this month's Opening Comments and Reporting/Market Focus) -- has been strong enough to raise inflation concerns.
Annual growth in July for monthly M1 was up 0.2% versus a 0.4% contraction in June, while annual M2 growth held at 4.9%. Both measures remained in deepening-recession territory.
Before inflation adjustment, monthly M1 and M2 rose by 0.2% and 0.3%, respectively, in July, versus June's 1.7% contraction and 0.5% gain. Adjusted for CPI inflation, June's M1 and M2 annual year-to-year rates of change were down 3.7% and up 0.8%, respectively. On a three-month moving-average basis, the July inflation-adjusted annual rates of change were down 3.5% and up 0.7%, levels that remain well underwater using the old-style CPI.
This month, the Greenspan/Bernanke version of three-card monte comes to an end. The broader, but no longer officially visible, annual M3 growth has continued to spike, up 9.1% year-to-year per the SGS Continuing M3. The new M3 series showed a level of annual growth that should be raising the hackles of the inflation-jittery financial markets. Seasonally-adjusted monthly M3 gains appear to have averaged 0.6% to 0.7% since the series was discontinued in March. While the Fed may have been pushing interest rates higher, it never was tightening. The U.S. central bank continues to flood the system with liquidity.
Inflation Indicators
Purchasing Managers Surveys - Prices Paid Indices -- On the manufacturing side, the July prices paid diffusion index rose to 78.5 from June's 76.5, a reading indicative of intense inflationary pressures. On a three-month moving average basis, July's annual growth continued to explode, up 47.8% from the year before versus annual growth of 25.3% in June and 6.4% in May.
On the non-manufacturing side, the July prices paid diffusion index rose to 74.8 from 73.9, also at a level signaling intense inflation pressures. On a three-month moving average basis, July's annual growth was up by 16.9%, a slightly softer pace than June's 18.0%.
Published by the Institute for Supply Management (ISM), the prices paid components of the purchasing managers surveys are reliable leading indicators of inflation activity. The measures are diffusion indices, where a reading above 50.0 indicates rising inflation.
Oil Prices -- West Texas Intermediate Spot (St. Louis Fed) soared anew in July to a new record average of $74.41 per barrel, up 4.9% from June's $70.96. Oil prices persist at extraordinarily inflationary levels, with July's average price up 26.8% from the year before, after June's annual gain of 26.1%. Oil prices through mid-August trading gyrated around July's average with shifting news on supply disruptions and Middle Eastern tensions. With a temporary cessation to hostilities in Lebanon, oil prices are trading in the low seventies as we go to press.
Spot prices will continue to gyrate. Despite continuing near-term price volatility, high oil prices will remain a major contributing factor to the inflation side of the current inflationary recession. Oil price changes permeate costs throughout the economy, ranging from transportation and energy costs, to material costs in the plastics, pharmaceutical, fertilizer, chemical industries, etc. Cost pressures already have passed significantly into the so-called "core" inflation sectors. With confirmation of same surfacing in official reporting, Wall Street's and the Fed's core-inflation scam has started to fall apart.
Oil price volatility affects CPI reporting. Downside oil price movements tend to be picked up more quickly and fully by the BLS in its inflation measures than are upside movements. Even as currently understated, CPI and PPI inflation should be much stronger than commonly predicted for the next six-to-nine months, partially as a result of the persistently high oil prices.
Quarterly/Annual Reporting -- Most series analyzed are published on a monthly or weekly basis. Followed economic/market series that are published with less-than-monthly frequency include:
Annual:
* Financial Statements of the United States Government (most recent analysis was a Supplement to December 2005 SGS; next analysis is due as a Supplement to the December 2006 SGS).
* Income Variance/Dispersion (most recent analysis was September 2005 SGS; next analysis is due September 2006).
Quarterly:
* Flow of Funds Accounts of the United States (most recent analysis: July 2006 SGS; next analysis is due October 2006 SGS).
Reporting/Market Foci -- The various economic and financial-market series are being addressed in a monthly "Reporting/Market Focus," with this month's analysis examining Shadow Government Statistics' alternate GDP and CPI measures in addition to a reintroduction of money supply M3. Employment, GDP, CPI and the Federal Deficit separately are explored in the background article "A Primer On Government Economic Reports," available on the Home page of www.shadowstats.com.
The series detailed so far in the Reporting Foci or background articles are listed below. The referenced SGS publications are available on the Archives page of www.shadowstats.com.
* Consumer Confidence (November 2004 SGS).
* Consumer Price Index (an original background article, October 2005 SGS, alternate numbers introduced August 2006 SGS).
* Credit Measures, Short-Term (August 2005 SGS).
* Durable Goods, New Orders for (May 2006 SGS).
* Employment/Unemployment (an original background article, alternate measures (April 2005 SGS).
* Federal Deficit (an original background article, update in the Alert of July 7, 2005, update in Supplement to December 2005 SGS).
* Gross Domestic Product (an original background article, alternate numbers introduced August 2006).
* Help Wanted Advertising (January 2006 SGS).
* Housing Starts and related housing statistics (June 2006 SGS).
* Income Variance/Dispersion (September 2005 SGS).
* Industrial Production (January 2005 SGS).
* Money Supply (Part I / SGS Early Warning System - May 2005 SGS, Part II - June 2005 SGS, M3 update November 2005 Supplement, M2 update March 2006 SGS, M3 continuing series introduced August 2006).
* Producer Price Index (April 2006 SGS).
* Purchasing Managers Survey (February 2006 SGS).
* Retail Sales (March 2005 SGS).
* SGS Early Warning System (May 2005 SGS, June 2005 SGS).
* Trade Balance (December 2004 SGS).
* Unemployment Insurance, Initial Claims for (February 2005 SGS).
* U.S. Dollar Indices, Financial- and Trade-Weighted (July 2005 SGS).
Money Supply M3 Continuation
Alternate Consumer Inflation at 11.0%
Alternate GDP Shows Annual Contraction
In response to subscriber demand, SGS has introduced and published in downloadable form on the www.shadowstats.com Alternate Data page, three alternate economic series. The SGS Continuing M3 is an estimate of growth in an ongoing version of the now defunct broad money supply series. The SGS Alternate Consumer Inflation and Alternate Gross Domestic Product estimates attempt to provide historical series that more closely track economic reality and common experience than do current, official government reports.
Continuing Money Supply M3. The Federal Reserve discontinued publishing M3, its broadest measure of the money supply, on March 23, 2006. The SGS continuing series estimates year-to-year change in the monthly average of seasonally-adjusted M3. The results are shown in a graph in the Opening Comments.
M3 consists of M2 plus institutional money funds, large-denomination time deposits, repurchase agreement liabilities and eurodollar holdings at foreign branches of U.S. banks.
More than 70% of the non-M2 components of M3 are accounted for by institutional money funds and large time deposits. The Fed has continued reporting institutional money funds as a memorandum item in its H.6 report on Money Stock Measures.
Large time deposits at commercial banks is reported regularly in the Fed's H.8 report on Assets and Liabilities of Commercial Banks. These numbers allow modeling of a good estimation of the large time deposit number used in M3 calculations.
Representing less than 30% of non-M2 components of M3 and less than 10% of total M3, the repos and eurodollars are being modeled by SGS econometric models. They will be updated, along with large time deposits, as benchmarking information becomes available in the quarterly flow of funds accounts. Accordingly, published SGS M3 growth rates are subject to revision, as are the still-published M1 and M2 series as published by the Fed. Nonetheless, the bulk of the M3 estimation is solid and should allow the production of annual M3 growth estimates that are representative of Fed activity, as well as representative of what the Fed still likely follows with its own unpublished estimates of M3.
SGS Alternate Consumer Inflation Measure. As discussed in the October 2005 SGS, the BLS publishes a "current methods" CPI that restates historical CPI reporting for methodological changes made to the series since the early 1980s. By reverse engineering the series, it is possible to calculate what the BLS estimates the different changes to CPI reporting have added or subtracted to reported annual inflation. With nearly all of the changes resulting in reduced CPI inflation, one would have to add 3.6% to current annual CPI reporting to approximate what inflation would have been, based on the older methodology. This BLS series, however, allocates only 0.2% to the annual effect of the changeover to geometric weighting in the 1990s.
SGS estimates show that net effect of the geometric weighting change is roughly 3.1% CPI reduction in terms of present impact. According 2.9% (3.1% - 0.2%) is added on top of the other adjustments. The SGS Alternate Consumer Inflation measure has been calculated over time, adjusting for the effects of all the methodological changes on annual not-seasonally-adjusted CPI-U inflation, as well as using a three-month moving average centered on the month in question. The latest month is published as is and then is revised with the publication of the next month's reporting.
Given the timing issues of when the BLS recognizes such factors as rising energy prices, the process eliminates some the unnecessary short-term volatility in the reporting. The results are shown in a graph in the Opening Comments.
Since the adjustment process is largely additive to existing reporting, the alternate series tends to show the same general up and down patterns of the underlying official CPI-U. The July 2006 annual rate of the SGS Alternate Consumer Inflation is 11.0%, which is reasonably close to rough estimates of the fully independent SGS inflation series that still is under development.
Shadow Government Statistics Alternate Gross Domestic Product Measure. Over time, the GDP series has strayed from reality, based on methodological changes often tied to the deflation process. The SGS Alternate GDP is an estimate of the historical series net of those changes, and other changes, where quantifiable, that I have been able to identify. The results are shown in a graph in the Opening Comments. The series is far from perfect. The unofficial recession of 1986 is almost there. The shallow 1995 downturn is in place, while the 2000/2001 recession is much longer and deeper than officially reported and already has started into a double-dip. In official reporting, the 2000/2001 recession has been revised away.
This series is an attempt to approximate reality, and often is adjusted as an additive function on top of the current GDP series. Accordingly, most of the ups and downs tend to move with each other in both the SGS and official series.
Separately in the works is an independent GDP measure based on a regression analysis of underlying economic series of known good quality. The patterns in that series should be close to what is shown here. As with the SGS Alternate Consumer Inflation series, the three-quarter moving average on annual growth rates is used to smooth insignificant variations in growth that often result from reporting games playing.
Income variance is a long-term driver and indicator of economic activity. Another record high -- well in excess of the level seen before the 1929 stock crash and Great Depression -- is expected as part of the Census Bureau's latest poverty report.
You may have noted ongoing changes to our Web site (www.shadowstats.com). Alternate Data are now available for subscriber download. Current postings include historical detail of unique SGS alternate series on the CPI and GDP, as well as a continuing series for Money Supply M3.
The last month also saw the introduction of Flash Updates, which highlight important new data and provide a quick summary update to the most recent newsletter. Flash Updates are distinct from Alerts, which address unusual circumstances -- such as overt manipulations -- or breaking news.
The needs and desires of you, the subscriber, will continue to help shape the scope and content of SGS going forward. Please let us know (e-mail: shadowstats@hotmail.com) what you would like to see included regularly in the newsletter. We will accommodate your wishes as best we can.
Best wishes to all,
John Williams
September's "Shadow Government Statistics" is scheduled for release on Wednesday, September 13, 2006. Any rescheduling will be noted on the home page of shadowstats.com at the top of the "Latest Monthly Commentary" column. Beginning with the September newsletter, regularly scheduled posting of the newsletter shifts to the second Wednesday of the month. This often will coincide will the prior regular posting schedule of the Wednesday following the Friday release of the employment statistics.
The posting of the next SGS on the Web site, as well as Flash Updates and any Alerts, will be advised immediately by e-mail.