|
Update May 30th, 2012 April and May Comparison with 2012 Update,March 15th, 2012 Early Bonuses? Update, February 17th, 2012 Estimates for 2012 Tax Growth Update, December 22nd, 2011 November Down-Turn?
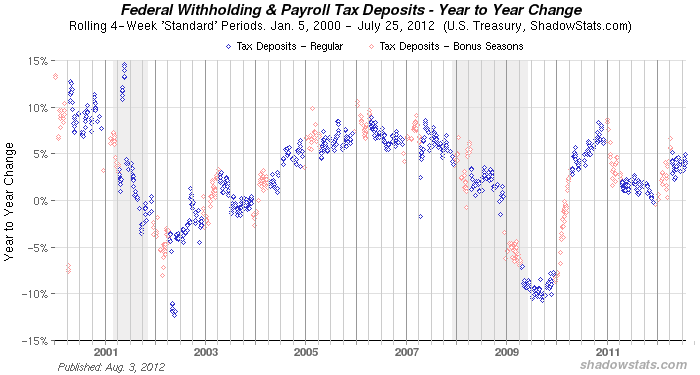
 We sample the Treasury data to identify rolling, 4-week periods which meet certain criteria. These are shown in the chart above. (Offiicial recessions are shown in gray.) We then match these and, where possible, other periods with those in the prior year to see the year-over-year change (Caution: Comparison of growth in year-over year tax revenues with underlying earnings is complicated by a number of factors such as changing tax laws, annual changes to the tax schedules, the non-linearity of tax as a function of earnings, and individual income distribution across the population. See our more detailed Analysis of Payroll Tax Receipts.)
 |
To receive news of updates to these charts, and of further analyses, please join our News List. As we consider further research in this area we welcome comments, suggestions or questions. Contact Us. See our detailed Analysis of Payroll Tax Receipts Withholding Taxes are deposited by employers, with the daily total reported by the U.S. Treasury on the next business day. Compared to the Bureau of Labor Statistics’ Payroll Survey, the tax data are both more timely (next day) and accurate (a legal requirement covering all employers, not an invited sample.) However, the raw data are difficult to analyze: Deposits are concentrated on days arising from a complex calendar of interacting payroll cycles and deposit schedules. This makes the significance of daily or weekly totals, and even their comparison with prior years, difficult. The mapping of tax receipts to growth in job and earnings levels is further complicated by various effects. For a detailed explanation of our current analyses please read our Analysis of Payroll Tax Receipts |
| John Williams' |
Shadow Government Statistics Analysis Behind and Beyond Government Economic Reporting |
|
This material is provided under the ShadowStats.com Terms of Use. Use of this material constitutes agreement to those terms.
Privacy Policy | Contact Us
Copyright 2003-2022. Shadow Government Statistics, Walter J. Williams.
Privacy Policy | Contact Us
Copyright 2003-2022. Shadow Government Statistics, Walter J. Williams.