No. 266: November CPI, PPI, Production and Housing
JOHN WILLIAMS’ SHADOW GOVERNMENT STATISTICS
COMMENTARY NUMBER 266
November CPI, PPI, Production and Housing
December 16, 2009
__________
Bad Seasonals Turn Data Topsy-Turvy
Annual CPI-U Inflation Jumps to 1.8% (SGS 8.8%)
November versus October Annual Inflation
Swings Positive by 2.0% for the CPI, 4.3% for the PPI
November Annual Real Retail Sales Were Unchanged
November Housing "Gain"
Statistically Not Different from Zero
__________
PLEASE NOTE: The next scheduled Commentary is planned for Tuesday (December 22nd), following release of the third estimate (second revision) of third-quarter GDP.
– Best wishes to all for a most joyous holiday season! John Williams
Recovery Hopes Based on Seriously Twisted Data. Reporting of some widely followed series, particularly out of the Departments of Commerce and Labor, appear to be generating false positive signals for a number of headline month-to-month numbers, including retail sales and the payroll and unemployment series. The problem could extend to the purchasing managers survey, where the seasonal factors are calculated annually by the Commerce Department.
The problem is recognized within the agencies, but it has not been put before the public. The Fed has talked of the problem with some of its statistical releases, and it appears to have addressed those issues, at least partially. As noted in the discussion in prior Commentary No. 265, no government statistical agency has had to handle such an extreme economic circumstance in the history of modern economic (meaning post-World War II) reporting. Accordingly, the issues are not simple to address, but they are helping to create an unrealistic optimism in some areas as to a faux economic recovery. Generally, the economy continues to sink or bottom-bounce; no recovery is in place.
Following up on data distortions created by the severity of the economic downturn, for example, John Crudele of the New York Post made the point to me that the seasonally-adjusted 1.3% monthly gain reported for November retail sales was based on virtually zero monthly growth in the unadjusted series. In normal times, and with normal seasonal patterns, one would expect sales to increase in November versus October, when the retail industry’s dominant period — the holiday shopping season — begins.
The purpose of seasonal adjusting data is to remove the impact of regular trading-day variations and regular variations of commercial activity from economic reporting, so that the results reflect changes in underlying economic activity, not from regular sales patterns that recur at the onset of each the holiday shopping season.
Indeed, a check of historical not-seasonally-adjusted data tends to confirm the pattern of rising unadjusted sales in November versus October, so normal seasonal adjustments for November should tend to dampen the relative seasonally-adjusted activity. Seasonal factors are updated regularly, with the heaviest weightings based on the last year’s activity patterns. Due to the patterns of plunging economic activity in the last year or two — regular in pattern only to the extent of protracted, continual decline — the effects of the economic collapse, not the normal patterns of commercial activity for which the seasonal adjustments were intended, have so warped the adjustments as to spike reported adjusted November retail sales, as though October sales now regularly outperform November sales.
Such is nonsense and highlights the problem. Irrespective of the government’s reporting, there still is a holiday shopping season, albeit muted. Applying the average seasonal adjustments for October and November used in last two "normal" years of the retail sales series, 2006 and 2007, to the 2009 data, seasonally-adjusted November retail sales fell by 1.3% instead of rising by 1.3%.
A similar approach with the housing data does not change the pattern of statistically meaningless month-to-month changes (see below), suggestive of truly ongoing bottom-bouncing.
In contrast, the Federal Reserve’s industrial production series would have risen by 1.0% in November instead of the reported 0.8%. Such suggests that the Fed has been working to address the seasonal-factor problems.
These alternative estimates are very crude, but they give a suggestion as to what is happening and highlight some issues that very properly should be seeing more of the light of day.
Inflation Resurgent. The formal CPI deflation (year-to-year decline) generated by last year’s oil-price collapse has ended, thanks largely to some rebound in oil prices. As result, annual CPI-U inflation swung 2.0% to the positive in November versus October (November plus 1.8% versus October minus 0.2%), and annual PPI inflation swung 4.3% to the positive in November versus October (November plus 2.4% versus October minus 1.9%). The annual inflation pace will pick-up sharply again in December. Much of the rebound in oil prices this year can be attributed to a generally weaker U.S. dollar, which has been pressured by Mr. Bernanke’s efforts at formal U.S. dollar debasement.
Notes on Different Measures of the Consumer Price Index.
The Consumer Price Index (CPI) is the broadest inflation measure published by U.S. Government, through the Bureau of Labor Statistics (BLS), Department of Labor:
The CPI-U (Consumer Price Index for All Urban Consumers) is the monthly headline inflation number (seasonally adjusted) and is the broadest in its coverage, representing the buying patterns of all urban consumers. Its standard measure is not seasonally adjusted, and it never is revised on that basis except for outright errors,
The CPI-W (CPI for Urban Wage Earners and Clerical Workers) covers the more-narrow universe of urban wage earners and clerical workers and is used in determining cost of living adjustments in government programs such as Social Security. Otherwise its background is the same as the CPI-U.
The C-CPI-U (Chain-Weighted CPI-U) is an experimental measure, where the weighting of components is fully substitution based. It generally shows lower annual inflation rate than the CPI-U and CPI-W. The latter two measures once had fixed weightings—so as to measure the cost of living of maintaining a constant standard of living—but now are quasi-substitution-based. Since it is fully substitution based, the series tends to reflect lower inflation than the other CPI measures. Accordingly, the C-CPI-U is the "new inflation" measure being proffered by Congress and the White House as a tool for reducing Social Security cost-of-living adjustments by stealth. Moving to accommodate the Congress, the BLS announced pending changes to the C-CPI-U estimation and reporting process on October 22, 2014, which are described in Commentary No. 668
The ShadowStats Alternative CPI-U measures are attempts at adjusting reported CPI-U inflation for the impact of methodological change of recent decades designed to move the concept of the CPI away from being a measure of the cost of living needed to maintain a constant standard of living.
CPI-U. The BLS reported this morning (December 16th) that the seasonally-adjusted November CPI-U rose by 0.40% (up by 0.07% unadjusted) +/- 0.12% (95% confidence interval not seasonally adjusted) for the month, after rising by 0.28% (up by 0.10% unadjusted) in October. Seasonally-adjusted, the annualized rate of inflation for the three months ended November was 3.43%, versus 3.62% for the three months ended October. The impact of higher monthly gasoline prices in November appears to have been underplayed in the latest report.
Unadjusted, year-to-year inflation turned positive, up by a statistically insignificant 1.84% +/- 0.20% (95% confidence interval) in November, versus a 0.18% annual contraction in October.
The eight-month period through October 2009 of annual declines (formal deflation) in CPI-U inflation was the worst since 1949 and 1950. I estimate, however, that CPI reporting methods used in 1950 would have generated inflation rates that did not drop below 5%, at worst, in the current cycle (see Alternative Consumer Inflation Measures below). The brief and shallow formal deflation that now is at an end — based on official CPI-U reporting — appears to have been about half the depth and half the length of the negative inflation bout in the 1949 to 1950 circumstance.
Annual inflation would increase or decrease in December 2009 reporting, dependent on the seasonally-adjusted monthly change, versus the 0.79% adjusted monthly decline seen in December 2008. I use the adjusted change here, since that is how consensus expectations are expressed. To approximate the annual inflation rate for December 2009, the difference in December’s headline monthly change versus the year-ago monthly change should be added to or subtracted directly from November 2009’s annual inflation rate of 1.84%.
For those interested in exploring the various facets of official CPI-U reporting, I continue to refer you to CPIwatch.com, a site prepared by one of my SGS colleagues.
CPI-W. The BLS reported that the narrower, seasonally-adjusted November CPI-W rose by 0.51% (up by 0.21% unadjusted), following an increase of 0.33% (up by 0.11% unadjusted) in October. Year-to-year CPI-W inflation rose by 2.27% in November, following a 0.30% decline in October.
C-CPI-U. Year-to-year or annual inflation for the Chain-Weighted CPI-U — the fully substitution-based series that gets touted by CPI opponents and inflation apologists as the replacement for the CPI-U — also turned positive, rising by 1.61% in November, versus a 0.46% drop in October.
Alternative Consumer Inflation Measures. Adjusted to pre-Clinton (1990) methodology, annual CPI growth rose to 5.1% in November, versus 3.2% in October, while the SGS-Alternate Consumer Inflation Measure, which reverses gimmicked changes to official CPI reporting methodologies back to 1980, rose to about 8.8% (8.77% for those using the extra digit) in November, versus 7.1% in October.
The SGS-Alternate Consumer Inflation Measure adjusts on an additive basis for the cumulative impact on the annual inflation rate of various methodological changes made by the BLS. Over the decades, the BLS has altered the meaning of the CPI from being a measure of the cost of living needed to maintain a constant standard of living, to something that no longer reflects the constant-standard-of-living concept. Roughly five percentage points of the additive SGS adjustment reflect the BLS’s formal estimate of the impact of methodological changes; roughly two percentage points reflect changes by the BLS, where SGS has estimated the impact, not otherwise published by the BLS.
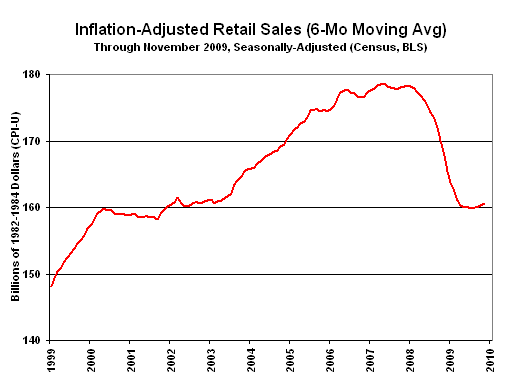
Real Retail Sales. Based on November CPI-U reporting, inflation- and seasonally-adjusted November retail sales rose by 0.9%, where the current number is up 1.3% before inflation adjustment, and where real retail sales also rose by 0.9% in October against a 1.1% gain before inflation adjustment. Year-to-year, November real retail sales were unchanged versus a 1.9% annual again before inflation adjustment. October real retail sales fell by 1.8% year-to-year, versus a 2.0% decline before inflation adjustment. (See the opening comments about seasonal-factor distortions.)
For the last 12 months, monthly real retail sales (CPI-U deflated) have been fluctuating around an average of $160.3 billion. Smoothed for monthly volatility on a six-month moving-average basis, as shown in the accompanying graph, the pattern of activity here has shifted to bottom-bouncing in terms of the level of inflation-adjusted sales. Again, there is no turnaround in economic activity — no recovery — evident here, just bottom-bouncing.

Year-to-year, November’s annual PPI inflation jumped sharply to 2.4%, following October’s 1.9% annual contraction. Going against the pressures of collapsing oil prices in fourth-quarter 2008, year-to-year change in PPI inflation has returned to positive territory and should intensify on the upside with reporting of December’s data.
On a monthly basis, seasonally-adjusted November intermediate goods rose by 1.4% (up by 0.3% in October), with crude goods jumping by 5.7% (up by 5.4% in October). Year-to-year inflation was mixed, with November intermediate goods down by 1.6% (down by 7.5% in October) and November crude goods up by 4.7% (down by 14.1% in October). Annual inflation in intermediate goods will turn positive in December, along with a general surge in annual inflation for the broad PPI measures.
November Housing Starts Continued Bottom-Bouncing. The Census Bureau reported today (December 16th) that November housing starts rose month-to-month by a statistically-insignificant 8.9% (up by 8.5% net of revisions) +/- 12.0% (95% confidence interval). October’s starts were revised so as to show a 10.1% decline, after initially having been reported down by 10.6%. Year-to-year change was down by 12.4% in November, following a revised annual contraction of 30.9% (previously 30.7%) in October.
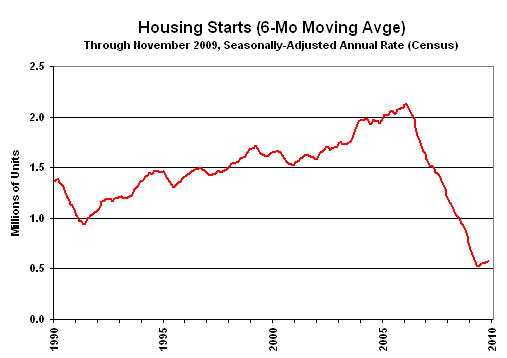
Since December 2008, housing starts have been bottom-bouncing at an historically low level, averaging a seasonally-adjusted annual rate of 551,700. In the past 12 months, all monthly readings have been within the normal range of monthly volatility for the series around that average, including November’s reading of 574,000, which remained below the monthly readings of June through September, inclusive.

The "recovery" in housing is shown in the above graph. The data are smoothed using a six-month moving average to remove the extreme month-to-month volatility seen in this series. Regardless of any level of smoothing, though, housing starts remain well below any levels seen since the end of World War II.
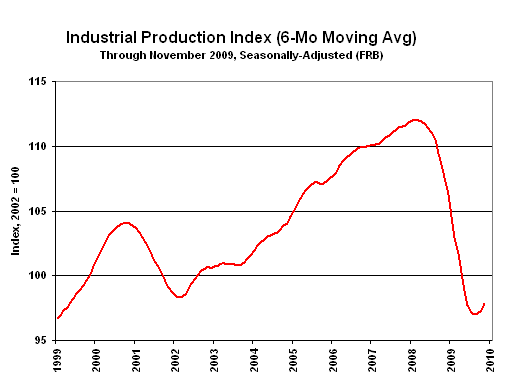
Monthly Industrial Production Jumped, Despite Weak Utilities. The Federal Reserve reported that seasonally-adjusted November industrial production rose by 0.83% for the month to a level of 99.44, following a downwardly revised 0.02% decline (previously a 0.05% gain) in October. Year-to-year contraction in November narrowed to 5.08%, from an unrevised 7.10% contraction in October. The revised June 2009 reading of 95.75 set a record low for annual production growth since the shutdown of war-time production that followed World War II. For the last 10 months, the production index has averaged 97.8, around which the series has been fluctuating, with the November’s six-month moving average reading at 97.9, versus 99.4 for the single month.
November’s reported monthly gain was due largely to increased production of durable goods, despite declining orders in same. Usually, that pattern remains short-lived. As discussed in the opening comments and in the prior Commentary No. 265, unusual distortions of monthly seasonally adjustments also may be in play, due to the particular severity of the current economic downturn. The Fed appears, however, to be making an effort at adjusting for same in its industrial production series.

The "recovery" in production is shown in the above graph, where month-to-month volatility is smoothed using a six-month moving average. Production activity has leveled off at a low-level plateau of activity that effectively has wiped out the last 10 years of growth in industrial production. Despite the near-term upside blip from short-lived stimulus impact, the series generally still is bottom-bouncing.
Week Ahead. Given the underlying reality of a weaker economy and a more serious inflation problem than generally is expected by the financial markets, risks to reporting will tend towards higher-than-expected inflation and weaker-than-expected economic reporting in the month ahead. Such is true especially for economic reporting net of prior-period revisions.
Gross Domestic Product (GDP) (Third-Quarter 2009 — Third Estimate). Due for release on Tuesday, December 22nd, the second revision (and last revision until next July’s annual revision) of third-quarter GDP should show little more than statistical noise.
New Orders for Durable Goods (November 2009). Due for release on Thursday, December 24th, the November monthly change again should be insignificant versus the regular month-to-month volatility seen in the series, with the level of activity continuing to bottom-bounce at a low-level plateau of activity.
__________