No. 290: Updated Liquidity and Economic Outlook
JOHN WILLIAMS’ SHADOW GOVERNMENT STATISTICS
COMMENTARY NUMBER 290
Updated Liquidity and Economic Outlook
April 9, 2010
__________
Mounting Liquidity Squeeze
Constrains Broad Business Activity
__________
PLEASE NOTE: The next regular Commentary is scheduled for Wednesday, April 14th, following the release of March 2010 CPI and Retail Sales estimates. Further Commentary will be published on Friday, April 16th, with analyses of the March Industrial Production and Residential Construction data.
– Best wishes to all, John Williams
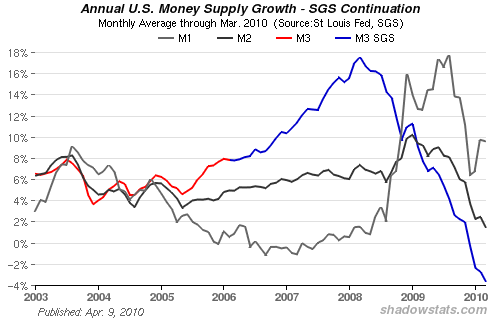
The broad money measure used here is M3 (and the SGS Ongoing Estimate of same), which, before inflation adjustment, contracted at an estimated modern record pace of 3.7% year-to-year, where 4.0% had appeared likely before the recent data revisions. Net of inflation, the annual contraction is estimated now at 5.8%. On a seasonally-adjusted, month-to-month basis, the March 2010 nominal (not adjusted for inflation) decline was roughly $144 billion, or 1.0% — an accelerating pace of decline — where the major contributing components were monthly declines of roughly $84 billion in institutional money funds, $30 billion in large time deposits and $30 billion in M2. With year-to-year growth in M2 revised higher, due to new estimates of retail money market funds, March’s estimated 1.4% monthly gain will be negative after inflation, the second M2 real annual decline in three months.
The first graph reflects the latest estimates of the nominal annual growth rates in M1, M2 and M3. The broadest measure, M3, generally is the most meaningful measure for analysis, where changes in the narrower M1 and M2 estimates often reflect nothing more than cash flowing between different accounts in the various measures.
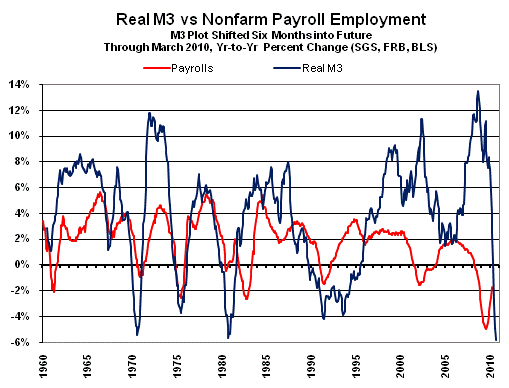
As discussed in recent Commentaries (see Commentary No. 277, for example), declining year-to-year change in real M3 signals a pending economic downturn or pending intensification of an existing economic contraction. The second graph shows the annual payroll change versus the approximate annual real contraction in the SGS Ongoing M3 Estimate for March 2010, as revised and updated. The M3 plot is shifted forward on the time scale by six months so as to show its leading relationship to payrolls.
Again, as the ongoing credit contraction squeezes personal and business consumption, most major economic series should begin to soften "unexpectedly" in upcoming reports and in economic releases of the next several months.
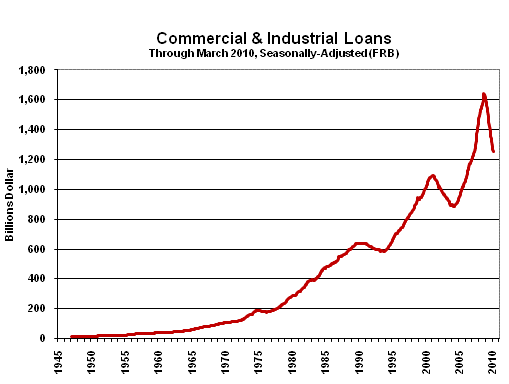
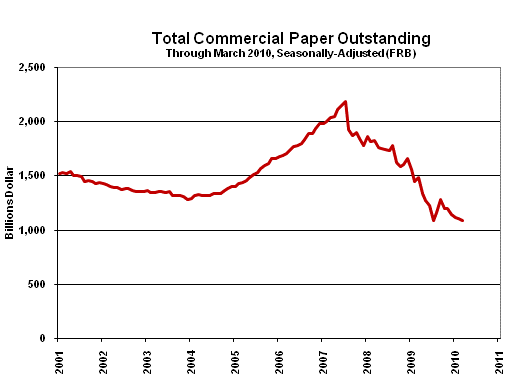
Short-Term Credit Measures Continue to Falter. Shown in the three graphs following are seasonally-adjusted monthly levels of consumer credit outstanding, commercial and industrial loans and commercial paper outstanding. Not only is each series at its lowest point of the current cycle, but also year-to-year contractions continue deep in recession territory.
For consumer credit, February 2010 was down by 4.0% year-to-year, the same level as in January. Commercial and industrial loans are estimated to be down year-to-year by 19.7% in March 2010, versus a 19.9% annual contraction in February. Commercial paper outstanding was down year-to-year by 26.7% in March, versus an annual decline of 23.5% in February.
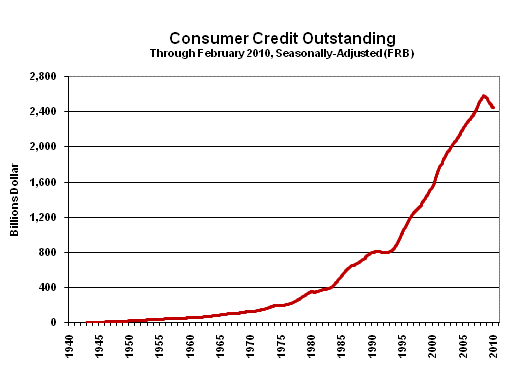
The Consumer Remains in Trouble. Based on the average of January and February 2010, real consumer credit in the first-quarter is down at a seasonally-adjusted annualized pace of 3.0% from the fourth-quarter. Similarly, real disposable income (as reported by the Bureau of Economic Analysis, both series deflated by the personal consumption expenditure or PCE deflator) is down at a seasonally-adjusted annualized pace of 0.5%. Contracting income and contracting debt do not support expanding real consumer consumption for long, and the consumer accounts for the bulk of GDP. Accordingly, do not be shocked by any near-term downside surprises in economic reporting.
Trade Balance (February 2010).The February trade deficit is due for release on Tuesday, April 13th. Significant catch-up still is due in trade-flow paper work, which opens the possibility of a much wider deficit for the month than otherwise might be expected.
Consumer Price Index – CPI (March 2010). Due for release on Wednesday, April 14th, the seasonally-adjusted March 2010 CPI-U should show a monthly increase, thanks to higher oil and gasoline prices, as well as to the slowly spreading broad impact of higher energy costs. Odds favor something on the plus-side of likely consensus expectations.
March 2010’s reported year-to-year inflation would increase or decrease versus February, dependent on the seasonally-adjusted monthly change, versus the 0.11% adjusted monthly decline seen in March 2009. I use the adjusted change here, since that is how consensus expectations are expressed. To approximate the annual inflation rate for March 2010, the difference in March’s headline monthly change versus the year-ago monthly change should be added to or subtracted directly from February 2010’s annual inflation rate of 2.14%. If March 2010 monthly CPI-U were unchanged (an increase is likely), year-to-year CPI would rise to 2.2% or 2.3%.
Retail Sales (March 2010).March retail sales activity is due for release on Wednesday, April 14th. Auto and same-store sales purportedly have been strong. Nonetheless, there should be some downside reporting risk to what likely will be strong expectations, particularly after seasonal adjustments, and after adjustment for inflation.
Industrial Production (March 2010).March industrial production is due for release on Thursday, April 15th. Again, some seasonal-factor catch-up and early signs of intensified downturn offer the risk of some downside reporting surprise.
Residential Construction (March 2010).Due for release on Friday, April 16th, March housing starts are not likely to show a statistically-significant monthly change, although levels of activity are at fair risk of starting to fall-off sharply, again.
__________