Flow of Funds Accounts of the United States
Reporting/Market Focus from the July 2006 Edition of the SGS Newsletter
While still funding the bulk of net U.S. Treasury and corporate debt issuance, foreign investors appear to have started a meaningful pullback in the buying of U.S. Treasuries. Such is the conclusion of an examination of the first-quarter 2006 flow of funds analysis released in June 2006 by the Federal Reserve.
The quarterly flow of funds accounts published by the Board of Governors of the Federal Reserve System (Z.1), reports on all the major sources and uses of cash and debt flows within the U.S. economy and against the rest of the world. The numbers actually tie into the U.S. National Income and Product Accounts (NIPA), such as the GNP/GDP. Of particular interest, the flows show major factors that affect the liquidity of the credit markets, including flows to and from investors outside the United States.
While the system is subject to some of the same foibles as GNP/GDP reporting, many of the problems with the broadest measure of U.S. economic activity are related to the deflation process, where the nominal or current-dollar numbers are deflated to the real or constant-dollar numbers. The flow of funds numbers use only the unadjusted data.
Where both the NIPA and flow of funds data are based on something akin to double-entry bookkeeping (consumption versus offsetting income numbers for NIPA, sources versus uses for the flow of funds), the two sides of the ledger rarely equal each other, and balance is achieved using a statistical discrepancy account.
That said, here is how some of the more interesting flows were reported on a not-seasonally-adjusted basis as of first-quarter 2006.


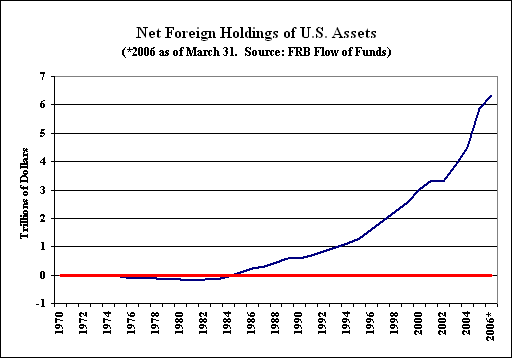
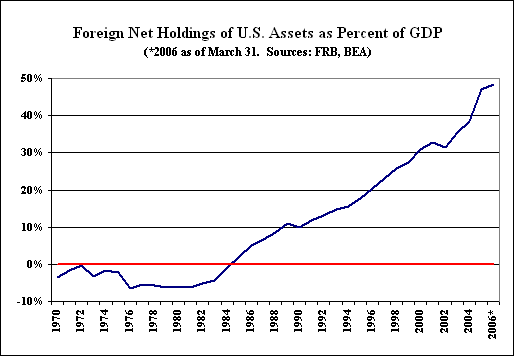
The two graphs above show the net foreign holdings of U.S. financial assets, as of year-end for the years through 2005, and as of quarter-end for first-quarter 2006. The top graph is expressed in trillions of dollars, the bottom as a percent of U.S. GDP, just to give the numbers a little scope. Net foreign holdings of U.S. financial assets rose to $6.3 trillion (or roughly 48% of GDP!) as of the end of first-quarter 2006. While the pace of growth appears to have slowed in the graphs, that is only because of the use of the first-quarter’s number against 2005 and earlier annual numbers. At an annualized pace, the first-quarter number is growing at a somewhat higher pace than the 30% growth rate seen for all of 2005.

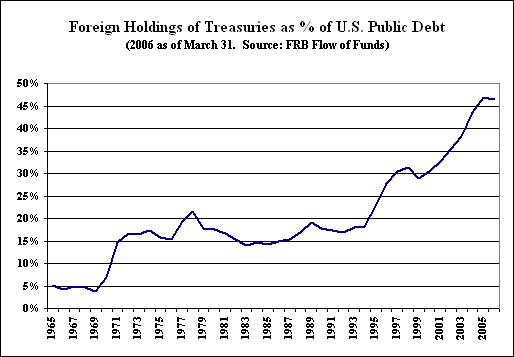
In the above graph, however, please note the foreign holdings of U.S. Treasuries as a percent of publicly held U.S. Treasury debt declined to 46.4% in the first-quarter from 47.0% at year-end 2005, and that is not a quarter-versus-annual distortion.
Based on the trailing four quarters’ net acquisition of U.S. Treasuries, foreign investors funded the equivalent of 62% of net Treasury debt issuance in 2003. That funding jumped to 101% in 2004, and eased back to 97% in 2005. Based on the four quarters through March 31, 2006, that number has fallen to 85%.
In other areas of investment holdings, as of both December 31, 2005 and March 31, 2006, foreign holdings of U.S. corporate bonds accounted for a record 29% of bonds outstanding, funding 51% of the net issuance of such securities in each of the trailing four quarters.
As to U.S. equities, foreign ownership accounted for 15.9% of the market at March 31, 2006, up from 15.2% at December 31, 2005.
Foreign investors have provided significant liquidity to the U.S. financial markets, particularly to the market for U.S. Treasuries, helping to keep U.S. interest rates in check. While net foreign holdings of U.S. assets have continued to increase at a robust pace, there appears to have been a recent slight shift away from the holdings of U.S. Treasuries.
We expect not only for that trend to intensify, but also for a major shift away from U.S. dollar assets to unfold. As those assets are sold and unwanted dollars are dumped, the greenback will come under major selling pressure, as will U.S. stocks and bonds, as liquidity is drained from the U.S. financial markets.
This month’s Reporting/Market Focus originally was scheduled to examine corporate profits. Events of the last month and timely introduction and coverage of first-quarter flow of funds data have bumped the profits focus to a later SGS. That said, corporate profits will be covered regularly and two contrasting measures are shown in this month’s Market Perspectives/Equities.