Indications of Serious Error in Current Government Economic Reporting
Section Four
(View all Sections of this Issue)
Indications of Serious Error in Current Government Economic Reporting
This Reporting/Market Focus looks at headline numbers from two key economic reports — monthly statistics that excite or roil the financial markets — and subsequent revisions to those series that suggest, at best, serious flaws in the government’s initial reporting of retail sales and nonfarm payroll employment.
Simply put, recent monthly headline numbers have tended to be overstated, as indicated by subsequent, massive downside revisions to the prior months’ reporting. I use the term "massive," because the revisions frequently are larger than those that would be suggested by the government’s published 90% and 95% confidence intervals. I use the term "overstated," because the nature of the revisions usually is to revise prior reporting downward. Such has the effect of allowing stronger reporting in the current month than would have been possible based on original reporting. It also means that the prior month’s headline number was overstated by the amount of the relative downward revision.
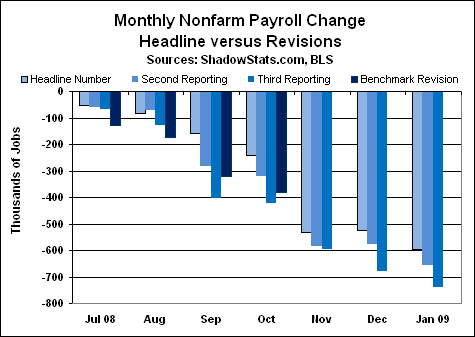
Consider nonfarm payrolls. The following graph shows the last seven months of reporting and revisions for the month-to-month seasonally-adjusted change in nonfarm payrolls.

As to total net revisions, from headline to latest (I only show those months with two months of revision in place), all displayed months have shown net downside revisions to the headline payroll number. As to statistical significance, the BLS publishes a 90% confidence interval around the headline number of +/- 107,000 jobs, and a 95% confidence interval around the headline number of +/- 129,000 jobs. In the period tracked above, net revisions in four out of seven months topped the both the 90% and 95%. The average occurrence of such large revisions at the 95% level should be about 1-in-20, instead of 11.4-in-20.
As discussed in recent newsletters, and as detailed in the Reporting/Market Focus of SGS Newsletter No. 43 of June 10, 2008, other statistical anomalies — tied to concurrent seasonal adjustment factors — appear to enable these unusual revisions to the payroll series.

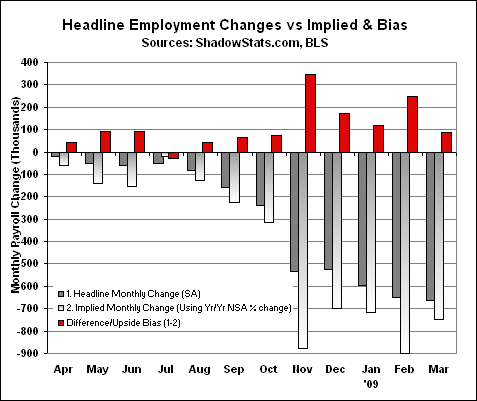
As noted earlier in the Employment/Unemployment section, the pattern of impossible biases being built into the headline monthly payroll employment continued with March 2009 reporting. Instead of the headline jobs loss of 663,000, consistent application of seasonal-adjustment factors — net of what I call the concurrent seasonal factor bias — would have shown a more-severe monthly jobs loss of about 750,000. As shown in the above graph, this upside reporting bias (red bar) has been seen in 11 of the last 12 months, with a rolling 12-month total upside headline-number bias of 1,345,000.
If one looks carefully at the downside revisions to the earlier payroll reporting, they often appear as a result of changing monthly seasonal-adjustment factors. Such is suggested where the revisions to the relatively hard, not-seasonally-adjusted numbers are nil, or go in the other direction of the reported seasonally-adjusted revisions. This is a circumstance that has been enabled by the BLS’s "concurrent" seasonal adjustment practices, which calculate current-month and recalculate recent-month seasonal adjustments each month. In most other economic series, seasonal factors are determined in advance and are held constant for six months to a year. Over the period of a year, seasonally-adjusted and unadjusted series should be equal to each other. Instead of balancing out, however, the unusual seasonal-adjustment patterns appear to have "created" an extra 1,345,000 jobs in the headline employment during the last year.
In the bias graph, the year-to-year change in the unadjusted number is applied to recast the seasonally-adjusted number. The unadjusted annual rate of change is applied to the prior year’s seasonally-adjusted number to estimate the current year’s seasonally adjusted number. Where annual growth in adjusted and unadjusted series should equal each other over the period of a year (such is the nature of seasonal adjustment in a balanced redistribution of data), the patterns should show random swings month-to-month, not a consistent upside bias.
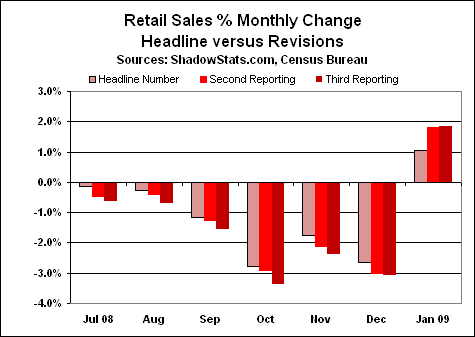
Consider now the retail sector. The following graph shows the last seven months of reporting and revisions for the month-to-month seasonally-adjusted change in "advance" retail sales.

As to net revisions, from headline to latest (I only show those months with two months of revision in place), all months but the latest have shown net downside revisions to the headline month-to-month retail sales change. As to statistical significance, the Census Bureau publishes a 90% confidence interval around the headline number of +/- 0.5%, and a 95% confidence interval around the headline number of +/- 0.6%. In the period tracked above, net revisions in four out of seven months topped the 90% limit, and three out of seven topped the 95% limit, including January 2009. The average occurrence of such large revisions at the 90% level should be about 1-in-10, instead of 5.7-in-10; at the 95% level it should be about 1-in-20, instead of 8.6-in-20.
These patterns have been seen irregularly in other key economic series, such as housing starts and new home sales, new orders for durable goods, etc. The problem may be as simple as the government not being able to survey key economic series meaningfully, on a monthly basis, during periods of rapid change, particularly in a deep recession. There also could be some very deliberate manipulation at work, particularly with the payroll numbers. Whatever the case, the government’s data are not being published with the promised level of accuracy, and the markets often are being moved based on misleading data.
___________________________________________
End of Section Four
(View all Sections of this Issue)