No. 300: May Employment and Unemployment
JOHN WILLIAMS’ SHADOW GOVERNMENT STATISTICS
COMMENTARY NUMBER 300
May Employment and Unemployment
June 4, 2010
__________
May Nonfarm Payrolls Rose 20,000 Net of 411,000 Temporary Census Hires
And Fell by 31,000 after Revisions and Birth-Death Model Shenanigans
May Household-Survey Employment Fell by 35,000
Irrespective of Census Hires
Unemployment Rates Were Artificially Low Due to Census Effects:
9.7% (U.3), 16.9% (U.6), 21.7% (SGS)
M3 Signal for Double-Dip Downturn Intensifies
__________
PLEASE NOTE: Due to the unusual features of today’s employment/unemployment reporting and the time spent in assessment of same, the extended comments planned for today on the nature of the M3 contraction and its implications for the economy and inflation will be addressed in a standalone Commentary on Monday, June 7th. The preliminary estimate of May M3 will be posted this weekend on the Alternate Data page for M3. The next regular Commentary thereafter is scheduled for Friday, June 11th, following the release of the May retail sales report, and will include an assessment of the prior day’s April trade deficit report.
NEW FEATURE: See details at the end of the Commentary as to the introduction of new economic charts available on the SGS Web site.
– Best wishes to all, John Williams
While there may be some catch-up here from earlier overstatement of jobs growth, the timing is right for the onset of the intensified recession/depression, which has been signaled since late-2009 by annual contractions in real (inflation-adjusted) broad money supply (see below). Anecdotal evidence suggests that upcoming May retail sales reporting also might be below expectations.
Where the census hiring impact was definable for the payroll survey, and properly was not seasonally adjusted, the effect on the unemployment rate is difficult to assess, although it certainly contributed to the reported decline in the headline U.3 unemployment rate. To the extent that new census employees already had other part-time work, their hiring by the Census Bureau would not have moved the unemployment number.
The numbers suggest that the census hiring effect has been, at least to a certain extent, seasonally adjusted in the household survey reporting, distorting a variety of unemployment measures. Consider (all numbers are seasonally adjusted) that the payroll survey showed overall government employment increased by 390,000, but the household survey (unemployment rate survey) showed those employed by the government fell by 170,000. One might expect the census hires to fall into the category of those working part-time, but those working part-time for economic reasons (part of the U.6 unemployment rate calculation) fell by 171,000, while those working part time for non-economic reasons fell by 211,000. As a separate issue, short-term discouraged workers fell by 114,000, with the bulk of those likely moving into the long-term discouraged worker category, as year-ago massive jobs loss became ancient history to the BLS statisticians. These factors contributed to the reported decline in the broader U.6 unemployment rate.
If this first significant economic report for May 2010 is a harbinger of the intensified downturn in business activity, such will be confirmed by other reporting in the next month or so. Next week’s retail retail sales report has a fair shot of providing such confirmation.
Reporting of the May Labor Environment. Payroll Survey. The Bureau of Labor Statistics (BLS) reported a statistically-significant, seasonally-adjusted jobs gain of 431,000 (up by 409,000 net of revisions) +/- 129,000 (95% confidence interval) for May 2010. Net of 411,000 intermittent and temporary census hires, however, the May jobs gain was a statistically-insignificant 20,000 (a contraction of 2,000 net of prior period revisions). Although the April jobs gain held at 290,000, as initially reported, payroll levels were revised lower by 22,000 for both March and April 2010.
Based on the patterns of hiring and firing temporary workers for the 2000 census, layoffs from the 2010 census will begin meaningfully in June 2010, with next month’s total payroll reporting very likely to show a large jobs loss as a result. Payrolls likely will be in monthly contraction, as well, net of census discharges.
From peak-to-trough (the peak month was December 2007; December 2009 is the likely short-lived trough of the current cycle), payroll employment has declined by a seasonally-adjusted 8,363,000 jobs, or 6.1%.
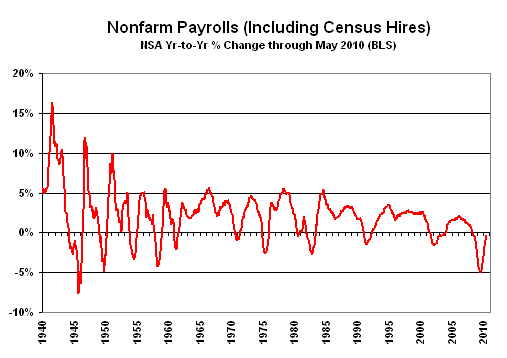
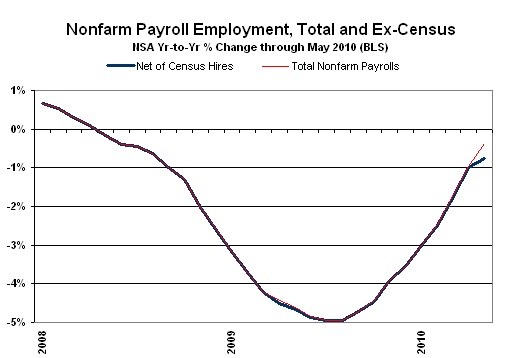
The pace of reported monthly change has turned relatively positive versus year-ago comparisons of sharp month-to-month declines, yet the year-to-year change in not-seasonally-adjusted payrolls has remained in negative territory, even with the May’s peak in temporary census hiring. The year-to-year contraction in total nonfarm payrolls narrowed to 0.37% (a contraction of 0.75% net of census hires) in May, from a 0.97% (1.00% net of census hires) annual contraction in April.
The current annual declines have narrowed from the post-World War II record 4.96% decline in July 2009. The July 2009 decline was the most severe annual contraction seen since the production shutdown at the end of World War II, which reflected a trough of a 7.59% annual contraction in September 1945. Disallowing the post-war shutdown as a normal business cycle, the current annual decline remains the worst since the Great Depression.
The long-term graph of year-to-year payroll change reflects the numbers as reported, with no adjustment for census hiring. The second graph, however, shows the year-to-year detail both with and without the census hires.


Birth-Death/Bias Factor Adjustment. Unusual activity repeated in May 2010, with the monthly birth-death adjustment adding 29,000 more jobs than in May 2009, a pattern contrary to what would be suggested by recent reporting difficulties that have understated declines in payroll employment. The Birth-Death Model biases tend to overstate payroll employment levels — to understate employment declines — during recessions. These flaws were confirmed by the nature of the BLS’s massive benchmark revision published with the January 2010 report, where the BLS had indicated that the underlying assumptions to the Birth-Death Model were missing significant jobs losses due to business failures that the BLS could not measure on a timely basis.
Although the upside bias has been scaled down some from last year as a result of the reporting errors, the Birth-Death Model survives and remains a major distorting factor in monthly payroll reporting, likely adding in excess of 230,000 phantom jobs per month at present. That now could be roughly 250,000 to 300,000, given the unusual April and May data. Such misreporting, however, will not be corrected until the next benchmark revision is published in February 2011, after the November 2010 elections.
The unsupportable premise that jobs created by start-up companies in this downturn have more than offset jobs lost by companies going out of business, continues. So, if a company fails to report its payrolls because it has gone out of business, the BLS assumes it still has its previously-reported employees and adjusts those numbers for the trend in the company’s industry. The "surplus" jobs created by start-up firms, which get added on to the payroll estimates each month as a special add-factor, were revised lower in the most-recent benchmark — the only portion of the model that was scaled back — averaging at present roughly an extra 36,000 seasonally-adjusted jobs per month. This monthly bias should be negative by 200,000 or so, on average. Since it is not, again, the BLS continues regularly to overestimate monthly growth in payroll employment by roughly 230,000 jobs, plus.
That said, the unadjusted May 2010 bias was a monthly addition of 215,000 jobs, versus an addition of 186,000 jobs in May 2009, and against a monthly addition of 188,000 jobs in April 2010.
Household Survey. The usually statistically-sounder household survey, which counts the number of people with jobs, as opposed to the payroll survey that counts the number of jobs (including multiple job holders), showed a seasonally-adjusted monthly employment contraction of 35,000 in May, irrespective of any census pick-up, versus an estimated gain in April of 550,000. As discussed in the opening comments, however, the series appears to have suffered major distortions by the inappropriate seasonal-adjustment of the surge in temporary census workers. Such action assures sharp upside movements in the unemployment rate in the next several months as these distortions are reversed.
The May 2010 seasonally-adjusted U.3 unemployment rate was reported at 9.70% +/- 0.23% (95% confidence interval). The 0.16% monthly contraction versus April’s estimate of 9.86%, however, was statistically insignificant. Unable to account for temporary census jobs in its survey, the BLS is unable to account for the impact of the census hires, although it had to help lower the headline U.3 unemployment rate. As noted in the yesterday’s Commentary, the May unemployment rate would have declined to 9.6% if all the people hired for the census were counted as newly employed. Unadjusted U.3 was reported at 9.3% in May, down from 9.5% in April.
The broader unemployment measures also appear to have suffered distortions from the census employment swing (see opening comments). May U.6 unemployment eased to an adjusted 16.6% (eased to 16.1% unadjusted) from 17.1% (16.6% unadjusted) in April.
During the Clinton Administration, "discouraged workers" — those who had given up looking for a job because there were no jobs to be had — were redefined so as to be counted only if they had been "discouraged" for less than a year. This time qualification defined away the long-term discouraged workers. The remaining short-term discouraged workers (less than one year) are included in U.6.
Adding the excluded long-term discouraged workers back into the total unemployed, unemployment — more in line with common experience as estimated by the SGS-Alternate Unemployment Measure — eased back to about 21.7% in May from 22.0% in April. While the some of the heavy jobs loss of a year ago is moving to the long-term discouraged workers category, the SGS estimate is built upon the official U.6 reporting and tends to follow its relative monthly movements. See the Alternate Data tab for a graph and more detail.
As discussed in general, previously, while 21.7% unemployment might raise questions in terms of a comparison with the purported peak unemployment in the Great Depression (1933) of 25%, the SGS level likely is about as bad as the peak unemployment seen in the 1973 to 1975 recession. The Great Depression unemployment rate was estimated well after the fact, with 27% of those employed working on farms. Today, less that 2% work on farms. Accordingly, for purposes of a Great Depression comparison, I would look at the estimated peak nonfarm unemployment rate in 1933 of 34% to 35%.
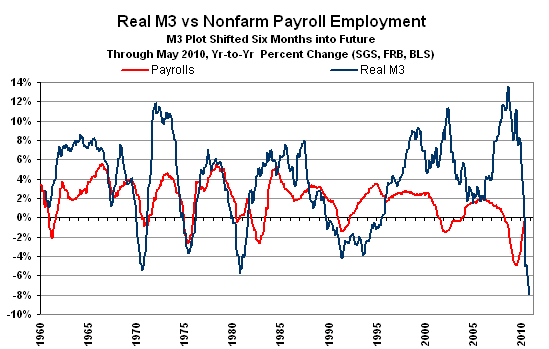
Signal Continues to Intensify for Renewed Economic Downturn. As discussed in recent Commentaries (see Commentary No. 296, for example), declining year-to-year change in real (inflation-adjusted) M3 signals a pending economic downturn or pending intensification of an existing economic contraction, with contracting broad liquidity invariably constraining broad economic activity. The following updated graph reflects both the annual payroll change and the approximate annual real contraction in the SGS Ongoing-M3 Estimate as of May 2010. The M3 plot is shifted forward on the time scale by six months so as to show the leading relationship of its annual contractions to payroll activity. The May M3 estimate is an annual contraction of roughly 7.9% versus a 7.0% contraction in April. Details will be discussed in the next Commentary (June 7th), which will be dedicated to the money supply circumstance. The formal preliminary estimate for the SGS Ongoing M3 Measure for May will be posted this weekend on the Alternate Data page for M3.

Trade Balance in Goods and Services (April 2010). The April trade deficit is scheduled for release on Thursday, June 10th. Briefing.com shows a consensus forecast of a widening to $41.5 billion, from $40.4 billion reported in March. The higher consensus expectation probably is due to higher oil prices in April. Reporting risk, however, remains for a worse-than-expected deficit, given likely still-pending catch-up in paperwork flows for imports.
Retail Sales (May 2010). The May retail sales report is scheduled for release on Friday, June 11th. Despite the relative weakness of April’s 0.4% monthly gain being blamed on an early Easter pulling sales into March, Briefing.com showed a consensus monthly gain of 0.5% earlier this week for May retail sales. As of today, the consensus reportedly is at 0.2%. As key data begin to reflect the intensifying downturn in business activity, reporting will tend to be weaker than expectations. Reporting risk accordingly is in that direction for May’s retail report.
NEW SGS WEB-SITE FEATURE: We are pleased to announce publication of a set of charts, which display various data-sets within the official Payroll and Household Surveys of the Bureau of Labor Statistics. These charts reflect only official reporting, with no SGS adjustment or assessment, but they often can tell interesting stories. They will be updated automatically whenever the monthly surveys are published. We plan to expand coverage to other aspects of employment, and to other areas of economic and market activity. As usual, all feedback is welcomed. (Use this link to find the new pages, or go to the Alternate Unemployment Chart page and follow links from there. Full navigation links will be introduced on the site soon.)
__________