No. 362: Trade, Liquidity, Hyperinflation Watch
COMMENTARY NUMBER 362
Trade, Liquidity, Hyperinflation Watch
April 12, 2011
__________
Near-Term Hyperinflation Risk Continues to Progress
Trade Deficit Should Be a Negative for First-Quarter GDP
__________
PLEASE NOTE: The next regularly scheduled Commentary is for Friday, April 15th. It will assess the latest CPI, PPI, Retail Sales and Industrial Production.
With this Commentary we add as a new feature the Hyperinflation Watch section, which will be updated regularly for near-term developments as they relate to the unfolding, or lack of same, of the hyperinflation scenario discussed in Hyperinflation Special Report (2011).
—Best wishes to all, John Williams
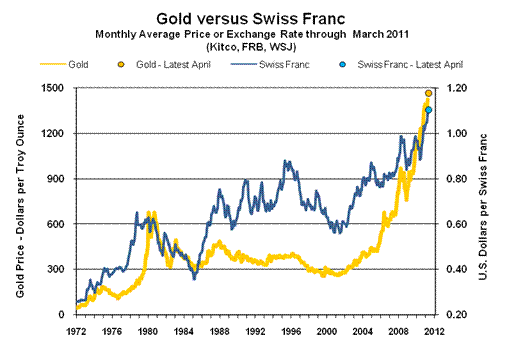
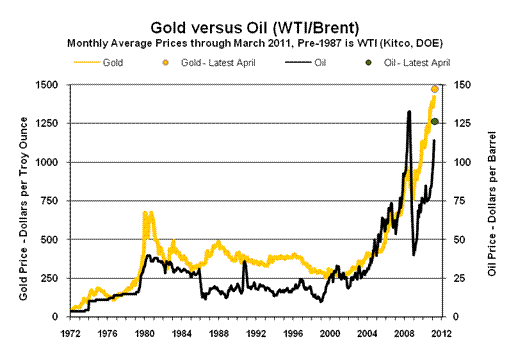
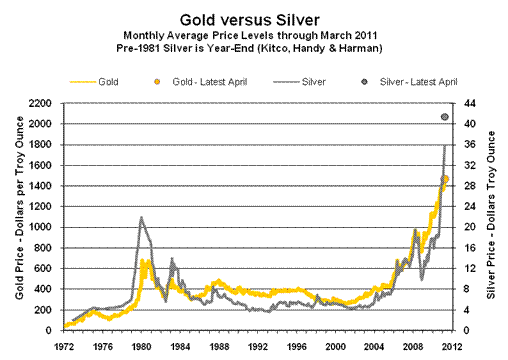
Hyperinflation Watch. In line with expectations detailed in the Hyperinflation Special Report (2011), near-term circumstances generally have continued to deteriorate. As measured by the consumer price index and as reflected in the dollar’s recent record-low values against the stronger major Western currencies and gold, the U.S. dollar is losing its purchasing power at an accelerating pace. On the political front, vitriolic tactics used during the recent fight over minimal budget cuts offer no hope of the current political powers being able to save the federal government from its long-term insolvency. Yet, there seems to be enough aggressive new blood in the system that the issues may get at least a good public airing. What has happened and is happening remains consistent with the general outlook detailed in the hyperinflation special report.
The primary driving force behind the intensifying U.S. dollar weakness and mounting global avoidance of the U.S. currency remains the Federal Reserve’s accelerating efforts at dollar debasement. Also hitting the dollar, though, are increasing instabilities in and ineffectiveness of political Washington, D.C., as viewed by the rest of the world.
Reverberations from the great Japanese earthquake and the ongoing political turmoil in the Middle East and North Africa have added to global financial instabilities and oil price volatility, yet the dollar still is being shunned as a safe-haven. That status increasingly appears to have been lost. Accordingly, dollar weakness still remains the primary driving force behind rising oil prices.
As seen in recent benchmark revisions (payrolls, industrial production), and as likely will be seen in upcoming reporting and pending benchmark revisions (retail sales, GDP), the “recovery” has started to evaporate. Much weaker-than-expected economic data should be seen in the months ahead. Not only are the implications here horrendous for U.S. fiscal conditions, but the Federal Reserve likely will expand its rapidly expiring QE2 (broad money supply still has shown no major impact from QE2), or introduce QE3. In turn, this should intensify U.S. dollar selling as well as U.S. consumer inflationary pressures. Following are the updated graphs of gold versus the Swiss franc, oil and silver. Trade Deficit Remains a Big Negative for First-Quarter GDP Estimate. Since the February trade deficit is the last trade number reported before the BEA attempts to guesstimate growth in first-quarter GDP, the impact of net exports on that initial estimate should be set. A quarterly narrowing of the deficit is a plus for GDP growth, a quarterly widening of the deficit is a negative for GDP growth. Per the trade report, the annualized merchandise trade deficit—deflated and seasonally-adjusted consistent with GDP reporting—narrowed from $596.1 billion in third-quarter 2010, to $543.3 billion in fourth-quarter 2010. Based on today’s numbers, that fourth-quarter gain has been wiped out fully, with a widening in the first-quarter 2011 deficit to $598.3 billion. While other data games played by the BEA may alter the results, it would be difficult to massage these numbers into positive impact for the quarter. Nominal (Not-Adjusted-for-Inflation) Trade Deficit. The Bureau of Economic Analysis (BEA) and the Census Bureau reported today (April 12th) that the nominal, seasonally-adjusted monthly trade deficit in goods and services for February 2011 narrowed to $45.8 billion from a revised $47.0 (previously $46.3) billion in January 2011. The February 2011 deficit widened, though, from $39.7 billion a year ago. Against January 2011, the February trade balance showed declines in both exports and imports, with the import decline steeper than that for exports. Oil imports softened, reflecting lower physical import volume and a small pickup in reported import prices. Specifically, for the month of February 2011, the not-seasonally-adjusted average price of imported oil was $87.17 per barrel, up from $84.34 in January 2011, and up from $72.92 in February 2010. In terms of not-seasonally-adjusted physical oil imports, February 2011 volume averaged 8.656 million barrels per day, versus 9.376 million in January 2011 and 8.689 million in February 2010. Real (Inflation-Adjusted) Trade Deficit. Adjusted for seasonal factors and net of rising oil prices and other inflation (2005 chain-weighted dollars as used in reporting real GDP), the reported February 2011 merchandise trade deficit came in at $49.5 billion, the same level as initial reporting for January, although January widened sharply to $50.3 billion in revision. The January and February estimates are all that will be available to the BEA when it estimates the “advance” annualized quarterly growth rate for real first-quarter 2011 GDP, on April 28th. The January and February deficits annualize out to $598.3 billion ($594.1 billion was the estimate based only on initial January reporting). That is up meaningfully from the fourth-quarter goods deficit, which was at an annualized pace of $543.3 billion, and it suggests significant downside pressure on the advance GDP estimate, effectively offsetting fully the reported fourth-quarter GDP gains that resulted from a narrowing in the fourth-quarter trade balance.
Week Ahead. Though not yet commonly recognized, there is both an intensifying double-dip recession and a rapidly escalating inflation problem. Until such time as financial-market expectations catch up with underlying reality, reporting generally will continue to show higher-than-expected inflation and weaker-than-expected economic results in the month and months ahead. Increasingly, previously unreported economic weakness should show up in prior-period revisions, benchmark or otherwise.
Retail Sales (March 2011). Release of March 2011 retail sales is scheduled for Wednesday, April 13th. Beyond the ongoing fundamental weakness in consumer liquidity, the Japanese earthquake and unrest in the Middle East and North Africa have distracted consumer spending in the last month or so, with people sitting at home watching television rather than going out and hitting the malls. Even so, reporting likely will be softer than already-tepid consensus expectations of a 0.5% monthly gain (Briefing.com), versus the 1.0% gain reported initially for February.
Of greater significance, the consensus forecasters also are looking at 0.5% for March CPI, which means that real (inflation-adjusted) retail sales in the month are not expected to have grown at all. More likely, real retail sales will be down for March, when both the actual retail and CPI reports are in place.
Watch for probable major downside revisions to the last couple of years of reported retail sales activity, when the annual benchmark revision to the series is published on April 29th.
Producer Price Index—PPI (March 2011). Release of the March 2011 PPI is scheduled for Thursday, April 14th. In the real world, wholesale inflation in March was worse than in February. Any reporting to the contrary—in the seasonally-adjusted headline series—simply would be a distortion of the seasonal-adjustment process.
Consumer Price Index—CPI (March 2011). Release of the March 2011 CPI is scheduled for Friday, April 15th. Gasoline prices rose on average by more than 10% in March, per the Department of Energy. By itself, such a gain would add roughly 0.6% to the unadjusted monthly CPI-U, but seasonal adjustments will temper the reported adjusted gain. Separately, though, given the unusual nature of March’s spiked gasoline prices, the Bureau of Labor Statistics (BLS) could use its “intervention analysis” option to mitigate the otherwise relatively meaningless seasonal reduction in reported gasoline price inflation.
Given ongoing inflation problems with food and the spreading impact of higher oil-related costs in the broad economy, reporting risk is to the upside of consensus expectation, which is at 0.5% for the headline CPI-U monthly gain, per Briefing.com.
Year-to-year CPI-U inflation would increase or decrease in March 2011 reporting, dependent on the seasonally-adjusted monthly change, versus the virtually flat 0.02% adjusted monthly gain seen in March 2010. I use the adjusted change here, since that is how consensus expectations are expressed. To approximate the annual inflation rate for March 2011, the difference in March’s headline monthly change (or forecast of same) versus the year-ago monthly change should be added to or subtracted directly from February 2011’s reported annual inflation rate of 2.11%. A consensus monthly gain of 0.5% in March would result in an annual inflation rate of about 2.6%. In any event, CPI-U annual inflation is a fair bet to top 3% in April’s reporting.
Industrial Production (March 2011). Release of March 2011 industrial production is scheduled for Friday, April 15th. The consensus estimate for a headline gain of 0.6% (Briefing.com), versus a benchmark-revised unchanged level in February, is at some risk of offering a downside surprise. Upcoming reporting is in an environment of restated economic history that shows weaker economic activity in recent years than reported initially (see Commentary No. 360).
__________