No. 774: November Industrial Production, Housing Starts, FOMC
COMMENTARY NUMBER 774
November Industrial Production, Housing Starts, FOMC
December 16, 2015
___________
With Recession Deepening, the FOMC Finally Hiked Rates
November Industrial Production Tumbled, Confirming Recession:
Down Month-to-Month by 0.6% (-0.6%), Year-to-Year by 1.2% (-1.2%),
Quarterly and Annual Contractions Are Virtual Certainties in Fourth Quarter
Outside of Formal Recessions, the 1956 Steel Strike Was the Last Time
Headline Production Declined Year-to-Year by More than One-Percent
Fourth-Quarter Housing Starts Also Appear
Headed into Quarterly Contraction
Third-Quarter GDP Faces Downside Revision Pressures;
Fourth-Quarter GDP Increasingly Looks Like a Contraction
___________
PLEASE NOTE: The next regular Commentary, scheduled for Tuesday, December 22nd will cover the third estimate, second revision of third-quarter 2015 GDP, and November Existing-Home Sales. A subsequent Commentary on Wednesday, December 23rd, will cover November New Orders for Durable Goods and New-Home Sales. In the event of developments requiring a timely response between regular Commentaries, a Flash Commentary will follow.
Best wishes to all — John Williams
OPENING COMMENTS AND EXECUTIVE SUMMARY
With the U.S. Economy in Recession, the FOMC Finally Just Boosted the Fed Funds Rate. Discussed here frequently, whatever considerations dominated the meeting of the Federal Reserve’s Federal Open Market Committee (FOMC), odds are almost certain that the decision today (December 16th) to hike the federal funds rate by a quarter-point was not due to a recovering economy.
First, the economy is turning down anew, never having recovered fully from the collapse. Second, the FOMC’s economy-centered concerns post-2008 Panic largely were political cover for the quantitative easings and related covert efforts aimed at bailing out the banking system.
Paying homage to the political ploy—the canard of introducing quantitative easing ostensibly to boost economic activity— Fed Chair Janet Yellen noted at her post-FOMC press conference [Reuters], “With the economy performing well and expected to continue to do so, the committee judges that a modest increase in the federal funds rate is appropriate.”
Perhaps with not the best of timing, the Federal Reserve also released its estimate of the November 2015 Index of Industrial Production, today. Headline details were much worse than expected, showing monthly, quarterly and annual contractions in domestic production of a nature only seen in recessions. Beyond the deteriorating circumstances in the oil industry, the U.S. manufacturing sector never recovered from the collapse; it never has reclaimed its pre-recession or pre-collapse high. These unhappy circumstances are detailed in today’s Commentary.
The Fed had its reasons for attempting to restore some semblance of normalcy to the monetary system, and it had to have made its move in the context of internal assessments of a variety of risks that have survived the Panic of 2008 and still threaten the domestic- and global-financial systems.
After the various markets have had a chance to absorb the FOMC action for a relatively brief period, the U.S. dollar most likely will become heavily vulnerable to selling pressures triggered by the rapidly deteriorating domestic economic circumstance. That issue will be addressed here in the week ahead. If unusual interim circumstances arise, ShadowStats will respond as appropriate using a Flash Commentary, if a regular Commentary is not otherwise pending.
Economic Slowdown Is Intensifying. At present, third-quarter 2015 GDP growth likely faces a downside revision in next week’s third estimate, with headline growth pulling back from the current headline growth rate of 2.1%, very possibly to below the “advance” estimate of 1.5% seen initially with the headline third-quarter GDP reporting. Downside revisions likely will hit net exports, inventories, residential construction and personal consumption.
Separately, fourth-quarter 2015 GDP is at rapidly increasing risk of seeing an outright quarterly contraction, based on reporting of the last two months in retail sales, production and housing and the October trade-deficit detail. Again, more will follow here, shortly.
Today’s Commentary (December 16th). The balance of these Opening Comments provides summary coverage of November Industrial Production and Housing Starts.
The Hyperinflation Outlook Summary revision will follow next week. The broad outlook has not changed. If there are any circumstances that require timely comment, a Flash Commentary will be issued as needed, between regular Commentaries. In the interim, the latest Summary Outlook (November 4, 2015-based) is available here: Commentary No. 768.
The Week Ahead previews the reporting of the third estimate of third-quarter GDP, and November New Orders for Durable Goods and New- and Existing-Home Sales.
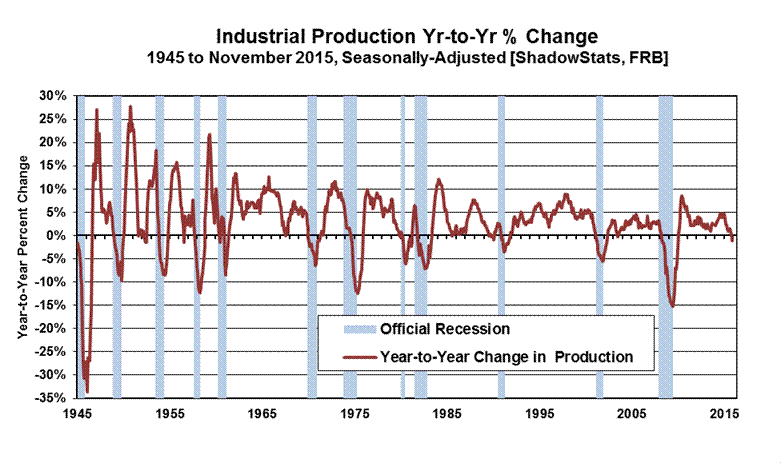
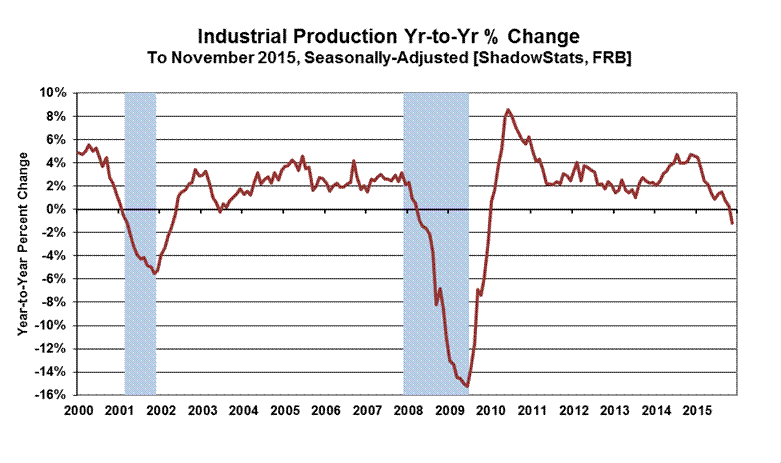
Index of Industrial Production—November 2015—Outright Recession in Place as November Production Declined Month-to-Month by 0.6% (-0.6%) and Year-to-Year by 1.2% (-1.2%). Fourth-quarter 2015 production also faces virtually-certain quarterly and annual contractions. A quarter-to-quarter contraction would be the third in the four quarters of 2015. Annual contractions are not seen outside of formal recessions.
In order for annual fourth-quarter growth to dodge a headline quarterly contraction, monthly growth in December would have to top 2.36% against initial November reporting. In order for annual fourth-quarter growth to dodge a headline annual decline, monthly growth in December would have to top 2.21% versus initial November reporting. Monthly headline growth rates have not hit those levels in the last 20 years, and there is no indication in hand otherwise of surging production for December.
Shown in Graphs 11 and 13 of the Reporting Detail, annual growth in production turned negative in a manner rarely seen outside of formal recessions. Other than occasional, minor downside blips in annual production—usually outliers associated with formal recessions—tumbling year-to-year industrial production activity, in excess of one-percent, has not been seen outside of formal recessions except for major labor disruptions, such as the 1956 Steel Strike. Economic disruptions from labor disputes usually are not recognized as recessions.
Intensifying Downturn in Quarterly and Annual Production in Second Month of Fourth-Quarter 2015. First-quarter 2015 production contracted at an unrevised annualized quarterly pace of 0.35% (-0.35%), followed by a revised pace of second-quarter 2015 contraction at 2.30% (-2.30%), followed by an upwardly revised 2.92% gain in third-quarter 2015 production.
Based solely on the headline reporting for October and November 2015, the early indication for fourth-quarter 2015 is an annualized quarterly contraction of 2.7% (-2.7%) in production activity. Discussed previously a quarterly contraction is a virtual certainty, the third in the last four months, the third-quarterly contraction in 2015. The headline November monthly production contraction was the ninth of the last eleven months.
Separately, year-to-year growth in quarterly production continued to slow and now has now declined, from a positive 4.47% in fourth-quarter 2014, to 3.47% in first-quarter 2015, to a revised 1.45% in second-quarter 2015, to a revised 1.21% in third-quarter 2015. Such a pattern of slowing annual growth has not been seen since first-quarter 2008, the official onset the economic collapse. The early indication for fourth-quarter 2015 production activity, based just on October and November production, is for a headline year-to-year decline in activity of 0.6% (-0.6%). Discussed previously, an annual contraction in the fourth quarter now is a virtual certainty. Annual quarterly production growth generally does not contract outside of periods that eventually are declared to be formal recessions.
The Fed’s industrial production series still indicates that broad economic activity has entered a “new” recession, one likely to be timed officially from December of 2014.
Headline Industrial Production—November 2015. In the context of a 0.07% (-0.07%) downside revision to the level of October 2015 production, headline November 2015 monthly production declined by 0.56% (-0.56%). Net of prior-period revisions, the November monthly contraction would have been 0.63% (-0.63%).
The headline November decline followed a revised, deeper monthly decline of 0.37% (-0.37%) in October, a shallower revised decline of 0.12% (-0.12%) in September, a revised 0.15% gain in August, and a revised 0.79% gain in July.
Detailed in Graphs 14 to 17 in the Reporting Detail, including major industry groups, the headline November 2015 monthly aggregate production decline of 0.6% (-0.6%) [an October contraction of 0.4% (-0.4%)] was composed of unchanged November manufacturing activity [an October gain of 0.3%]; a November decline in mining activity (including oil and gas production) of 1.1% (-1.1%) [an October decline of 2.4% (-2.4%)]; and a November decline of 4.3% (-4.3%) in utilities [an October decline of 2.8% (-2.8%)].
Year-to-year, November 2015 growth declined by 1.17% (-1.17%), versus a downwardly revised annual gain of 0.27% in October 2015, an upwardly-revised annual gain of 0.81% in September 2015, an upwardly-revised annual gain of 1.47% in August 2015, and an unrevised gain of 1.35% in July 2015. Again, annual growth has turned negative, a circumstance usually seen during periods of economic contraction that usually gain recognition as formal recessions.
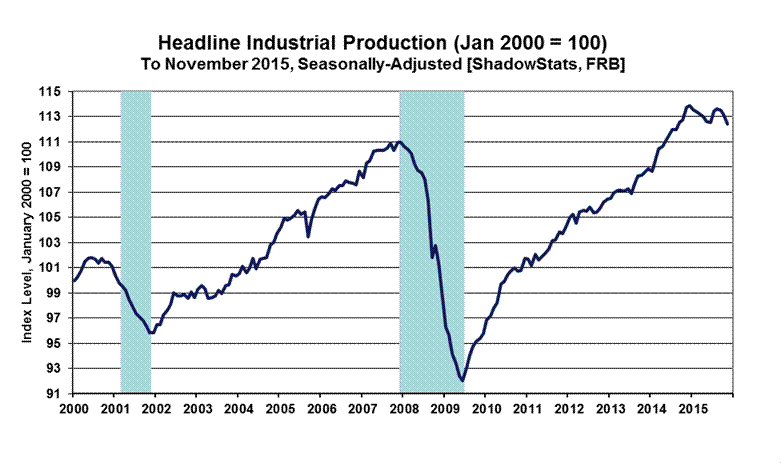
Production Graphs—Corrected and Otherwise. Again, the regular graphs of headline production level and annual growth detail are found in the Reporting Detail (Graphs 11 to 14), along with the drill-down graphs of major subcomponents of the production series (Graphs 15 to 22). The level of headline production showed a topping-out process late in 2014, followed by a deepening downturn into first- and second-quarter 2015, with November 2015 reporting well off recent-peak activity, despite a brief upturn in July and August activity, dropping sharply into negative year-to-year growth for the first time since the economic collapse. Such patterns of monthly, quarterly and annual decline were seen last in the depths of the economic collapse from 2007 into 2009.
Annual growth in November 2015 fell to an annual contraction of 1.17% (see Graphs 11 and 13). The last time that industrial production fell year-to-year by more than 1.00%, and the economy was not in an official recession, was during the 1956 steel strike. Labor disputes generally are not considered in defining recessions.
Graphs 1 and 2, which follow in this section, address reporting quality issues tied just to the overstatement of headline growth that results directly from the Federal Reserve Board using too-low an estimate of inflation in deflating some components of its production estimates into real dollar terms, for inclusion in the Index of Industrial Production.
Hedonic quality adjustments to the inflation estimates understate the inflation rates used in deflating those components; thus overstating the resulting inflation-adjusted growth in the headline industrial production series (see Public Comment on Inflation and Chapter 9 of 2014 Hyperinflation Report—Great Economic Tumble).
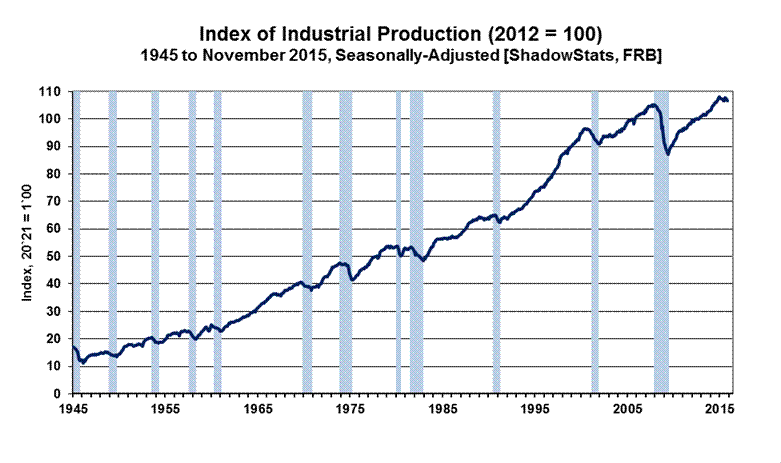
Graph 1 shows official, headline industrial production reporting, but indexed to January 2000 = 100, instead of the Fed’s formal index that is set at 2012 = 100. The 2000 indexing simply provides for some consistency in the series of revamped “corrected” graphics (including real retail sales, new orders for durable goods and the GDP); it does not affect the appearance of the graph or reported growth rates (as can be seen with a comparison to Graph 14 in the Reporting Detail section).
Graph 1: Indexed Headline Level of Industrial Production (Jan 2000 = 100)
Graph 2 is a recast version of Graph 1, corrected for the estimated understatement of the inflation used in deflating certain components of the production index. Estimated hedonic-inflation adjustments have been backed-out of the official industrial-production deflators used for headline reporting.
This “corrected” Graph 2 shows some growth in the period subsequent to the official June 2009 trough in production activity, however, that upturn has been far shy of the full recovery and the renewed expansion reported in official GDP estimation (see Commentary No. 769). Unlike the headline industrial production data and the headline GDP numbers, corrected production levels have not recovered pre-recession highs. Instead, corrected production entered a period of protracted low-level, but up-trending, stagnation in 2010, with irregular quarterly contractions seen through 2014, and an irregular uptrend into 2014, a topping-out in late-2014 and turning down into 2015 through the latest reporting, despite a limited and short-lived activity spike in July and August 2015.
Graph 2: Headline ShadowStats-Corrected Level of Industrial Production (Jan 2000 = 100)
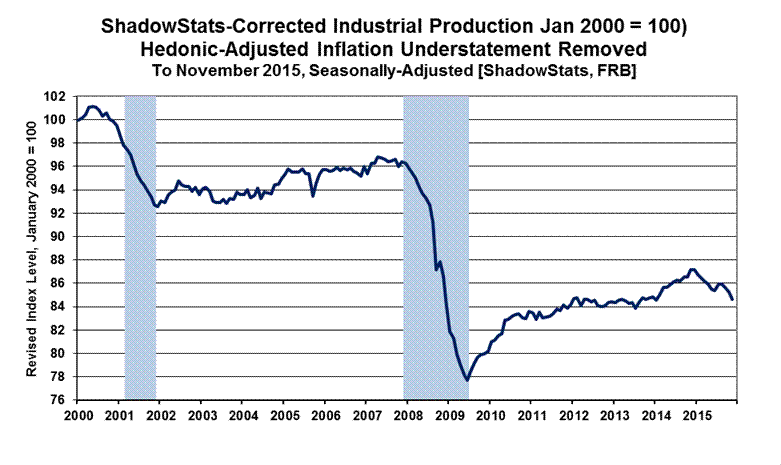
Where the corrected series has remained well shy of a formal recovery, both the official and corrected series suffered an outright contraction in both first- and second-quarter 2015; this is a pattern of severe economic weakness last seen during the economic collapse. Despite the uptick third-quarter activity, fourth-quarter 2015 industrial production appears set for both annual and quarterly contractions.
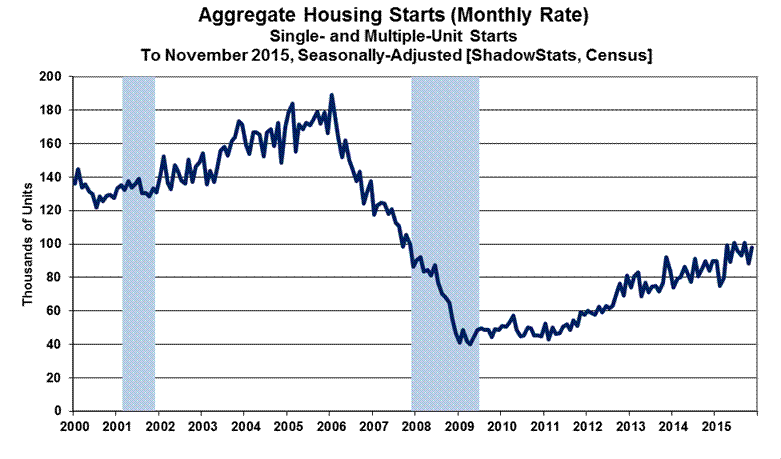
Housing Starts—November 2015—Amidst Volatile Monthly Reporting and an Unfolding Quarterly Contraction, Activity Continued in a Smoothed Pattern of Stagnation. Headline November housing starts took a jump to the upside after taking a monthly hit in October. Nonetheless, with two of three months in place for fourth-quarter 2015 activity, a fourth-quarter 2015 contraction versus third-quarter activity appears likely. Unlike the industrial production series, though, the unfolding fourth-quarter contraction is not a virtual certainty.
Monthly growth of 5.6% in December 2015, versus today’s initial reporting level of November 2015 housing starts activity would be enough to turn fourth-quarter 2015 activity to the plus-side. While such headline growth is well within the regular scope of the series, such activity does not commonly follow a prior month of heavily-overstated activity, which would be the circumstance for December headline growth versus today’s inflated, headline November detail.
Quarterly Growth Held Flat in the Third-Quarter and Still Prospectively Negative for the Fourth-Quarter. In terms of annualized quarterly change, the aggregate housing-starts count fell at an annualized-quarterly pace of 26.2% (-26.2%) in first-quarter 2015, rose at an annualized 96.3% pace in second-quarter 2015, and rose at a revised annualized third-quarter pace of just 0.2%. Based on October and November 2015 reporting, fourth-quarter 2015 starts are on track for an annualized contraction of 13.4% (-13.4%). That had been an annualized contraction of 28.6% (-28.6%), based just on initial October reporting.
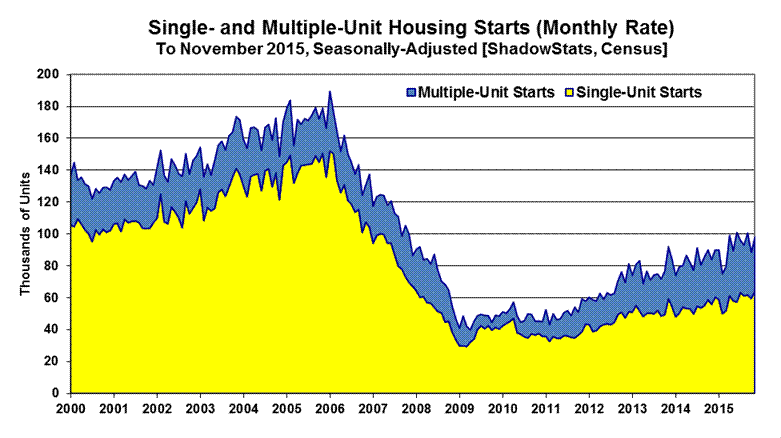
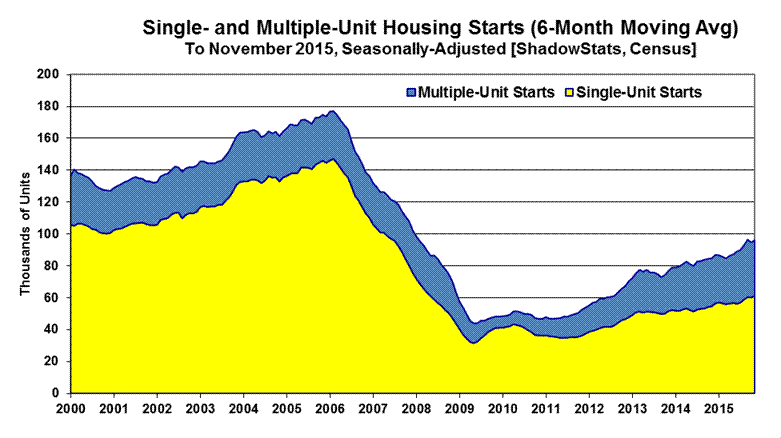
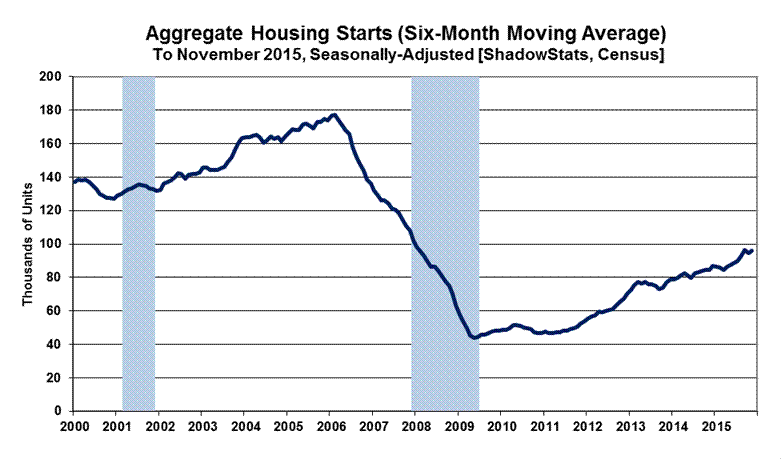
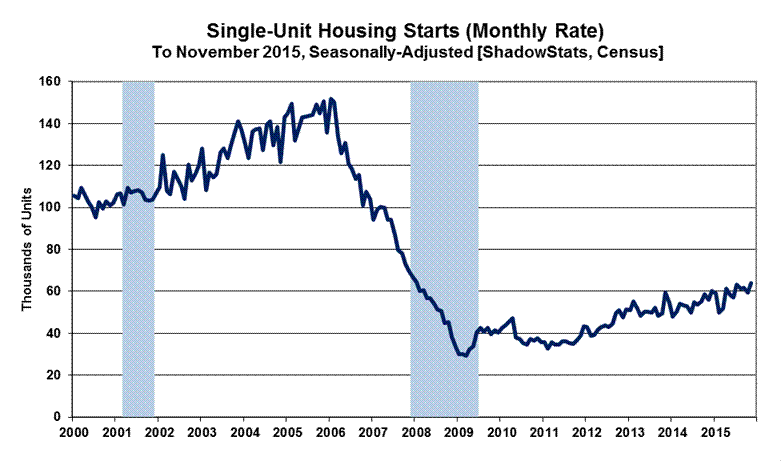
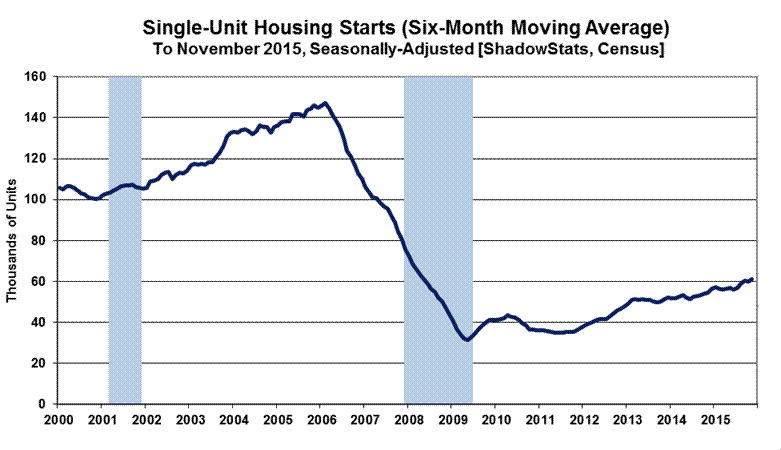
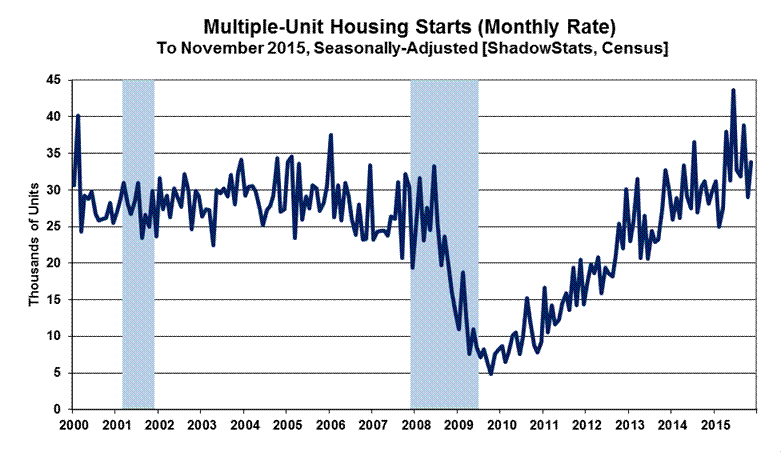
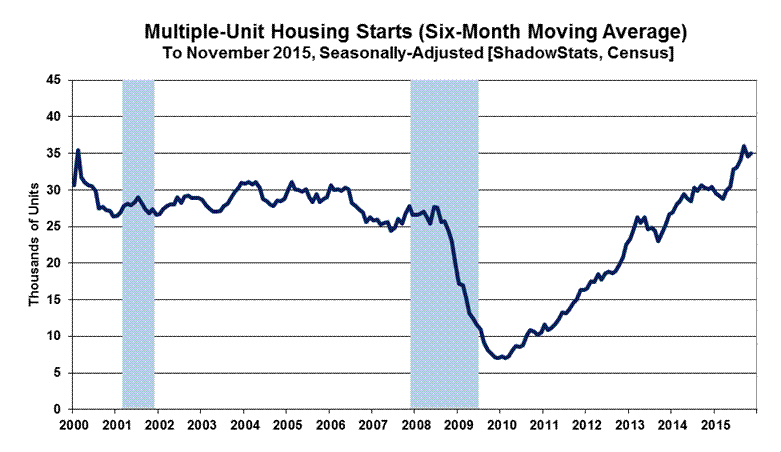
Smoothed Numbers. A general pattern of low-level stagnation continued, with its up-trending pattern faltering again with the most-recent headline detail. This is viewed best in terms of the longer-range historical graph of aggregate activity (Graph 24) at the end of the Reporting Detail, and particularly in the context of the headline activity, smoothed by a six-month moving average, as shown in accompanying Graph 6. While a minor upside trend in the broad pattern of stagnation in the aggregate series may be stalling, total November housing-starts activity remained well below any recovery level, down from its pre-recession high by 48% (-48%). Separately, the dominant, single-unit housing starts component of the series (see Graphs 7 and 8) remained down by 58% (-58%) from its January 2006 pre-recession peak.
Reflected in the smoothed graphs, aggregate housing-starts series ticked minimally higher in November, reflecting mild fluctuations in both the six-month smoothed single-unit (Graph 6) and multiple-unit starts (Graph 8) categories, where monthly activity rose for the month in both series.
Over time, the bulk of the extreme, reporting instability and the minimal uptrend in the aggregate series has been due largely to particularly-volatile reporting in the multiple-unit housing-starts category (apartments, etc.). Recent activity in multiple-unit starts had recovered to above pre-recession levels, again, in the context of extreme month-to-month volatility. Even so, the recent impact of that recovery may be fading, and otherwise it largely has been lost in the detail of total housing starts.
Consumer Liquidity Problems Continue to Impair Housing Activity. On a per-structure basis, housing starts volume, again, is dominated by the single-unit housing starts category, which has remained broadly stagnant on a smoothed basis, at a low level of activity since hitting bottom in early-2009. The private housing sector never recovered from the business collapse of 2006 into 2009.
The primary, underlying difficulty for the housing market remains intense, structural-liquidity constraints on the consumer. That circumstance, during the last eight-plus years of economic collapse and stagnation, has continued to prevent a normal recovery in broad U.S. business activity, as updated and discussed more fully in Commentary No. 772.
Without real (inflation-adjusted) growth in household income and without the ability or willingness to take on meaningful new debt, the consumer simply has not had the wherewithal to fuel sustainable economic growth. There remains no chance of a near-term, sustainable turnaround in the housing market, without a fundamental upturn in consumer and banking-liquidity conditions. That has not happened and does not appear to be in the offing.
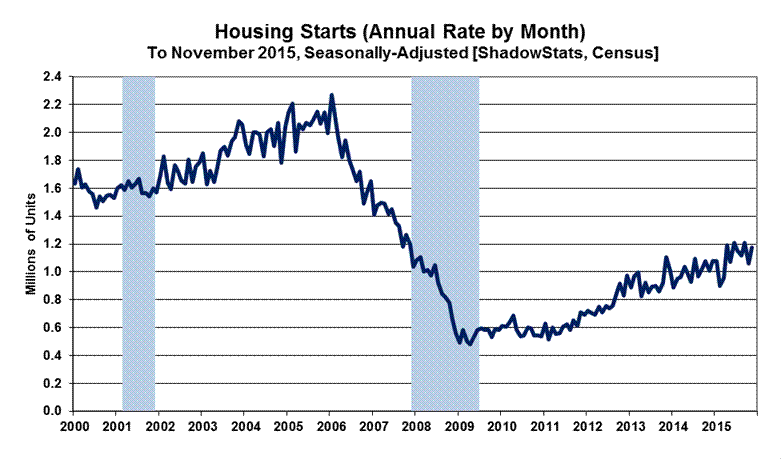
November 2015 Headline Detail. November 2015 Housing Starts bounced higher for the month, but not by enough for unfolding fourth-quarter activity to gain on the prior quarter. In the context of minimal upside revisions to September and October reporting, November starts showed a statistically-significant, seasonally-adjusted, headline monthly gain of 10.5%. Such followed a revised decline of 12.0% (-12.0%) in October, and a revised monthly gain of 8.2% in September. Net of prior-period revisions, November 2015 housing starts rose by 10.7% for the month, instead of the headline gain of 10.5%. The level-of- activity detail is plotted in Graphs 3 to 6 and in Graphs 23 to 24 in the Reporting Detail.
Year-to-year change in the seasonally-adjusted, aggregate November 2015 housing-starts measure was a statistically-significant gain of 16.5%, versus a revised annual contraction of 1.6% (-1.6%) in October 2015, and a revised annual gain of 17.6% in September 2015.
The November 2015 monthly gain of 10.5% in total housing starts reflected a headline monthly gain of 7.6% in the “one unit” category, and an increase of 18.1% in the “five units or more” category, but only the aggregate headline gain was statistically-significant.
By-Unit Category. Where the irregular housing starts series can show varying patterns, that partially is due to a reporting mix of residential construction products, with the largest physical-count category of one-unit structure housing starts—generally for individual consumption, resulting in new home sales—versus multi-unit structure starts that generally reflect the building of rental and apartment units.
Housing starts for single-unit structures in November 2015 gained month-to-month by a statistically-insignificant 7.6%, following a revised monthly decline of 3.6% (-3.6%) in October, and a revised monthly gain of 1.0% in September. Single-unit starts for November 2015 showed a statistically-significant year-to-year annual gain of 14.6%, versus a revised 1.3% gain in October 2015, and a revised annual gain of 12.1% in September 2015 (see Graphs 3, 4, 7 and 8).
Housing starts for apartment buildings (generally 5-units-or-more) in November 2015 rose month-to-month by a statistically-insignificant 18.1%, versus a revised monthly decline of 25.9% (-25.9%) in October, and a revised monthly gain of 21.0% in September. The statistically-insignificant November 2015 year-to-year gain of 21.3% followed a revised annual decline of 5.6% (-5.6%) in October 2015 and a revised 28.9% annual gain in September 2015.
Expanding the multi-unit housing starts category to include 2-to-4-units plus 5-units-or-more usually reflects the bulk of rental- and apartment-unit activity. The Census Bureau does not publish estimates of the 2-to-4-units category, due to statistical significance problems (a general issue for the aggregate series). Nonetheless, the total multi-unit category can be calculated by subtracting the single-unit category from the total category (see Graphs 3, 4, 9 and 10).
Accordingly, the statistically-significant November 2015 monthly gain of 10.5% in aggregate starts was composed of statistically-insignificant gains of 7.6% in one-unit structures and 16.4% in the multiple-unit structures categories (2-units-or-more, including the 5-units-or-more category). Again, these series all are graphed in this section.
Housing Starts Graphs. Headline reporting of housing starts activity is expressed by the Census Bureau as an annualized monthly pace of starts, which was 1,173,000 in November 2015, versus a revised 1,062,000 (previously 1,060,000) in October 2015. The scaling detail in the aggregate Graphs 23 and 24 at the end of the Reporting Detail section reflects those annualized numbers.
Nonetheless, given the nonsensical monthly volatility in reporting and the exaggerated effect of annualizing the monthly numbers in this unstable series, the magnitude of monthly activity and the changes in same, more realistically are reflected at the non-annualized monthly rate. Consider that the headline 236,000 month-to-month gain in the annualized April 2015 housing starts was larger than any actual total (non-annualized) level of monthly starts ever, for a single month. That is since related starts detail first was published after World War II.
Accordingly, the monthly rate of 97,750 units in November 2015, instead of the annualized 1,173,000-headline number, is used in the scaling of the accompanying Graphs 3 to 10, shown in these Opening Comments. With the use of either scale of units, though, appearances of the graphs and the relative monthly, quarterly and annual percentage changes are otherwise identical, as can be seen in a comparison of Graph 5 versus Graph 23 in the Reporting Detail.
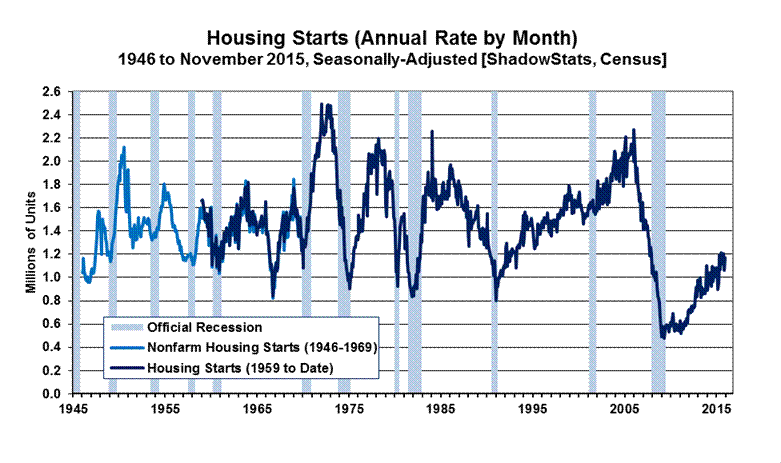
The record monthly low level of activity seen for the present aggregate series was in April 2009, where the annualized monthly pace of housing starts then was down 79% (-79%) from the January 2006 pre-recession peak. Against the downside-spiked low in April 2009, the November 2015 headline number was up by 145%, but it still was down by 48% (-48%) from the January 2006 pre-recession high. Shown in the historical perspective of the post-World War II era, current aggregate-starts activity is in up-trending stagnation at low levels that otherwise have been at or near the historical troughs of recession activity of the last 70 years, as seen in Graph 24 at the end of the Reporting Detail section.
[Graphs 3 to 10 Begin on the Next Page]
Graph 3: Single- and Multiple-Unit Housing Starts (Monthly Rate of Activity)
Graph 4: Single- and Multiple-Unit Housing Starts (Six-Month Moving Average, Monthly Rate of Activity)
Graph 5: Aggregate Housing Starts (Monthly Rate of Activity)
Graph 6: Aggregate Housing Starts (Six-Month Moving Average, Monthly Rate of Activity)
Graph 7: Single-Unit Housing Starts (Monthly Rate of Activity)
Graph 8: Single-Unit Housing Starts (Six-Month Moving Average, Monthly Rate of Activity)
Graph 9: Multiple-Unit Housing Starts (Monthly Rate of Activity)
Graph 10: Multiple-Unit Housing Starts (Six-Month Moving Average, Monthly Rate of Activity)
[The Reporting Detail section includes further material on
November CPI Industrial Production and Housing Starts.]
__________
HYPERINFLATION WATCH
HYPERINFLATION OUTLOOK SUMMARY. In the process of being updated for the latest economic, Federal Reserve and global-political developments, a revised Hyperinflation Outlook Summary will follow next week. Such allows for what could become rapidly unfolding developments in the days and week ahead. The broad outlook has not changed. If there are intervening developments that require immediate comment, a Flash Commentary will follow. In the interim, the latest Summary Outlook (November 4, 2015-based) is available here: Commentary No. 768.
__________
REPORTING DETAIL
INDEX OF INDUSTRIAL PRODUCTION (November 2015)
Outright Recession Signal as November Production Declined Month-to-Month by 0.6% (-0.6%) and Year-to-Year by 1.2% (-1.2%). Fourth-quarter 2015 production also faces virtually-certain quarterly and annual contractions. A quarterly contraction would be the third in the four quarters of 2015. Annual contractions are not seen outside of formal recessions. In order for annual fourth-quarter growth to dodge a headline quarterly contraction, monthly growth in December would have to top 2.36% against initial November reporting. In order for annual fourth-quarter growth to dodge a headline annual decline, monthly growth in December would have to top 2.21% versus initial November reporting. Monthly headline growth rates have not hit those levels in at least the last 20 years, and there is no indication in hand of surging production for December.
Shown in Graphs 11 and 13, annual growth in production turned negative in a manner rarely seen outside of formal recessions. Other than occasional, minor downside blips in annual production—usually outliers associated with formal recessions—tumbling year-to-year industrial production activity, in excess of one-percent, has not been seen outside of formal recessions except for major labor disruptions such as the 1956 Steel Strike. Economic disruptions from labor disputes usually are not recognized as recessions.
Intensifying Downturn in Quarterly and Annual Production in Second Month of Fourth-Quarter 2015. First-quarter 2015 production contracted at an unrevised annualized quarterly pace of 0.35% (-0.35%), followed by a revised pace of second-quarter 2015 contraction at 2.30% (-2.30%) [previously down by 2.28% (-2.28%), by 2.36% (-2.36%), by 2.61% (-2.61%), by 2.04% (-2.04%) and initially down by 1.75% (-1.75%)], followed by an upwardly revised 2.92% [previously up by 2.62%, initially up by 1.85%] gain in third-quarter 2015 production.
Based solely on the headline reporting for October and November 2015, the early indication for fourth-quarter 2015 is an annualized quarterly contraction of 2.7% (-2.7%) in production activity. That followed an initial estimate of a fourth-quarter contraction of 1.1% (-1.1%), based solely on October’s reporting. Discussed previously a quarterly contraction is a virtual certainty, the third in the last four months, the third-quarterly contraction in 2015. The headline November monthly production contraction was the ninth of the last eleven months.
Separately, year-to-year growth in quarterly production continued to slow and now decline, from a positive 4.47% in fourth-quarter 2014, to 3.47% in first-quarter 2015, to a revised 1.45% [previously 1.46%, initially 1.44%] in second-quarter 2015, to a revised 1.21% [previously 1.14%, initially 0.93%] in third-quarter 2015. Such a pattern of slowing annual growth has not been seen since first-quarter 2008, the official onset the economic collapse. The early indication for fourth-quarter 2015 production activity, based just on October and November production, is for a headline year-to-year decline in activity of 0.6% (-0.6%). That estimate was for 0.3% (-0.3%), based just on October reporting. Discussed previously an annual contraction in the fourth quarter now is a virtual certainty. Annual quarterly production growth generally does not contract outside of periods that eventually are declared to be formal recessions.
The Fed’s industrial production series still indicates that broad economic activity has entered a “new” recession, one likely to be timed officially from December of 2014.
Headline Industrial Production—November 2015. The Federal Reserve Board released its first estimate of seasonally-adjusted, November 2015 industrial production this morning, Wednesday, December 16th. In the context of a downside revision of 0.07% (-0.07%) to the level of October production, headline monthly production declined by 0.56% (-0.56%) in November 2015. Net of prior-period revisions, the November monthly contraction would have been 0.63% (-0.63%).
The headline November decline followed a revised monthly decline of 0.37% (-0.37%) [previously down by 0.15% (-0.15)] in October, a revised decline of 0.12% (-0.12%) [previously down by 0.21% (-0.21%), initially down by 0.19% (-0.19%)] in September, a revised 0.15% gain [previously up by 0.09%, down by 0.15% (-0.15%) and initially down by 0.38% (-0.38%)] in August, and a revised 0.79% gain [previously up by 0.78%, by 0.76%, by 0.87% and initially up by 0.56%] in July.
Detailed in Graphs 14 to 17, including major industry groups, the headline November 2015 monthly aggregate production loss of 0.6% (-0.6%) [an October contraction of 0.4% (-0.4%)] was composed of unchanged November manufacturing activity [an October gain of 0.3%]; a November decline in mining activity (including oil and gas production) of 1.1% (-1.1%) [an October decline of 2.4% (-2.4%)]; and a November decline of 4.3% (-4.3%) in utilities [an October decline of 2.8% (-2.8%)].
Year-to-year, November 2015 growth declined by 1.17% (-1.17%), versus a downwardly revised annual gain of 0.27% [previously up by 0.34%] in October 2015, an upwardly-revised annual gain of 0.81% [previously up by 0.66%, initially up by 0.39%] in September 2015, an upwardly-revised annual gain of 1.47% [previously up by 1.41%, by 1.11% and initially up by 0.91%] in August 2015, and an unrevised gain of 1.35% in July 2015. Again, annual growth has turned negative, a circumstance usually seen during what become known as formal recessions.
Production Graphs. The regular two sets of long- and short-term industrial production levels and annual growth rates (Graphs 11 to 14) set the background for the drill-down detail graphs of various components of the aggregate industrial series (Graphs 15 to 22).
Graphs 11 and 12, and Graphs 13 and 14 show headline industrial production activity to date. Graph 11 shows the year-to-year percent change in the aggregate series, in historical context since World War II. With the headline annual decline in production now deeper than 1.0% (-1.0%), the pattern again is one not seen outside of formal recessions, except for special circumstances such as national labor disputes.
Graph 12 shows the monthly level of the production index, with a topping-out and renewed downturn—deepening quarterly contractions in first- and second-quarter 2015, with a bounce in third-quarter 2015 now followed by an unfolding fourth-quarter contraction. Such patterns of monthly and quarterly declines and stagnation were seen last in the economic collapse into 2009. Graphs 13 and 14 show the same series for more-limited, recent historical detail, beginning January 2000.
Seen more clearly in the second set of graphs, the pattern of year-to-year activity dipped anew in 2013, again, to levels usually seen at the onset of recent recessions, bounced higher into mid-2014, fluctuated thereafter, now turning negative. Growth remains well off the recent relative peak for the series, which was 8.56% in June 2010, going against the official June 2009 trough of the economic collapse. Indeed, as shown in the first set of graphs, the benchmark-revised year-to-year contraction of 15.20% (-15.20%) in June 2009—the end of second-quarter 2009—was the steepest annual decline in production since the shutdown of wartime production following World War II.
Although official production levels have moved higher since the June 2009 trough, corrected for the understatement of inflation used in deflating portions of the industrial production index (see the Opening Comments section, Graph 2) the series has shown more of a pattern of stagnation with a slow upside trend, since 2009, with irregular quarterly contractions interspersed. The slow uptrend continued into a topping out pattern in late-2014. Headline real growth contracted in both first- and second-quarter 2015, with monthly activity trending lower again, following a third-quarter increase. The “corrected” series has done the same but remains well shy of a formal recovery.
Graph 11: Industrial Production, Year-to-Year Percent Change since 1945
Graph 12: Index of Industrial Production (Aggregate) since 1945
Graph 13: Aggregate Industrial Production, Year-to-Year Percent Change since 2000
Graph 14: Index of Aggregate Industrial Production since 2000
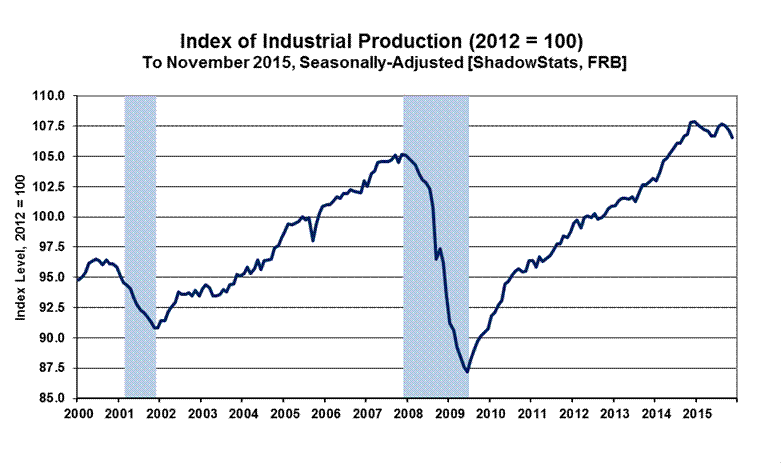
Drilling Down into the November 2015 U.S. Industrial Production Detail. Graphs 14 to 17 show headline reporting of industrial production and some major components. The broad index (Graph 14) contracted in both first- and second-quarter 2015, and is headed lower again, after a third-quarter bounce. That circumstance generally is not seen outside of recessions. Such is detailed in the regular reporting of headline production earlier in this section and in the Opening Comments.
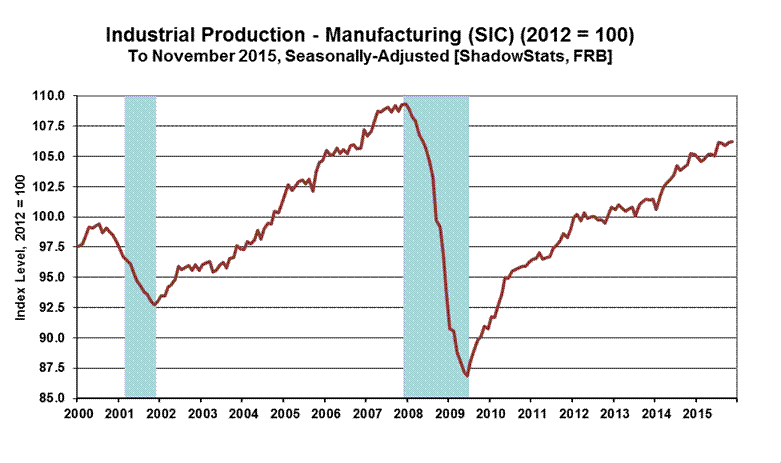
Graph 15: Industrial Production – U.S. Manufacturing (73.91% Weighting in Aggregate Index)
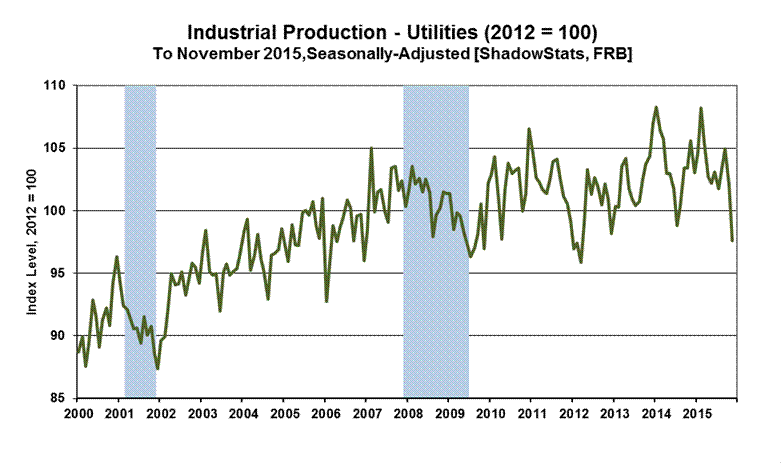
Graph 16: Industrial Production – U.S. Utilities (10.63% Weighting in Aggregate Index)
Graph 15 of the dominant manufacturing sector (73.91%) of aggregate production showed no change in November month-to-month activity, in the context of series that has yet to reclaim its pre-recession high.
The utilities sector activity (Graph 16), which accounts for 10.63% of aggregate activity, by weighting, declined in November. As usual, most of the heavy volatility in month-to-month activity reflects the temporary impact of “unseasonable” extremes in weather patterns.
Graph 17: Industrial Production – U.S. Mining, Including Oil and Gas (15.46% Weighting in Aggregate Index)
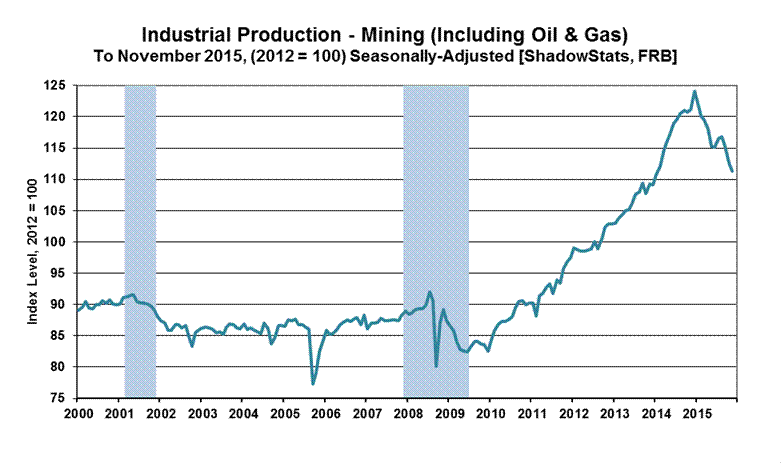
Mining-sector activity (Graph 17), accounts for 15.46% of aggregate industrial production activity, by weighting. Activity here, particularly in oil and gas exploration and production, remains the near-term focus of this analysis, where it has taken an increasing toll on aggregate production and broad economic activity. This sector easily recovered its pre-recession high and accounts for the full “recovery” in the aggregate production detail. Mining production, however, has turned down sharply recently, reflecting a number of factors, including the decline in oil prices (and related U.S. dollar strength). Broad November activity continued in deepening decline.
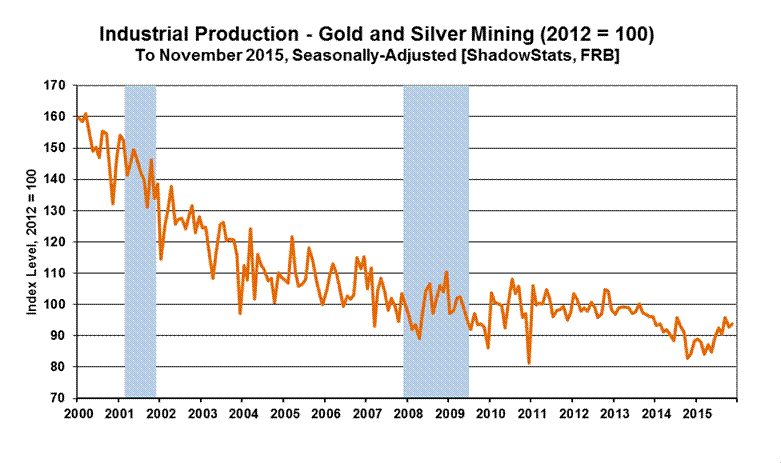
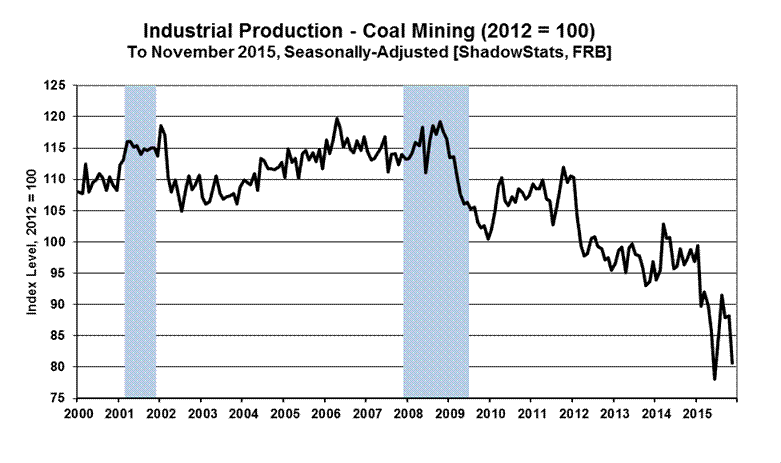
Graph 18 reflects continuing monthly gains in gold and silver production, irrespective of the recent pummeling given the prices of precious metals by market interventions likely orchestrated by flailing central banks, while Graph 19 shows a headline drop in volatile month-to-month coal production.
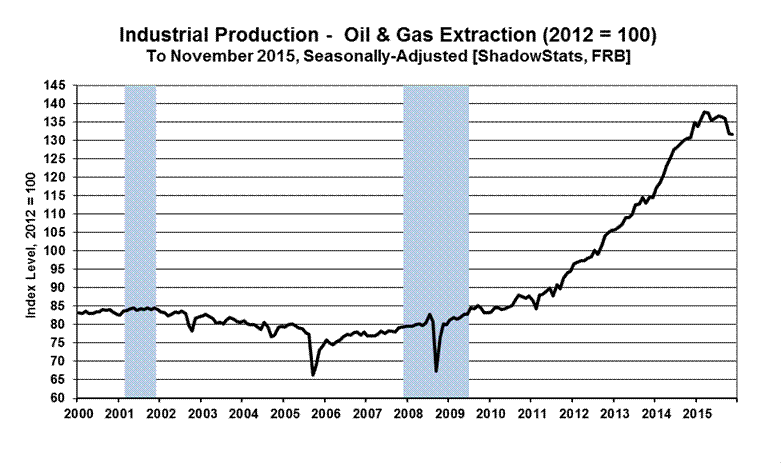
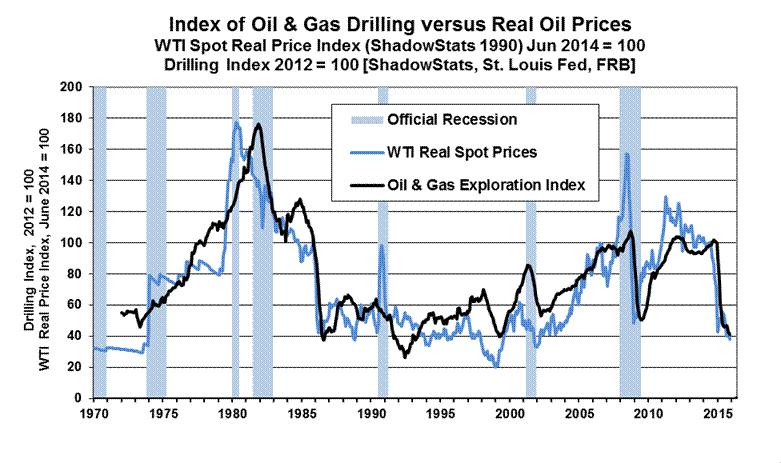
With continued weakness in oil prices, oil and gas extraction is holding near, but increasingly off its all-time high, as seen in Graph 20, with exploration, oil and gas drilling (Graph 21) dropping sharply, again. The recent collapse in drilling largely is an artefact of a massive U.S. dollar rally and oil-price plunge—beginning in July 2014—those appeared, at least initially, to be U.S.-orchestrated covert actions designed to stress Russia, financially, in response the circumstance in Ukraine. Shown in Graph 21 with some lag following the sharp movements in oil prices, oil and gas exploration tends to move in tandem. The oil price index used is for the West Texas Intermediate (WTI) monthly average spot price, deflated using the ShadowStats Alternate CPI measure (based on 1990 methodologies).
Graph 18: Mining – Gold and Silver Mining (Since 2000)
Graph 19: Mining - Coal Mining (Since 2000)
Graph 20: Mining – U.S. Oil & Gas Extraction (Since 2000)
Graph 21: Mining – U.S. Drilling for Oil & Gas (Since 2000)

As the dollar strengthens, dollar-denominated oil prices weaken, and vice versa. At such time as the U.S. dollar declines meaningfully—ShadowStats is looking for a massive sell-off in the dollar in the year ahead (see today’s Gold Graphs section in the Hyperinflation Outlook)—oil prices will rally anew, along with surging gold and silver prices).
Graph 22: Mining – U.S. Drilling for Oil & Gas versus Real Oil Prices (WTI ShadowStats 1990 Base)
RESIDENTIAL INVESTMENT (November 2015)
Amidst Volatile Monthly Reporting and an Unfolding Quarterly Contraction, Housing Starts Continued a Smoothed Pattern of Stagnation. Headline November housing starts took a jump to the upside after taking a monthly hit in October. Nonetheless, with two of three months in place for fourth-quarter 2015 activity, a fourth-quarter 2015 contraction versus third-quarter activity appears likely. Unlike the industrial production series, though, the unfolding quarterly contraction is not a virtual certainty.
Monthly growth of 5.6% in December 2015, versus today’s initial reporting level of November 2015 housing starts activity would be enough to turn fourth-quarter 2015 activity to the plus-side. While such headline growth is well within the regular scope of the series, such activity does not commonly follow heavily-overstated activity in the prior month, which would be the circumstance for December headline growth versus today’s inflated, headline November detail.
Quarterly Growth Held Flat in the Third-Quarter and Still Prospectively Negative for the Fourth-Quarter. In terms of annualized quarterly change, the aggregate housing-starts count fell at an annualized-quarterly pace of 26.2% (-26.2%) in first-quarter 2015, rose at an annualized 96.3% pace in second-quarter 2015, and rose at a revised 0.2% [previously down by 1.6% (-1.6%), initially up by 2.0%] annualized third-quarter pace. Based on October and November 2015 reporting, fourth-quarter 2015 starts are on track for an annualized contraction of 13.4% (-13.4%). That had been an annualized contraction of 28.6% (-28.6%), based just on initial October reporting in this highly volatile series.
Smoothed Numbers. A general pattern of low-level stagnation continued, with its up-trending pattern faltering again with the most-recent headline detail. This is viewed best in terms of the longer-range historical graph of aggregate activity (Graph 24) at the end of this section, and particularly in the context of the headline activity, smoothed by a six-month moving average, as shown in Graph 6 in the Opening Comments section. While a minor upside trend in the broad pattern of stagnation in the aggregate series may be stalling, total November housing-starts activity remained well below any recovery level, down from its pre-recession high by 48% (-48%).
Separately, the dominant, single-unit housing starts component of the series (Graphs 7 and 8 in the Opening Comments) remained down by 58% (-58%) from its January 2006 pre-recession peak.
Reflected in the smoothed graphs in the Opening Comments, the aggregate housing-starts series ticked minimally higher in November, reflecting mild fluctuations in both the six-month smoothed single-unit (Graph 6) and multiple-unit starts (Graph 8) categories, where monthly activity rose for the month in both series.
Over time, the bulk of the extreme, reporting instability and the minimal uptrend in the aggregate series has been due largely to particularly-volatile reporting in the multiple-unit housing-starts category (apartments, etc.). Recent activity in multiple-unit starts had recovered to above pre-recession levels, again, in the context of extreme month-to-month volatility. Even so, the recent impact of that recovery may be fading, and otherwise it largely has been lost in the detail of total housing starts.
Consumer Liquidity Problems Continue to Impair Housing Activity. On a per-structure basis, housing starts volume, again, is dominated by the single-unit housing starts category, which has remained broadly stagnant on a smoothed basis, at a low level of activity since hitting bottom in early-2009. The private housing sector never recovered from the business collapse of 2006 into 2009.
The primary, underlying difficulty for the housing market remains intense, structural-liquidity constraints on the consumer. That circumstance, during the last eight-plus years of economic collapse and stagnation, has continued to prevent a normal recovery in broad U.S. business activity, as updated and discussed more fully in Commentary No. 772.
Without real (inflation-adjusted) growth in household income and without the ability or willingness to take on meaningful new debt, the consumer simply has not had the wherewithal to fuel sustainable economic growth. There remains no chance of a near-term, sustainable turnaround in the housing market, without a fundamental upturn in consumer and banking-liquidity conditions. That has not happened and does not appear to be in the offing.
November 2015 Housing-Starts, Headline Reporting. Headline November 2015 Housing Starts bounced higher for the month, but not by enough for unfolding fourth-quarter activity to gain on the prior quarter. In the context of minimal upside revisions to September and October reporting, the Census Bureau reported today, December 16th, a statistically-significant, seasonally-adjusted, headline monthly gain of 10.5% +/- 10.1% (all confidence intervals are expressed at the 95% level) in November 2015 housing starts. Such followed a revised decline of 12.0% (-12.0%) [previously down by 11.0% (-11.0%)] in October, and a revised monthly gain of 8.2% [previously up by 6.7%, initially up by 6.5%] in September. Net of prior-period revisions, November 2015 housing starts rose by 10.7% for the month, instead of the headline gain of 10.5%. The level-of- activity detail is plotted in Graphs 3 to 6 of the Opening Comments, and in Graphs 23 to 24 at the end of this section.
Year-to-year change in the seasonally-adjusted, aggregate November 2015 housing-starts measure was a statistically-significant gain of 16.5% +/- 12.3%, versus a revised annual contraction of 1.6% (-1.6%) [previously down by 1.8% (-1.8%)] in October 2015, and a revised annual gain of 17.6% [previously up by 16.1%, initially up by 17.5%] in September 2015.
The November 2015 monthly gain of 10.5% in total housing starts reflected a headline monthly gain of 7.6% in the “one unit” category, and an increase of 18.1% in the “five units or more” category. Only the aggregate headline gain was statistically-significant.
By-Unit Category (See Graphs in the Opening Comments). Where the irregular housing starts series can show varying patterns, that partially is due to a reporting mix of residential construction products, with the largest physical-count category of one-unit structure housing starts—generally for individual consumption, resulting in new home sales—versus multi-unit structure starts that generally reflect the building of rental and apartment units.
Housing starts for single-unit structures in November 2015 gained month-to-month by a statistically-insignificant 7.6% +/- 11.2%, following a revised monthly decline of 3.6% (-3.6%) [previously down by 2.4% (-2.4%)] in October, and a revised monthly gain of 1.0% [previously up by 0.8%, initially up by 0.3%] in September. Single-unit starts for November 2015 showed a statistically-significant year-to-year annual gain of 14.6% +/- 13.1%, versus a revised 1.3% gain [previously up by 2.4%] in October 2015, and a revised annual gain of 12.1% [initially up by 12.0%] in September 2015 (see Graphs 3, 4, 7 and 8 in the Opening Comments).
Housing starts for apartment buildings (generally 5-units-or-more) in November 2015 rose month-to-month by a statistically-insignificant 18.1% +/- 30.7%, versus a revised monthly decline in October of 25.9% (-25.9%) [previously down by 25.5% (-25.5%)], and a revised monthly gain of 21.0% [previously up by 16.8%, initially up by 17.6%] in September. The statistically-insignificant November 2015 year-to-year gain of 21.3% +/- 31.6%, followed a revised annual decline of 5.6% (-5.6%) [previously down by 8.4% (-8.4%)] in October 2015, and revised 28.9% annual gain [previously up by 24.4%, initially up by 26.6%] in September 2015.
Expanding the multi-unit housing starts category to include 2-to-4-units plus 5-units-or-more usually reflects the bulk of rental- and apartment-unit activity. The Census Bureau does not publish estimates of the 2-to-4-units category, due to statistical significance problems (a general issue for the aggregate series). Nonetheless, the total multi-unit category can be calculated by subtracting the single-unit category from the total category (see Graphs 3, 4, 9 and 10 in the Opening Comments).
Accordingly, the statistically-significant November 2015 monthly gain of 10.5% in aggregate starts was composed of statistically-insignificant gains of 7.6% in one-unit structures and 16.4% in the multiple-unit structures categories (2-units-or-more, including the 5-units-or-more category). Again, these series all are graphed in the Opening Comments section.
Housing Starts Graphs. Headline reporting of housing starts activity is expressed by the Census Bureau as an annualized monthly pace of starts, which was 1,173,000 in November 2015, versus a revised 1,062,000 (previously 1,060,000) in October 2015. The scaling detail in the aggregate Graphs 23 and 24 at the end of this section reflects those annualized numbers.
Nonetheless, given the nonsensical monthly volatility in reporting and the exaggerated effect of annualizing the monthly numbers in this unstable series, the magnitude of monthly activity and the changes in same, more realistically are reflected at the non-annualized monthly rate. Consider that the headline 236,000 month-to-month gain in the annualized April 2015 housing starts was larger than any actual total (non-annualized) level of monthly starts ever, for a single month. That is since related starts detail first was published after World War II.
Accordingly, the monthly rate of 97,750 units in November 2015, instead of the annualized 1,173,000-headline number, is used in the scaling of Graphs 3 to 10 in the Opening Comments. With the use of either scale of units, though, appearances of the graphs and the relative monthly, quarterly and annual percentage changes are otherwise identical, as can be seen in a comparison of Graph 23 versus Graph 5 in the Opening Comments.
The record monthly low level of activity seen for the present aggregate series was in April 2009, where the annualized monthly pace of housing starts then was down 79% (-79%) from the January 2006 pre-recession peak. Against the downside-spiked low in April 2009, the November 2015 headline number was up by 145%, but it still was down by 48% (-48%) from the January 2006 pre-recession high. Shown in the historical perspective of the post-World War II era, current aggregate-starts activity is in up-trending stagnation at low levels that otherwise have been at or near the historical troughs of recession activity of the last 70 years, as seen in accompanying Graph 24.
Graph 23: Housing Starts (Annualized Monthly Rate of Activity), 2000 to Date
Graph 24: Housing Starts (Annualized Monthly Rate of Activity), 1946 to Date
__________
WEEK AHEAD
Economic Reporting Generally Should Trend Much Weaker than Expected; Inflation Will Rise Anew, Along with a Renewed Rebound in Oil Prices. Still in a fluctuating, general trend to the downside, amidst mixed reporting in headline data, market expectations for business activity nonetheless can gyrate some with the latest economic hype in the popular media. That general effect holds the consensus outlook still at overly-optimistic levels, with current expectations exceeding any potential, underlying economic reality. Where the net trend continues towards weakening expectations, movement towards recession recognition remains at something of an accelerating pace.
Headline reporting of the regular monthly economic numbers increasingly should continue to turn lower in the weeks and months ahead, along with likely downside revisions and otherwise much weaker-than-expected reporting for at least the next several quarters of GDP (and GDI and GNP) into 2016. That includes next week’s December 22nd second revision to third-quarter 2015 GDP, and intensifying early signals of a headline contraction in fourth-quarter 2015 GDP, due for release on January 29, 2016.
CPI-U consumer inflation—intermittently driven lower this year by collapsing prices for gasoline and other oil-price related commodities—likely has seen its near-term, year-to-year low. Annual CPI-U turned minimally positive in June 2015, for the first time in six months, notched somewhat higher in July and August, with a minimal fallback in September, tied to renewed weakness in gasoline prices. Gasoline prices bottomed out, again, with a combination of relatively stable gasoline prices and related, positive seasonal adjustments helping to boost headline October 2015 CPI-U annual inflation to 0.2%. Despite some further negative gasoline-price impact on headline monthly November CPI-U inflation, year-to-year inflation jumped to 0.5%, its highest level since December 2014.
Significant inflation pressures should mount anew, at such time as oil prices rebound meaningfully. Again, that process eventually should accelerate, along with a pending sharp downturn in the exchange-rate value of the U.S. dollar. Those areas, the general economic outlook and longer range reporting trends were reviewed broadly, recently, in No. 742 Special Commentary: A World Increasingly Out of Balance, and No. 692 Special Commentary: 2015 - A World Out of Balance and in the Hyperinflation Outlook Summary of Commentary No. 768.
Note on Reporting-Quality Issues and Systemic-Reporting Biases. Significant reporting-quality problems remain with most major economic series. Beyond the pre-announced gimmicked changes to reporting methodologies of the last several decades, which have tended to understate actual inflation and to overstate actual economic activity, ongoing headline reporting issues are tied largely to systemic distortions of monthly seasonal adjustments. Data instabilities—induced partially by the still-evolving economic turmoil of the last eight-to-ten years—have been without precedent in the post-World War II era of modern-economic reporting. The severity and ongoing nature of the downturn provide particularly unstable headline economic results, when concurrent seasonal adjustments are used (as with retail sales, durable goods orders, employment and unemployment data, discussed and explored in the labor-numbers related Commentary No. 695).
Combined with recent allegations of Census Bureau falsification of data in its monthly Current Population Survey (the source for the Bureau of Labor Statistics’ Household Survey), these issues have thrown into question the statistical-significance of the headline month-to-month reporting for many popular economic series (see Commentary No. 669).
The BLS also has suspended reporting of key earnings data from the period of economic collapse, due to reporting errors. More will follow there, along with the indicated downside benchmark revisions to 2015 payroll employment on February 5, 2016.
PENDING RELEASES:
Gross Domestic Product (GDP)—Third-Quarter 2015, Third Estimate, Second Revision. The Bureau of Economic Analysis (BEA) will publish its third estimate of third-quarter 2015 Gross Domestic Product (GDP) on Tuesday, December 22nd. Such will be the final revision to headline third-quarter GDP activity until the benchmark revision in July 2016, and the consensus outlook appears to be on the downside for the revision. Initially reported at 1.49%, it revised to 2.08% in the first revision. The third estimate likely will fall back to the growth range of the first estimate, if not below, as discussed in the Opening Comments.
Existing- and New-Home Sales (November 2015). November 2015 Existing-Home Sales are due for release on Tuesday, December 22nd, from the National Association of Realtors (NAR), with the November 2015 New-Home sales report due from the Census Bureau on Wednesday, December 23rd. Existing- and New-Home Sales will be covered in Commentaries No. 775 and 776 of the respective release dates.
Discussed in today’s Housing Starts comments and detailed fully in Commentary No. 772, the primary issues constraining headline housing market activity remains intense, structural-liquidity constraints on the consumer. That circumstance, during the last eight-plus years of economic collapse and stagnation, has continued to prevent a normal recovery in broad U.S. business activity. There remains no chance of a near-term, sustainable turnaround in the housing market, until there has been a fundamental upturn in consumer and banking-liquidity conditions. Accordingly, prospects remain bleak for a sustainable increase in home-sales activity.
With longer-term, up-trending stagnation in headline Existing-Home Sales, further downside catch-up in month-to-month activity remains a fair possibility for November 2015 reporting. Smoothed for extreme and nonsensical monthly gyrations, a continuing pattern of stagnation or downturn in New-Home Sales also is likely. Its pattern of stagnation turned from up-trending to down-trending in September. Monthly changes in activity here rarely are statistically-significant, amidst otherwise unstable headline monthly reporting and revisions.
Again, reflecting deteriorating consumer issues, both New- and Existing-Home Sales increasingly should continue to see downside volatility in related headline reporting.
New Orders for Durable Goods (November 2015). The Census Bureau will report November 2015 New Orders for Durable Goods on Wednesday, December 23rd. Net of irregular activity in commercial aircraft orders, aggregate orders likely continued a pattern of down-trending stagnation.
Net of commercial aircraft orders, real durable goods orders contracted quarterly in fourth-quarter 2014 and first-quarter 2015, but were to the upside in reporting for second- and third-quarter 2015, despite an intensifying plunge in year-to-year activity. Increasingly-negative annual growth in real orders, ex-commercial aircraft were seen in October and similar patterns remain likely for the November 2015 detail, with indications of annual and quarterly contractions in fourth-quarter 2015 remaining likely.
Commercial aircraft orders are booked for the long-term—years in advance—so they have only limited impact on near-term production. Further, by their nature, these types of orders do not lend themselves to seasonal adjustment. As a result, the durable goods measure that best serves as a leading indicator to broad production—a near-term leading indicator of economic activity and GDP—is the activity in new orders, ex-commercial aircraft.
__________