No. 288: Healthcare, GDP, Durables, Home Sales
JOHN WILLIAMS’ SHADOW GOVERNMENT STATISTICS
COMMENTARY NUMBER 288
Healthcare, GDP, Durables, Home Sales
March 26, 2010
__________
Government’s Healthcare Takeover
Will Depress Economy, Exacerbate Deficit and Inflation Woes
Downside Revisions Loom for 2009 GDP
Durable Goods Orders Gains Are Long-Term not Near-Term
Home Sales Heavily Influenced by Foreclosures
__________
PLEASE NOTE: The next regular Commentary is scheduled for Friday, April 2nd following release of the March employment and unemployment reporting.
– Best wishes to all, John Williams
Implications of a down U.S. economy in 2010 include a much worse-than-expected federal deficit, including a likely new round of federal bailouts of entities or institutions that otherwise could threaten systemic collapse (i.e., states and the banking system). Such means much heavier than expected borrowing by the U.S. Treasury and heightened risk of a massive sell-off in the U.S. dollar and related dollar denominated paper. As Treasury auctions begin to fail, the Fed remains the lender of last resort to the federal government, with heavy monetization of Treasury debt a likely result. Therein lie some of the near-term risks that could move the U.S. into the early phases of hyperinflation in the months ahead. (See the Hyperinflation Special Report.)
The just-enacted, effective government takeover of the healthcare and health insurance industry will damage the economy, widen the federal deficit and likely contribute directly to consumer inflation. The full impact of the new legislation will become more obvious in the months ahead, but clearly higher costs to businesses, higher taxes or premiums for individuals and the building of a new massive government support structure for the healthcare industry will reduce disposable income for individuals and businesses, drawing available funds away from productive economic activity. U.S. companies increasingly will find government regulations impairing their global competitiveness, with the effect of driving more U.S. business activity offshore. The net effect will be seen in slowing broad U.S. economic activity and some spiking of prices for those entities able to recoup higher costs.
Government projections on deficit impact are loaded with happy assumptions, including positive economic growth. As the program reaches its full economic impact, it will have meaningful effect on widening both the cash- and GAAP-based deficits. I do not think anyone has enough information to work through hard numbers, but the direction of overall impact is set, and the economy should be seeing added downside pressures as a result by year-end 2010. This issue will be explored more deeply in the near future.{{end}
GDP-Related Definitions. For purposes of clarity and the use of simplified language in the following text, here are definitions of key terms used related to GDP reporting:
"Gross Domestic Product (GDP)" is the headline number and the most widely followed broad measure of U.S. economic activity. It is published quarterly by the Bureau of Economic Analysis (BEA), with two successive monthly revisions and with an annual revision the following July.
"Gross Domestic Income (GDI)" is the theoretical equivalent to the GDP, but it is not followed by the popular press. Where GDP reflects the consumption side of the economy and GDI reflects the offsetting income side. When the series estimates do not equal each other, which almost always is the case, the difference is added to or subtracted from the GDI as a "statistical discrepancy." Although the BEA touts the GDP as the more accurate measure, the GDI is relatively free of the monthly political targeting the GDP goes through.
"Gross National Product (GNP)" is the broadest measure of the U.S. economy published by the BEA. Once the headline number, now it rarely is followed by the popular media. GDP is the GNP net of trade in factor income (interest and dividend payments). GNP growth usually is weaker than GDP growth for net-debtor nations. Games played with money flows between the United States and the rest of the world tend to mute that impact on the reporting of U.S. GDP growth.
"Real" means growth has been adjusted for inflation.
"Nominal" means growth or level has not been adjusted for inflation. This is the way a business normally records revenues or an individual views day-to-day income and expenses.
" GDP Implicit Price Deflator (IPD)" is the inflation measure used to convert GDP data from nominal to real. The adjusted numbers are based on "Chained 2005 Dollars," at present, where the 2005 is the base year for inflation, and "chained" refers to the methodology which gimmicks the reported numbers so much that the total of the deflated GDP sub-series misses the total of the deflated total GDP series by nearly $40 billion in "residual" as of second-quarter 2010.
"Quarterly growth," unless otherwise stated, is in terms of seasonally-adjusted, annualized quarter-to-quarter growth, i.e., the growth rate of one quarter over the prior quarter, raised to the fourth power, a compounded annual rate of growth. While some might annualize a quarterly growth rate by multiplying it by four, the BEA uses the compounding method, raising the quarterly growth rate to the fourth power. So a one percent quarterly growth rate annualizes to 1.01 x 1.01 x 1.01 x 1.01 = 1.0406 or 4.1%, instead of 4 x 1% = 4%.
"Annual growth" refers to the year-to-year change of the referenced period versus the same period the year before.
So, the first-estimate of fourth-quarter GDI was published this morning (March 26th). The interesting number, though was a downward revision last month to the already reported third-quarter GDI (third-quarter GDP revisions were cut off two months prior). The third-quarter GDI was revised from a real, annualized quarterly growth rate of 2.2% to a contraction of 0.4%. The economic "recovery" touted for the third-quarter GDP disappeared, as measured by the GDI. Where the GDI had been reasonably consistent with the 2.2% growth previously reported for the GDP, a downward revision to the third-quarter GDP number is a fair bet, come the July 2010 annual GDP revisions. The just-reported 6.2% annualized GDI fourth-quarter growth is likely to revise lower in the months ahead (monthly fourth-quarter GDP revisions now are cut off), as better-quality information becomes available.
GDP. The BEA’s "third" estimate (second revision) of fourth-quarter 2009 Gross Domestic Product (GDP) showed an annualized real growth rate of 5.55% (versus a first revision of 5.93% and an initial estimate of 5.73%) +/- 3% (95% confidence interval). Such followed a 2.24% gain reported for third-quarter GDP. The year-to-year change in real fourth-quarter GDP revised to a gain of 0.06% (previously up by 0.15% and initially up by 0.10%), following a 2.64% contraction in the third-quarter.
The second revision to fourth-quarter 2009 GDP was little more than statistical noise, with relatively stronger nonfarm inventories accounting for 3.79 percentage points, or 68.3% of the revised 5.55% annualized quarterly growth (previously inventories accounted for 4.09 percentage points, or 69.0%, of the 5.93% annualized growth rate reported for fourth-quarter GDP). Before differences are exaggerated by the quarterly growth being raised to the fourth power, the quarter-to-quarter growth rate revised from 1.45% to 1.36% (both rates round to 1.4%). As discussed in earlier writings, without demand to support production (see durable goods orders), inventories eventually would be wound down, sapping growth from future GDP reporting.
The downside revision was reflected partially in an upside revision to GDP inflation (the implicit price deflator). The annualized fourth-quarter GDP deflator revised to 0.50% from 0.36%, following an initial estimate of 0.60%. Seasonally-adjusted CPI-U data show annualized CPI inflation in the fourth-quarter at 2.62%. The annualized third-quarter GDP implicit price deflator was 0.35%, while the annualized third-quarter CPI revised was 3.69%. Generally, the weaker the inflation rate used in deflating the GDP, the stronger is the resulting "real" GDP growth. In the current instance, slightly higher inflation was reflected in slightly lower real growth.
The small overall quarterly revision had minimal impact on the annual GDP numbers. For 2009, real GDP fell by a revised 2.44% (previously 2.42%, initially 2.43%), following a 0.44% gain 2008. The 2009 real decline remained the deepest since the war-end production shutdown in 1946, which showed a 10.94% annual contraction. In nominal terms — the way companies usually track their sales and people count their income — 2009’s revised 1.28% (previously and initially 1.27%) annual decline was the worst since a 6.31% decline in 1938, during the second dip of the Great Depression. Nominal GDP rose by 2.58% for the year in 2008.
The SGS Alternate-GDP estimate for fourth-quarter 2009 remains an annual contraction of 4.6% versus the official estimate of a 0.1% gain, less-negative than the annual 5.7% (2.2% official) estimated contraction in the third-quarter. While annualized real quarterly growth is not formally estimated on an alternative basis, a flat quarter-to-quarter circumstance, plus or minus, likely would have been realistic, reflecting the bottom-bouncing at low levels of activity seen for much of the last year in key underlying economic series. Given the fourth-quarter inventory problems discussed earlier, renewed quarter-to-quarter contraction in the GDP as of first-quarter 2010 remains a good bet against overly optimistic consensus expectations of near-average positive growth.
GNP. The initial estimate of annualized real quarterly growth in Gross National Product (GNP) for fourth-quarter 2009 was 5.05%, up from 3.03% in the third-quarter. Year-to-year, fourth-quarter 2009 GNP was up by 0.42% versus a 2.87% annual contraction in the third quarter. For the full year 2009, GNP fell by 2.67% in 2009 versus a 0.60% gain in 2008 (GDP fell 2.44% in 2009 versus a gain of 0.44% in 2008).
GDI. The initial estimate of annualized real quarterly growth in Gross Domestic Income (GDI) for the fourth-quarter 2009 was 6.17% (3.48% net of revisions). As discussed in the opening comments of this section, third-quarter GDI growth was revised to a 0.37% contraction from 2.22% positive growth. Year-to-year, fourth-quarter 2009 GDI was still in negative territory, down by 0.61% versus a revised 3.92% (previously 3.30%) annual contraction in the third quarter. For the full year 2009, GDI fell by 3.19% in 2009 versus a 0.37% decline in 2008 (GDP fell 2.44% in 2009 versus a gain of 0.44% in 2008).
The widely followed nondefense capital goods orders rose by 5.2% for the month, following a revised 4.4% gain (previously a 4.7%) gain in January. Year-to-year orders were up by 25.1% in February, following a revised 15.4% (previously a 17.7%) annual gain in January.
All of the gain in total new orders for both February and January was due to increased aircraft sales, which usually are erratic and get stretched out in years, in terms of delivery. Orders rose in the nondefense aircraft sector on a monthly basis by 32.7% and 134.9%, respectively, in February and January. In contrast, the auto industry — so heavily relied on as a base for the economic "recovery" — suffered declining monthly sales of 1.9% and 2.3% respectively in February and January. Automobile orders are more immediate in terms of economic impact.
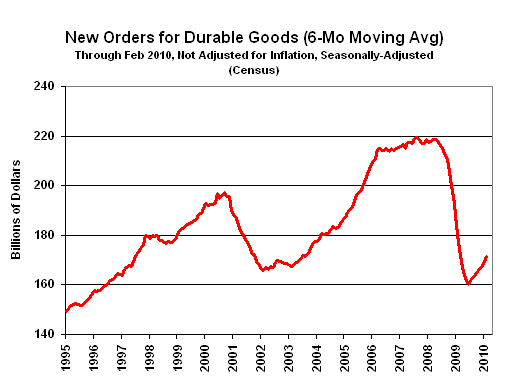
Allowing for the recent strength in the heavily volatile, long-term aircraft orders, the general pattern of the broad series — before adjustment for inflation — remains one of bottom-bouncing. Against an average monthly level of $166.5 billion since last December, the February 2010 level of $178.1 billion remained within the realm of normal month-to-month volatility and ongoing bottom-bouncing, again, if considered in the context of the long-term aircraft sales. Nonetheless, as a longer-term positive (measured in years), the aircraft orders have pushed the six-month moving average higher, though it still is below the level of February 2009.
As discussed in recent writings, both new home sales (Census Bureau) and existing home sales (National Association of Realtors — NAR) have been seriously distorted, both in terms of unit sales and price levels, by the extreme nature of the current economic depression in housing. One area of distortion has been the impact of foreclosure activity of a magnitude never before seen in the history of these series. The NAR is publishing monthly estimates of foreclosures as a portion of existing home sales reporting. Census acknowledges that a portion of new home sales is from foreclosure activity but offers no estimates.
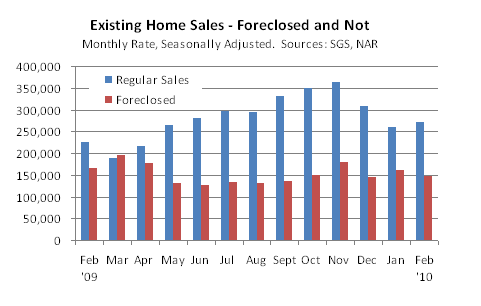
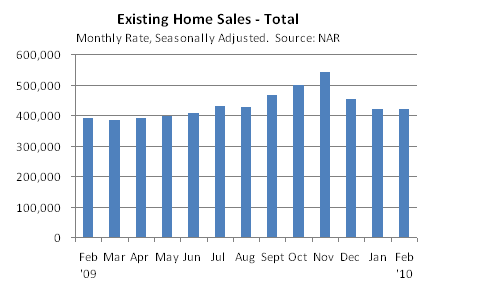
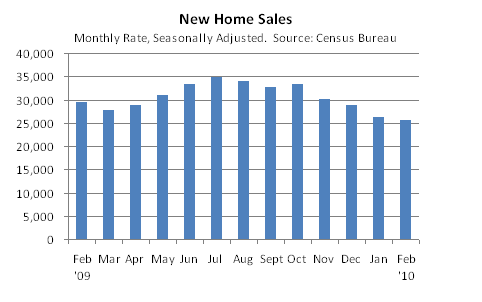
The following graphs reflect different measures of home sales activity for the last year. The numbers, through February 2010, reflect the seasonally-adjusted level of monthly sales, rather than the annual rate usually published. I view as nonsensical publishing annual rates on highly volatile numbers that usually show monthly changes that are not statistically meaningful.
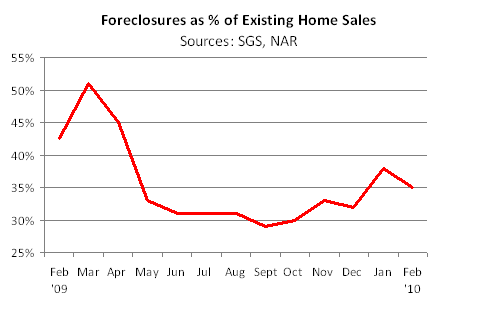
The first graph shows the portion of existing home sales estimated by the NAR to have been distressed (basically in some form of foreclosure activity). The February 2009 number was estimated at between 40% and 50%, the March 2009 number was estimated at slightly over half, but all the later estimates were given as specific percentages. The recent uptrend in the percent of sales in foreclosure is not a happy sign, although part of the increase could be due to a seasonality in foreclosures that varies from the seasonally weaker sales at this time of year, depending on how the seasonal adjustments are worked through.
The second graph shows the level of regular existing home sales versus the foreclosure numbers. The trend of a relatively softening level of regular sales versus firm foreclosures again is not a particularly happy picture.
Home sales activity rose to a near-term peak as the November 2009 expiration of the first-time home buyer tax credit neared. Given the way then series are defined, new some sales are recorded earlier in the sales cycle (contract) than the existing home sales (closing), so the peak seen in existing home sales would tend to lag that of new home sales, as seen the last two graphs.
Both graphs show a slowing trend in sales, with new home sales just hitting an historic low. This is not a pattern consistent with expanding economic activity. Against the average annual sales peaks seen in 2005, February 2010 existing home sales were down by 29.1%, new home sales were down by 76.0%
Employment and Unemployment (March 2010). Estimates of March payrolls and unemployment are due for release on Friday, April 2nd. Key to the reporting — irrespective of any market hype to the contrary — will be how the data look net of the temporary and intermittent hiring of workers for the 2010 census. Most of the jobs will be part-time, and whatever hiring takes places in the next several months — hundreds of thousands — will be lost completely in the period immediately following. Net of the short-term census impact, the employment and unemployment picture should deteriorate.
Briefing.com shows consensus expectations for a March payroll gain of 200,000, with the unemployment rate holding at 9.7%. The bulk of the March payroll is pick-up is expected to be from census hiring. In February, initial reporting had monthly payrolls shrinking by 36,000, down by 51,000 net of early census hiring. Where some of those retained for the census already likely will have other part-time employment, the impact in terms of reducing or depressing the headline unemployment rate would be proportionately less than that suggested by the increase reported in payrolls.
Economic activity remains weak and is in the process of entering a phase of intensified contraction, as discussed in recent writings. Accordingly, contrary to expectations, I would expect a monthly decline in March payrolls and an increase in the unemployment rate net of census effects. The actual level of census hiring should be large and will increase in the next couple of months.
__________