Benchmark Revision to Nonfarm Payrolls & Great Depression Indicators
Section Four
(View all Sections of this Issue)
Reporting/Market Focus
January 2009 Benchmark Revision to Nonfarm Payrolls
Great Depression Indicators (1930s)
This Reporting/Market Focus is split into two sections. The first shows some detail of the annual benchmark revision to nonfarm payrolls. The second relates to the Great Depression, a popular topic in the current economic debate. Several measures of the downturn are plotted, so as to help establish a little bit of perspective on that troubled time.
Payroll Benchmark:
Historically Weaker Economic Activity
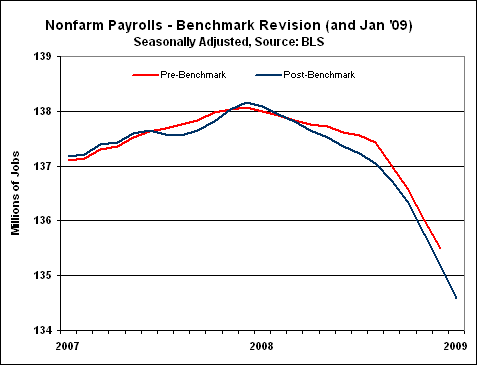
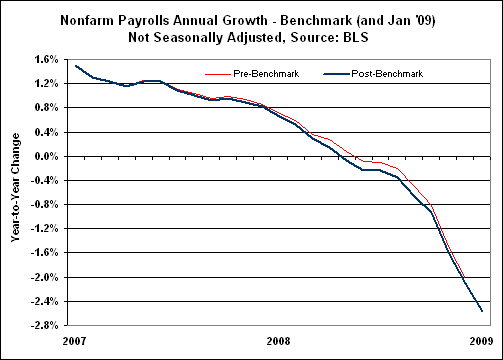
With the release of January payroll report, the Bureau of Labor Statistics (BLS) publishes its annual benchmark revision, where payroll employment estimates are compared with state employment tax filings as of the prior March (in the current instance, March 2008).
In general, the benchmark revision was worse than had been advertised, with unadjusted payrolls for the benchmark month of March 2008 being revised lower by 89,000, instead of the initial estimate of a 21,000 downward adjustment.
As noted in the Flash Update of February 6th, on a seasonally-adjusted basis, the benchmarking translated into a downward adjustment in payroll levels in excess of 200,000 for each month from May 2008 on. The effect was to suggest weaker growth patterns in place before the 2008 election. The annualized quarter-to-quarter contraction in seasonally-adjusted payrolls deepened to 1.3% in the second quarter of 2008, versus the earlier estimate of 0.6%; the annualized quarter-to-quarter contraction deepened to 1.5% in the third quarter, versus the earlier estimate of 1.1%; but the annualized quarter-to-quarter contraction narrowed to 3.6% in the fourth quarter, versus the earlier estimate of 3.7%.
The graphs on the following page plot the old and revised series (including January 2009) for payroll levels (seasonally adjusted) as well as for annual change (not seasonally adjusted). In both instances the current economic downturn now stands a little deeper than it had in previous reporting.
Great Depression:
Money Supply and Consumer Prices Rebounded
Following Abandonment of Domestic Gold Standard
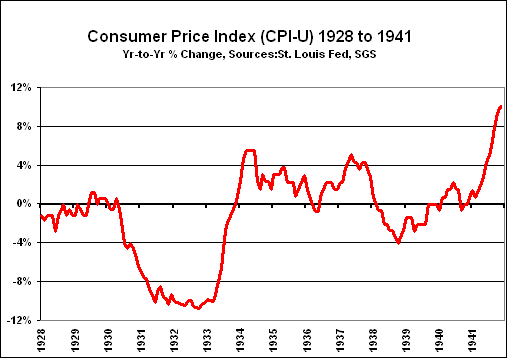
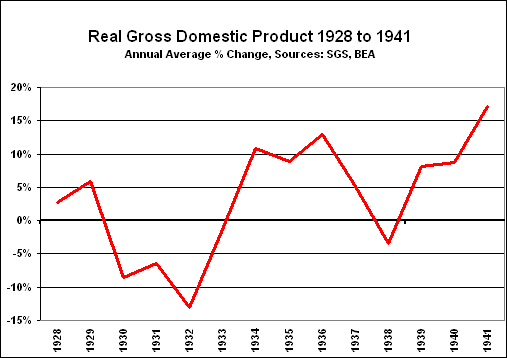
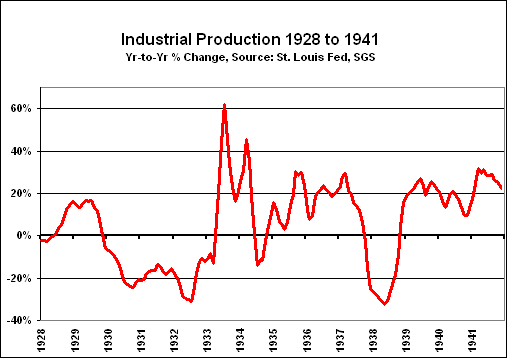
The following four graphs show activity surrounding the Great Depression, as it related to broad money growth, consumer inflation, GDP and industrial production. The money supply estimates are from Milton Friedman and Anna Jacobson Schwartz’s "A Monetary History of the United States, 1867-1960." The measure there is as broad as it existed, and it eventually ties into early estimates of M2 and M3, where M3, in more recent years, was generally the broadest money supply measure followed until its abandonment by the Fed in March 2006 (see the SGS Money Supply Special Report of August 8, 2008).
The following background is as published in the Reporting/Market Focus of SGS Newsletter No. 47, where various U.S. economic contractions were detailed by sitting the President at the time of onset:
Hoover; Timing/Duration: Aug 1929 to Mar 1933, 43 months; Peak-to-Trough Contraction: 33%; Nature: Structural/Liquidity. Background: The Great Depression. Collapse of debt excesses from 1920s and liquidity crisis, extreme income variance, overbuilding, stock crash, banking collapse, industrial restructuring as long-term aftershock of Panama Canal construction and World War I end, permanent job losses.
F Roosevelt-I; Timing/Duration: May 1937 to Jun 1938, 13 months; Peak-to-Trough Contraction: 18%; Nature: Structural. Background: Second-dip of Great Depression.
As shown in the GDP and industrial production graphs, the Great Depression was a double-dip downturn, encompassing the more severe 1929 to 1933 contraction and the 1937 to 1938 downturn. It was the war in Europe and surging defense orders from Britain that eventually ended the depression.
Of particular interest in the current monetary debate is what happened with the money supply. As the banks collapsed into 1933 and deposits were lost, the money supply collapsed along with sharp deflation in consumer prices. It was the fear of a similar banking collapse and loss of deposits (despite limited deposit insurance) that Mr. Bernanke was trying to avoid as the current crisis broke. The depository end of the current system appears to be stable, at the moment.
One reason Roosevelt abandoned the gold standard in 1933 was that it imposed discipline on the money supply. Once gold was abandoned, the government moved to the "debt standard" and spent a great deal of money; the money supply expanded and consumer prices rose anew.

End of Section Four
(View all Sections of this Issue)