Wednesday, May 2nd, 2012
The following analysis sets out inconsistencies in the payroll employment data as published by the Bureau of Labor Statistics (BLS), versus the actual data as adjusted and recalculated each month by the BLS using its “concurrent” seasonal-adjustment process. With this product, we make available the SGS calculations of the actual data produced internally by the BLS, using the published BLS data methodologies and programs.
These numbers are provided in a format whereby data users may explore them not only at the aggregate nonfarm payroll level, but also at numerous industry levels.
No attempt is made here to address any issues in terms of possible seasonal-factor distortions, sampling problems or bias-factor and birth-death modeling issues. The data here, again, are unpublished BLS calculations, not an SGS-Alternate Payroll Employment Measure.
- Unpublished Seasonally Adjusted Time Series for the Payroll Survey. The headline number is published by the BLS, but the public cannot see how seasonally adjusted jobs have been moved between past months. Why is this important and how do we obtain the real picture?
- Trend Extrapolations Showing Seasonal Residuals Available. How a by-product of the seasonal adjustment process gives us insights into the next month’s Payroll Survey’s seasonal adjustments.
- Data Sample Available. We make available a current sample of data as an Excel workbook.

Figure 1
1. The Problem with the Published Payrolls Data
The Bureau of Labor Statistics (BLS) produces the much-watched Establishment Survey,1 popularly referred to as the “Payroll Survey.” Its headline, monthly change in total employment is much anticipated and analyzed by economists and investors.
Although the BLS also publishes revisions to the prior two months’ numbers, it is not widely understood that the concurrent seasonal adjustment (SA) process used each month revises every past month.2
As we understand it, the BLS does not publish these revisions because of the effort and confusion involved in publishing a fully revised history each month.3 Prior to the introduction of the current methodology in 2003, only the prior two months were revised and published. Perhaps, the effort involved in re-working the established publication process was deemed not worthwhile when the new methodology was introduced.
The BLS also might argue that public should be concerned only by the trend of the most recent three months, and that the changes made to prior months are not significant.
But, there are reasons for wanting to see the real picture:
- The monthly change as recently as two months before the current release is incorrectly stated by the BLS. For example, for the March 2012 release, the published monthly change for January is the difference between the new January number and the old December number. What we really want is the difference between the new January and the new December numbers (283,000 versus the reported 275,000).
- Part of the current month’s headline number contains a re-adjustment to the seasonal factors. One would like to see how much of this may have been re-allocated from past, un-reported months. For example, a few months ago the published headline number may have benefitted from a certain seasonal adjustment. Some of the benefit now may have been revised away and now shows up in today’s headline number. Without knowing this the public has an incorrect picture of the true pattern of growth, free of any possible “double-counting” of seasonal effects.
- If data users want to use the BLS time-series in any statistical model, they need to have an internally consistent series showing the latest view of what the seasonally adjusted numbers were in the past, not a series which is the co-mingling of data from separate monthly revisions.
As an example, the chart below shows the published and actual SA monthly changes for the total private payroll numbers.

Figure 2
Dark red shows the unpublished picture, the light blue the numbers published by the BLS. These red, “Actual” numbers are the product of the BLS’s X-12-ARIMA seasonal adjustment model. They are produced each month by the BLS but not published. We reproduce them each month using the same software, input data and configuration files used by the BLS, with the differential plotted and discussed in the regular, monthly SGS Newsletter commentary on the Payroll Survey.
The actual numbers provide a self-consistent time-series. The number for, say, October 2011 was produced as a result of the same seasonal adjustment process that created the number for March 2012, and indeed all of the red monthly numbers. This process made use of all known data up to and including the March 2012 release, and was the process that produced that March headline number. All of the seasonality has been spread self-consistently throughout the year.
The blue numbers however are a combination of the SA processes made at different times in the past. For example, the published monthly change for November 2011 is derived from the job-levels for October and November 2011. But the values used for those two levels were those created by two different seasonal adjustment data sets, the former was part of a pre-benchmark process carried out using data up to and including October, while the November number was produced when the January 2012 release was produced. To some extent, apples are being compared with oranges.
One can see that there is a moving around of 20,000 job swings here and there, as the seasonal adjustment factors have changed. Compare the October through December numbers in Fig. 2 above – the seasonal adjustment process has changed its mind markedly about the distribution of seasonal effects - and, this is for the high-level aggregate total. At a specific industry level, those swings could be much more extreme.
2. Trend Extrapolations
A by-product of the X-12-ARIMA process is a trend “forecast” for each industry series. These give future seasonal factors, and estimates for future job levels based on the extrapolation of the fitted seasonally adjusted trend. These industry series can be aggregated to give “forecasts” for higher level sectors and totals.
It must be emphasized that these forecasts are purely statistical extrapolations of the existing, seasonally adjusted “trend” which has been fitted to the data. They cannot predict what underlying, non-trend changes may take place out in the real world. In effect they are saying that if the “trend” in each industry continues, this is what will be reported by the seasonal adjustment process next month.
These forecasts are useful, in that:
- They show the actual, calculated trend. This is not as simple as saying that next month will be the same as this month, or some simple average of past months.
- When an industry reports a number the next month that is markedly off-trend, data users can be alerted to the fact that something of significance may be happening in that industry.
- The X-12-ARIMA model cannot fully remove all seasonality. The forecast can alert users ahead of the next month’s report, as to what residual seasonal effects may contribute to the final headline number. These are artifacts of the whole process, not real, but are nevertheless part of the reported headline number and, as such, of interest in predicting what might be published.
A rather egregious example of this last point occurred prior to the December 2011 payroll report. Here is the picture as of the November 2011 release, having been run through our X-12-ARIMA process.

Figure 3
The trend extrapolation for total private sector jobs in December was a gain of 191,000 jobs. In drilling down to where this was coming from, the first stop was one sub-sector which stood out.

Figure 4
A rather large forecast jump in December employment!
On further examination, we saw that the X-12-ARIMA model was having a problem with an underlying component series, “Couriers and Messengers” (not charted separately here). This had highly seasonal spikes around December which were not being completely removed in the seasonal adjustment process. The forecast was telling us that the model was likely to add a very large number of jobs in December purely as part of the SA process, regardless of what the underlying, not-seasonally adjusted numbers might come in at.
When the BLS December numbers did come out, this indeed was what happened:

Figure 5
Fifty thousand jobs reported added to the sector in December after seasonal adjustment, with total private payroll growth coming very close to the trend estimate at a 212,000 gain.
This odd-looking gain was commented on at the time in the BLS release,4 but was not noted as a seasonal adjustment problem, and raised some eyebrows after the event.5 The modeling of this series has since been improved by an adjustment to the X-12-ARIMA parameters made by the BLS as part of the 2012 Benchmark revision, and this jump has now disappeared from the currently published series.
The modeling of this series has been improved, but there are still some residual seasonalities in the system, witness the current forecast for total Private payrolls shown here going out for the next three months:

Figure 6
If there were no residual effects, one would expect the next three months to be at the same level.
3. Data Samples
We have packaged up a sample data-set as an Excel Workbook with menus and charts for browsing the data.

The data-set covers:
- Data from the March 2012 BLS Payroll Survey (published April 6th.) (Please contact us to request next release data-set.)
- Our cacluations of the unpublished, BLS seasonally-adjusted data series
- Trend extrapolations
The sample data set contains:
- Data back to January 2010
- Next three months of trend extrapolations
- 131 industry and aggregate series
- 221kB Excel Workbook Download
(Windows Excel 2007/2010 - Sorry, not Mac Excel compatible, due to our use of ActiveX controls.)
A full data-set is available to SGS Newsletter subscribers. It contains:
- Data back to January 2006
- Next 12 months of trend extrapolations
- 201 industry and aggregate series (including some whose seasonally adjusted numbers are never published by the BLS)
- 620kB Excel Workbook Download

(Windows Excel 2007/2010 - Sorry, not Mac Excel compatible, due to our use of ActiveX controls.)
REFERENCES
1. Current Employment Statistics http://www.bls.gov/ces/cescope.htm
2. “Because CES revises only two months of estimates each month, the fourth month back from the current first preliminary estimate is adjusted using a different set of seasonal factors than the third month back. For example, with the release of October first preliminary data, factors are revised for September and August, but not July." Technical information: Revisions to CES data for late sample reports, annual benchmarking, and other factors http://www.bls.gov/ces/cesregrevtec.htm
3. "Revisions to data for previous months also may produce gains in accuracy, especially when the original data are themselves regularly revised on a monthly basis. Numerous revisions during the year, however, should be avoided, because they tend to confuse data users and substantially increase publication costs." Employment and Earnings, January 2004, Tiller, Richard B. and Evans, Thomas D., "Revision of Seasonally adjusted Labor Force Series in 2004," , Page 2. [Note: This quote is taken from a discussion of seasonal adjustment of the related Current Population Survey, but is equally applicable to the Payroll (Current Establishment) Survey.]
4. "Employment in transportation and warehousing rose sharply in December (+50,000). Almost all of the gain occurred in the couriers and messengers industry (+42,000); seasonal hiring was particularly strong in December." Bureau of Labor Statistics http://www.bls.gov/news.release/archives/empsit_01062012.htm
5. Free Exchange, The Economist. January 6, 2012 3rd Paragraph http://www.economist.com/blogs/freeexchange/2012/01/americas-economy
Thursday, December 23rd, 2010
COMMENTARY NUMBER 341
November Durable Goods Orders, Housing, GDP Revision
December 23, 2010
__________
Automobile Orders Sink for Fourth Month
Annualized GDP Growth at 2.6%, GDI Growth at 1.1%
Housing Crisis Appears to Be Intensifying
Year-to-Year Decline in Home Sales Is Meaningful
Even after Netting out Year-Ago Tax Credit Spikes
__________
PLEASE NOTE: The next regular Commentary is planned for Thursday, December29th, with an updated general overview on the economy, systemic stability and the financial markets in 2011.
– Merry Christmas! — John Williams and the ShadowStats.com staff.
Little Holiday Cheer in This Week’s Numbers. The average consumer remains liquidity-impaired, and that means there is no hope for any significant economic rebound in the months ahead. New orders for automobiles (in durable goods) have fallen for four straight months. Housing starts have begun to turn down anew, and home sales are showing meaningful annual declines, even with last year’s tax-credit-driven sales boosts backed out. The GDP should turn down again, shortly, as the double-dip recession takes clear hold. Payrolls and industrial production — allowing for revisions coming early in 2011 — appear already to have peaked or turned down anew as of the August to October 2010 period. Retail sales — also subject to significant revisions — should begin to show outright monthly declines, net of inflation, in the months ahead. This will be detailed in next week’s Commentary, which will address the outlook for 2011, a year that should be one of the most treacherous and unstable ever seen for the U.S. economy, systemic solvency and financial markets. The general outlook as discussed in Special Commentary No. 333, however, has not changed.
GDP-Related Definitions. For purposes of clarity and the use of simplified language in the following text, here are definitions of key terms used related to GDP reporting:
"Gross Domestic Product (GDP)" is the headline number and the most widely followed broad measure of U.S. economic activity. It is published quarterly by the Bureau of Economic Analysis (BEA), with two successive monthly revisions and with an annual revision the following July.
"Gross Domestic Income (GDI)" is the theoretical equivalent to the GDP, but it is not followed by the popular press. Where GDP reflects the consumption side of the economy and GDI reflects the offsetting income side. When the series estimates do not equal each other, which almost always is the case, the difference is added to or subtracted from the GDI as a "statistical discrepancy." Although the BEA touts the GDP as the more accurate measure, the GDI is relatively free of the monthly political targeting the GDP goes through.
"Gross National Product (GNP)" is the broadest measure of the U.S. economy published by the BEA. Once the headline number, now it rarely is followed by the popular media. GDP is the GNP net of trade in factor income (interest and dividend payments). GNP growth usually is weaker than GDP growth for net-debtor nations. Games played with money flows between the United States and the rest of the world tend to mute that impact on the reporting of U.S. GDP growth.
"Real" means growth has been adjusted for inflation.
"Nominal" means growth or level has not been adjusted for inflation. This is the way a business normally records revenues or an individual views day-to-day income and expenses.
"
GDP Implicit Price Deflator (IPD)" is the inflation measure used to convert GDP data from nominal to real. The adjusted numbers are based on "Chained 2005 Dollars," at present, where the 2005 is the base year for inflation, and "chained" refers to the methodology which gimmicks the reported numbers so much that the total of the deflated GDP sub-series misses the total of the deflated total GDP series by nearly $40 billion in "residual" as of second-quarter 2010.
"Quarterly growth," unless otherwise stated, is in terms of seasonally-adjusted, annualized quarter-to-quarter growth, i.e., the growth rate of one quarter over the prior quarter, raised to the fourth power, a compounded annual rate of growth. While some might annualize a quarterly growth rate by multiplying it by four, the BEA uses the compounding method, raising the quarterly growth rate to the fourth power. So a one percent quarterly growth rate annualizes to 1.01 x 1.01 x 1.01 x 1.01 = 1.0406 or 4.1%, instead of 4 x 1% = 4%.
"Annual growth" refers to the year-to-year change of the referenced period versus the same period the year before. The Census Bureau reported today (December 23rd) that the regularly volatile, seasonally-adjusted new orders for durable goods declined by 1.3% (down by 1.2% before prior-period revisions) month-to-month in November 2010, after a revised 3.1% (previously 3.3%) decline in October orders. Unadjusted, year-to-year change in November new orders was a gain of 10.4%, versus the revised 8.8% (previously 9.5%) annual increase reported for October.
New orders for automobiles declined for the fourth consecutive month, while the highly volatile new orders for nondefense aircraft plunged by 53.1%, down for the second month.
Accordingly, the widely followed nondefense capital goods orders fell by 6.8% (down 6.6% before prior-period revisions) in November, versus a revised monthly decline of 4.2% (previously down by 4.5%) in October. For November, the unadjusted year-to-year growth in the series was 19.0%, versus a revised 24.9% (previously 24.5%) gain in October.
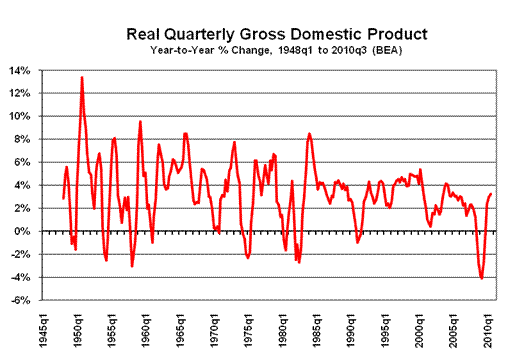
Second Revision to Third-Quarter GDP Revision was Statistical Noise. The second revision of third-quarter 2010 annualized real GDP growth, from 2.5% to 2.6%, was no more than statistical noise in an otherwise largely worthless series. The change was a matter of rounding, with growth revising from 2.53% to 2.56%. At the same time that the annualized, consumer-side GDP notched higher in its latest revision, its theoretically-equivalent, income-side twin, the GDI, revised lower from initial reporting last month of 1.6% to 1.1%.
GDP — The Detail. Published yesterday, December 22nd, by the Bureau of Economic Analysis (BEA), the "third" estimate or second revision of third-quarter 2010 Gross Domestic Product (GDP) showed a revised but still statistically-insignificant annualized real growth rate of 2.56% (previously 2.53%, initially 2.01%) +/- 3% (95% confidence interval), up from an estimated 1.72% in the second-quarter. The year-to-year change in real third-quarter GDP revised to 3.25% (previously 3.24%, initially 3.11%), up from 3.00% in the second quarter.
The GDP implicit price deflator was estimated at an annualized pace of 2.03% (revised from 2.21%, 2.17% in initial reporting) inflation for third-quarter 2010, up from 1.96% in the second-quarter. In contrast, annualized seasonally-adjusted quarterly inflation for the CPI-U in the third-quarter spiked to 1.47%, following a 0.72% contraction in the second-quarter. The lower the inflation rate used in deflating the GDP, the stronger will be the inflation-adjusted number and vice versa.
The SGS Alternate-GDP estimate for third-quarter 2010 remains an approximate annual contraction of 1.4% versus the official estimate of a 3.2% gain, more-negative than the alternate 1.3% annual contraction (3.0% official gain) estimated in the second-quarter (see the Alternate Data tab). While annualized real quarterly growth is not estimated formally on an alternative basis, a flat-to-minus quarter-to-quarter change still appears to have been realistic for the third-quarter. The recent relative upturn in annual change reflects the bottom-bouncing at low levels of activity seen for much of the last year in key underlying economic series, not an economic recovery. As discussed in Special Commentary No. 333 and as will be updated in next week’s Commentary, an intensified downturn, now in the form of a double-dip recession, continues to unfold.
The following graph shows the annual percent change in the official inflation-adjusted quarterly GDP for the history of the series. The record annual contraction for the series was 4.11%, seen in second-quarter 2009.
GNP. The first revision of the third-quarter GNP (Gross National Product) also was just statistical noise, showing real annualized quarterly growth of 2.31% versus the initial estimate of 2.33%, and versus 1.81% in the second-quarter. Year-to-year change in the third-quarter was an unrevised 3.35% versus 3.43% in the second-quarter.
GDI. As discussed in the opening GDP comments, the first revision to third-quarter 2010 GDI — the income-side equivalent to the consumption-side GDP — showed an annualized real quarter-to-quarter growth rate of 1.12%, down from 1.61% in initial reporting. Such suggested weaker growth than the 2.56% reported for the latest GDP. This third-quarter GDI growth was down from the 2.70% annualized GDI growth reported in the second quarter. Year-to-year GDI change in the third-quarter was 3.64%, versus the initial estimate of 3.76%, and against 3.35% in the second-quarter.
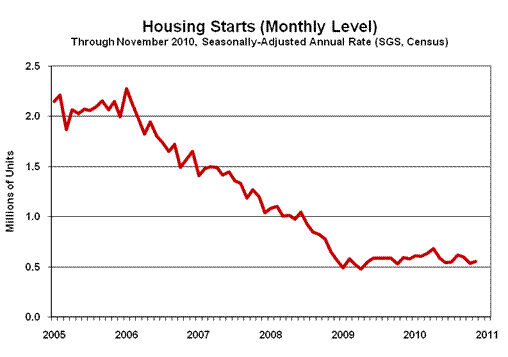
November Housing Starts Change Was Statistically Insignificant. The Census Bureau reported December 16th a statistically-insignificant increase for November 2010 housing starts, up by 3.9% (up by 6.9% before prior-period revisions) +/- 14.0% (95% confidence interval) on a seasonally-adjusted month-to-month basis. October’s starts were revised to a 9.2% (previously 11.7%) decline.
Year-to-year change in November starts was a statistically-insignificant decline of 5.8% +/- 14.0% (95% confidence interval), following a revised annual gain of 0.9% gain (previously a 1.9% decline) in October.
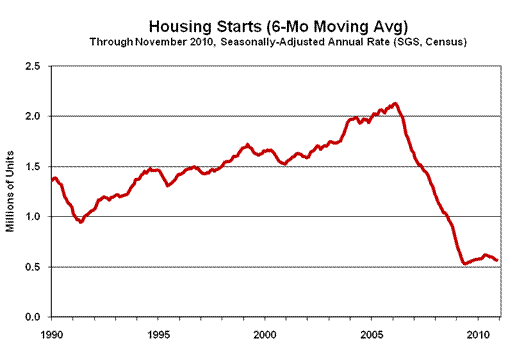
Although the pattern of housing starts generally remains one of bottom-bouncing at an historically low-level plateau of activity, as seen over the last 23 months, the recent activity has started to slow anew, meaningfully. Even-weaker monthly numbers remain likely in the months ahead. Since December 2008, housing starts have been bottom-bouncing, averaging a seasonally-adjusted annual rate of 571,800. In those 23 months, all monthly readings have been within the normal range of monthly volatility for the series around that average, with the November 2010 reading of 555,000 below average. More significantly, the six-month moving-average for the series, as of November, stood at 565,500, below the average level of the 23-month period of bottom-bouncing. Housing starts have begun rolling down hill, once again.
The "recovery" in housing is shown in these graphs. The first graph reflects the level of monthly activity in terms of the annualized monthly rate of housing starts, which is randomly volatile and subject to large revisions on a monthly basis. The second graph shows the six-month moving average, which tends to smooth out that monthly volatility.
November Homes Sales Continue Bottom Bouncing Near Historic Low Levels of Activity. Both existing and new November home sales were reported with insignificant monthly gains, continuing a pattern of bottom-bouncing near historic lows hit earlier in 2010, along with continuing deep annual contractions in sales activity. Although part of the current year-to-year decline can be accounted for by a sales spike last year driven by expiring tax credits, net of the that effect, year-to-year sales still are down sharply, as can be eyeballed in the graphs at the end of this section. The lack of a home sales pick-up is consistent with a re-intensifying downturn in the already-crippled residential construction industry.
Today’s (December 23rd) reporting of November new-home sales (counted based on contract signings, Census Bureau) showed a statistically-insignificant monthly gain of 5.5% (up 2.5% before prior period revisions) +/- 18.9% (95% confidence interval) from October. October showed a revised 10.7% (previously 8.1%) monthly decline. The year-to-year decline in the new home sales series in November 2010 was a statistically-significant 21.2% +/- 15.5% (95% confidence interval), versus a revised 30.6% (previously 28.5%) decline in October.
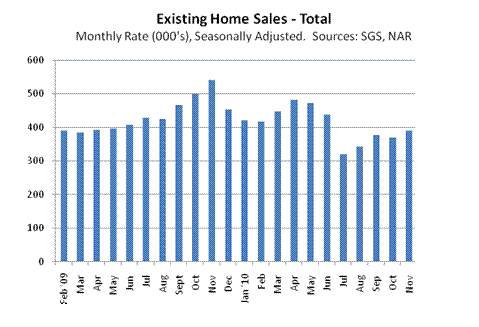
Yesterday’s (December 22nd) release of November existing-home sales (counted based on actual closings, National Association of Realtors [NAR]) showed a 5.6% increase in monthly activity versus October’s unrevised 2.2% decline. On a year-to-year basis, November sales fell by 27.9% against November 2009, with October sales down by 25.9% from the year before.
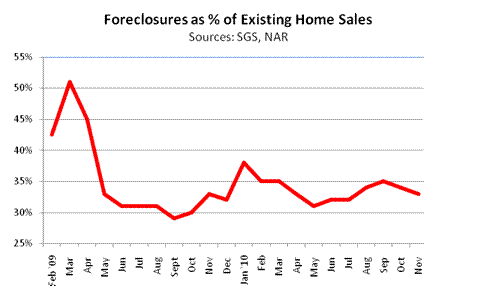
Foreclosure activity remained a major distorting factor for home sales, with "distressed" activity accounting for an estimated 33% of existing sales in the NAR’s November reporting, down from an estimated 34% in October. Short-lived foreclosure moratoriums likely are having some impact here.
Separately, the Census Bureau acknowledges that a portion of new home sales also is from foreclosure activity but offers no estimates as to the scope of the issue. Some in the construction trade have difficulty competing with the pricing of foreclosed properties. Until the foreclosure problems get worked out in the system, monthly changes in these home sales numbers cannot be taken as meaningful positive indicators (when the numbers are positive) of underlying activity in homeowner real estate, as it relates to general economic activity.
The following updated graphs reflect different measures of home sales activity since February 2009. The numbers, through November 2010, reflect the seasonally-adjusted level of monthly sales, rather than the annual rates usually published by the industry.


Week Ahead. Given the unfolding reality of an intensifying double-dip recession and more-serious inflation problems than generally are anticipated by the financial markets, risks to reporting will tend towards higher-than-expected inflation and weaker-than-expected economic reporting in the months ahead. Increasingly, previously unreported economic weakness should show up in prior-period revisions. That said, there are no major economic releases in the week ahead.
__________
|