Annual Income Variance Analysis
Reporting/Market Focus from the September 2007 Edition of the SGS Newsletter
The Census Bureau’s Income, Poverty, and Health Insurance Coverage in the United States: 2006 was published in late August. I regularly ignore the heavily politicized reporting tied to poverty, as it has little meaning in the real world, but I do look at detail on reported income variance and income levels, which can be of significance.
Without getting into broader philosophical issues, income variance is a long-term (multi-year) indicator of economic activity. The more extreme it gets, the worse the economy and the financial markets eventually will become. Looking at two simplified markets with one man making $100,000,000 per year or 1,000 men making $100,000 per year, there will tend to be more speculative financial markets in the first case, but more automobiles will be sold in the second case. The system tends to be self-adjusting when income variance reaches an extreme, with the speculative market bubble eventually bursting and income and economic activity tending to get redistributed.
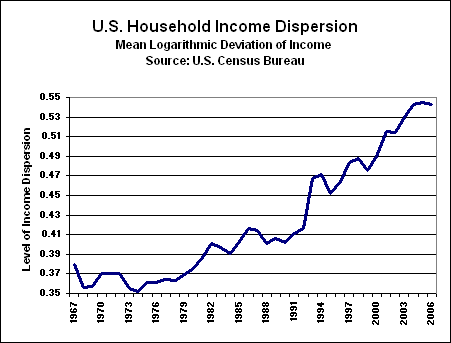
As shown in the following graph, income dispersion remains at an historic high, well beyond any level seen before the onset of the Great Depression. The mean logarithmic deviation of income actually declined to 0.543 in 2006 from 0.545 in 2005, but such is a statistically meaningless difference.

Curiously, the estimates of the 1929 peak variance were topped in the years before the 1987 stock crash. The extreme increase in income dispersion since 1987 was thanks largely to the policies of former Fed Chairman Greenspan, but it also has opened prospects of potentially unparalleled financial-market turmoil in the next several years.
Also found in the Poverty Report are a variety of income measures. As shown in the next two graphs, real (inflation adjusted) median income, which is the income level for the middle person in a survey, has been in annual decline for men since 2003, and for women since 2002. The patterns show a declining standard of living in the last three to four years and are much more consistent with an ongoing recession than the reported booming economy.


Keep in mind that these numbers use the woefully inadequate CPI numbers published by the Bureau of Labor Statistics. I shortly will explore various income measures over time using both official inflation and the SGS-Alternate CPI-U.
The good news is that real median household income rose for the second year in 2006. How could men and women have declining income and households have rising income? It is all in how one plays with the population statistics, and therein is a topic for a not-too-distant Reporting/Market Focus that will tie these games to the unemployment report, on the back of which this survey was conducted.