September 2007 Edition
Issue Number 35
September 23, 2007
__________
Bernanke's Tap Dancing on the Dollar Landmine Triggers Detonation
The Dollar Matters, and Its Sell-Off Is Just Beginning
It's Inflation and[ Recession, Not Inflation or Recession
Manic Stocks Ignore Dollar, Oil and Gold
Key Economic Reporting Massaged as Liquidity Crisis Deepens
__________
PLEASE NOTE: The August CPI and SGS-Alternate CPI measures have been posted to the Alternate Data tab at www.shadowstats.com.
Over the next week or so, I shall be relocating from Whitehouse Station, New Jersey to Oakland, California. Once set up in Oakland (anticipated for early in the first week of October), the new telephone number and other particulars, etc., will be advised in a separate e-mail.
Along with the new circumstance will come new features for your SGS subscription. It is planned for the October monthly newsletter to be available in PDF format for easier viewing and printing, in addition to the current html format. Updates on economic and market developments will become more frequent, so as to be more timely in addressing current "hot topics." Again, many thanks to all for your ongoing business, support and interest.
Best wishes, John Williams
The Problems Are Just Beginning
An old-fashioned bank run in the U.K.? The U.S. and Canadian dollars at parity? Saudi Arabia considering a break with the U.S. Dollar? If you tap dance on a land mine long enough, odds favor an unhappy ending. A good dancer can buy time, and Federal Reserve Chairman Ben Bernanke bought about as much time as he could, having been set up by his predecessor with irreconcilable economic and financial problems. Bernanke might have forestalled the unfolding dollar crisis a bit further with just a 25 basis point cut in the fed funds target, but the 50 basis point move opened Bernanke's Box of U.S. Dollar and inflation unthinkables. The reality is ugly, and like Pandora -- who opened a jar unleashing a variety of evils upon the world -- Mr. Bernanke will find it very difficult, if not impossible, to push his newly activated nightmares back into the box. With both recession and inflation woes in place for some time, the inflationary recession is deteriorating at an accelerating pace, exacerbated, not triggered, by the still unfolding systemic liquidity crisis.
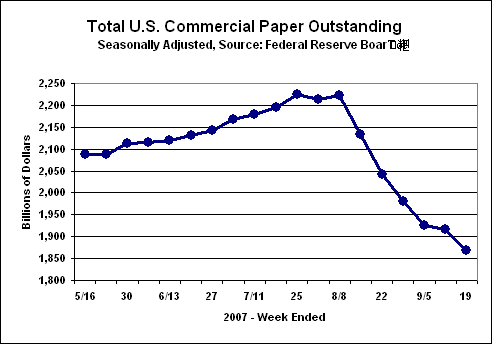
That the liquidity crisis continues can be seen in the following graph of weekly commercial paper outstanding. After a week's slower pace of collapse, the week ended September 19th showed a resumption of the ongoing pace of collapse that helped to trigger the first discount rate cut back on August 17th.
"The dollar and deficit do not matter," has been a staple of Fed and Washington political wisdom since the days of President Richard Nixon and Federal Reserve Chairman Arthur Burns. Federal Reserve Chairman Alan Greenspan followed that advice in the wake of the 1987 stock market crash and prevailed. Perhaps Chairman Bernanke thought it was worth trying the traditional escape one more time. More likely, though, Bernanke was seeing a much more severe threat to the systemic collapse than the markets perceived, when he cut both the federal funds and discount rates by 50 basis points. The reaction in currencies, gold and Treasuries was foreseeable; the U.S. system never has faced such a crisis with its markets so heavily dependent on foreign capital for liquidity. The Fed chairman likely knew exactly what he was doing and anticipated how the markets would respond. Accordingly, the post-easing price movements in both gold and currencies likely were muted by covert central bank activity. Intervention rarely has lasting impact, and as intervention subsides, fundamental dollar selling and gold buying should begin to accelerate.
Even so, after a generation of official abuse, the greenback has set record lows on a trade-weighted and financial-weighted basis, and selling pressures have pushed the U.S. currency over the edge, looking down into an abyss where the bottom is a functionally worthless currency. In particular, covert central bank intervention appears to be propping the dollar against the Japanese yen. Accordingly, a sudden drop in the U.S. dollar against the yen may signal the onset of particularly heavy fundamental dollar selling, as the greenback's day of reckoning approaches.
Then, of course, there is the U.S. stock market, the most irrational of the domestic markets. Wall Street has been spinning the hype that the Fed's actions will solve the liquidity problems and reinvigorate the economy. Stock prices have rallied. Therein lies the great fraud perpetrated on the American public that "the dollar doesn't matter."
With news radio on in the background as I write this missive, I just heard a story of how Americans -- living on or near border with Canada -- are finding on recent cross-border shopping trips that their U.S. dollars have lost 30% of their purchasing power in the last three years. That is the equivalent of an annual U.S. inflation rate of roughly 10%, which, not so coincidentally, is reasonably close to our annual SGS-Alternate CPI measures.
Indeed, as shown in the Markets Perspective section, U.S. stocks have rallied by 7.6% to 9.0% since the August discount rate cut, including 3.1% to 3.5% gains since last week's easing. In the same periods, the Canadian dollar rallied by 7.5% and 3.0%, nearly offsetting the U.S. stock gains, while the Australian dollar rallied by 10.1% and 3.9%. A holder of Australian dollars, who was lucky enough to buy into U.S. equities before the Fed's initial action, has lost money.
Then there is gold -- the traditional inflation hedge -- that rallied by 11.3% and 2.5% for the same periods. The dollar's declines against other currencies, contrasted with stock market gains, are likely to cross over as well, shortly. For average U.S. consumers, who have all of their assets denominated in greenbacks, their global purchasing power has taken roughly a 4% hit in the last month, the equivalent of an annualized pace of inflation of 57% to 69%, depending on whether one is looking at the financial-weighted or trade-weighted U.S. dollar.
That the average consumer has been experiencing declining purchasing power in recent years should be of no surprise to Main Street U.S.A. Some details on median incomes and income dispersion, as published by the Census Bureau, confirm same, based on official CPI reporting and as discussed in this month's Reporting/Market Focus.
Confluence of Worst-Case Inflation Factors. Further hits to consumer purchasing power are promised by other developments surrounding the liquidity and dollar crises. A weak dollar tends to spike the prices of imports. That even applies to some dollar-denominated imports such as oil. A drop in the dollar means lower effective oil import prices for non-dollar importers. Market forces tend to balance that out, with the differential putting upside pressures on oil prices. Also, oil producers find the purchasing power of their dollar-denominated export income reduced by a weak dollar. That puts pressure on oil exporters to abandon the dollar and increases speculation of same. Partially as result, oil prices are at record highs. The combination of dollar woes and intensifying global political risks in the Middle East suggest much higher oil prices still ahead. Higher energy costs already are in place for U.S. consumers, and odds favor those pressures getting much worse.
As the Fed liquefied a domestic financial system in crisis, money supply growth spiked, with the August monthly average SGS-Ongoing M3 up by 14.0% year-to-year, versus the 13.0% annual gain seen in July (see Money Supply section). The weekly M2 numbers and published non-M2 M3 components now are jumping all over the place, often in different directions on a seasonally-adjusted or unadjusted basis (we use the seasonally adjusted). Nonetheless, the August gains appear to be holding, on either basis, but September's annual M3 growth is up in the air at the moment. In any event, the August growth level was at a 34-year high, a level that usually would be a precursor to rising inflation.
Against this background, the August CPI and PPI both were reported with seasonally-adjusted monthly contractions and slowing annual growth. Even with gimmicked reporting, the pattern is a fair bet to reverse sharply in the next several months.
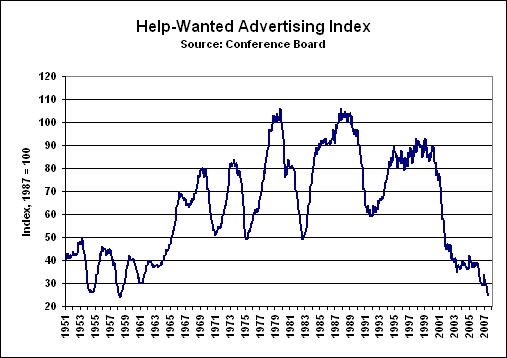
Despite Some Distorted Numbers, Business Activity Keeps Tumbling. The weak August payroll number was foreshadowed by plunging help-wanted advertising and higher new claims for unemployment. Nonetheless, the reporting of the small payroll decline may have been a deliberate Administration ploy to pressure the Fed into an easing that increasingly was deemed to be a political necessity.
As shown in the accompanying graph, July help-wanted advertising fell to its lowest level since 1958. While part of the downward shift in newspaper ads is due to the rapid, somewhat offsetting growth of online advertising in recent years, the recent plunge in ads shows a significant deterioration in current employment conditions, irrespective of Internet activities.
Most August data reflect no or limited impact from the liquidity crisis that broke in the latter half of the month. Nonetheless, retail sales, industrial production, housing starts, the trade deficit, consumer confidence and the purchasing managers survey generally showed activity consistent with an ongoing slowdown/recession.
PLEASE NOTE: A "General background note" provides a broad background paragraph on certain series or concepts. Where the language used in past and subsequent newsletters usually has been or will be identical, month-after-month, any text changes in these sections will be highlighted in bold italics upon first usage. This is designed so that regular readers may avoid re-reading material they have seen before, but where they will have the material available for reference, if so desired.
General background note: The U.S. economy is in a protracted and deepening structural recession that will prove to be the second leg of a double-dip recession, which began in 2000/2001. The current downleg was signaled in mid-2005 by a series of leading indicators used for that purpose by SGS. With neither traditional fiscal nor monetary stimulus available to help turn economic activity, the current circumstance is likely to evolve into a hyperinflationary depression (see December 2006 SGS).
Market Turmoil Likely to Intensify. The Fed took its best shot at stabilizing the system, but, as feared, those actions tended to destabilize the U.S. dollar and inflation fears. In turn, those factors should intensify and likely will turn back on the U.S. equity and credit markets, exacerbating a self-feeding destructive cycle in an extraordinarily unstable and over-leveraged system. The ultimate evolution of current dollar selling into a true dollar rout and dumping panic remains key to the unfolding of these developments. Gold should shine in such a circumstance.
Alternate Realities. General background note: This section updates the Shadow Government Statistics (SGS) alternate measures of official CPI and GDP reporting. When a government economic measure does not match common public experience, it has little use outside of academia or the spin-doctoring rooms of the Federal Reserve, White House and Wall Street. In these alternate measures, the effects of gimmicked methodological changes have been removed from the official series so as to reflect more accurately the common public experience, as embodied by the post-World War II CPI and the pre-Reagan-Era GDP. The methodologies for the series are discussed in the August 2006 SGS (see Archives page at www.shadowstats.com).
GDP. The alternate second-quarter GDP growth reflects the "preliminary" estimate revision, with many of the methodological gimmicks of recent decades removed. The alternate second-quarter inflation-adjusted annual growth rate (year-to-year, as opposed to the popularly-touted annualized quarter-to-quarter rate) for GDP was a decline of roughly 2.3% versus the official year-to-year gain of 1.9%.

General background note: Historical data on both the official and SGS-Alternate GDP series are available for download on the Alternate Data page of www.shadowstats.com. The Alternate GDP numbers tend to show deeper and more protracted recessions than have been reported formally or reflected in related official reporting. Nonetheless, the patterns shown in the alternate data are broadly consistent with the payroll employment and industrial production series (as revised), which are major indicators used by the National Bureau of Economic Research in determining the official timing of U.S. business cycles.
CPI. The annual non-core annual inflation rates eased again in August, while the so-called "core" inflation rates remained relatively stronger. Food and oil-related price pressures increasingly are a problem, due primarily to supply issues, but those pressures have been avoided in much of the government's reporting of the non-core inflation, so far. Recent sharp increases in market prices suggest this trend in monthly reporting should reverse in the next month or two.
                             Eight Levels of Inflation
                      Annual Inflation for May to August 2007


                                                 2007
          Measure                                May    Jun    Jul    Aug
          I.1 Core PCE Deflator                   2.0%   1.9%   1.9%   n.a
          I.2 Core Chained-CPI-U                  1.9%   1.8%   1.8%   1.7%
          I.3 Core CPI-U                          2.2%   2.2%   2.2%   2.1%
          I.4 PCE Deflator (r)                    2.4%   2.3%   2.1%   n.a.
          I.5 Chained-CPI-U                       2.3%   2.3%   2.1%   1.8%
          I.6 CPI-U                               2.7%   2.7%   2.4%   2.0%
          I.7 Pre-Clinton CPI-U                   6.1%   6.1%   5.7%   5.4%
          I.8 SGS Alternate Consumer Inflation   10.3%  10.3%  10.1%   9.9%


          Notes: I.1 to I.3 reflect the core inflation rates, respectively,
          of the substitution-based personal consumption expenditure (PCE)
          deflator, the Chained-CPI-U and the geometrically-weighted CPI-U.
          I.4 to I.6 are the same measures with energy and food inflation
          included. The CPI-U (I.6) is the measure popularly followed by
          the financial press, when the media are not hyping core inflation.
          I.7 is the CPI-U with the effects of geometric weighting (Pre-
          Clinton Era as estimated by SGS) reversed. This is the top series
          in the CPI graph on the SGS home page www.shadowstats.com.
          I.8 reflects the SGS Alternate Consumer Inflation measure, which
          reverses the methodological gimmicks of the last 25 years or so,
          plus an adjustment for the portion of Clinton-Era geometric weighting
          that is not otherwise accounted for in BLS historic bookkeeping.
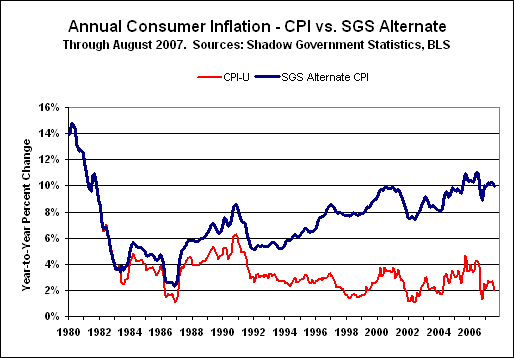
General background note: Historical data on both the official and SGS-Alternate CPI series are available for download on the Alternate Data page of www.shadowstats.com. The Alternate CPI numbers tend to show significantly higher inflation over time, generally reflecting the reversal of hedonic adjustments, geometric weighting and the use of a more traditional approach to measuring housing costs, measures all consistent with the reporting methodology in place as of 1980.
In response to a horrific systemic liquidity crisis, the Federal Reserve cut the discount rate, on loans made to distressed banks, by 50 basis points on August 17th. On September 18th, the Fed cut the discount rate by another 50 basis points and lowered the targeted fed funds rate the same amount to 4.75%. The hypesters on Wall Street have been spinning this "good news" in hopes of pushing stock prices to new highs on speculation of a saved economy and on hopes of credit flowing freely once again. The systemic problems, however, are structural, not as superficial as the markets' spinmeisters, and the rest of the world has started to respond accordingly.
The following table shows how various financial indicators have fared since the Fed's actions.
        Financial-Market Indicators versus Fed Activity


                     21 Sep 2007   Change from   Change from
                     Closing       16 Aug 2007   17 Sep 2007
                     Price/Level   Pre-Discount  Pre-Fed Funds
                                   Rate Cut      & 2nd Discount
                                                 Rate Cuts
     Equity Market
     DJIA            13,820.19      +7.59%        +3.11%
     S&P 500          1,525.75      +8.11%        +3.35%
     Wilshire 5000   15,338.93      +8.43%        +3.37%
     NASDAQ Comp      2,671.22      +8.99%        +3.47%


     Credit Market(1)
     3-Mo T-Bill         3.74%       -5 bp        -41 bp
     2-Yr T-Note         4.06%       -2 bp         -2 bp
     5-Yr T-Note         4.31%       +5 bp        +10 bp
     10-Yr T-Note        4.64%       +4 bp        +16 bp
     30-Yr T-Bond        4.89%       -3 bp        +17 bp


     Oil(2)
     US$ per Barrel
     West Texas Int.     83.36     +17.39%        +3.46%


     Currencies/Dollar Indices(3)
     US$/Unit
     Pound Sterling     2.0208      +1.91%        +1.45%
     Euro               1.4076      +5.03%        +1.56%
     Swiss Franc        0.8522      +3.75%        +1.18%
     Yen                0.0088      -1.36%        -0.68%
     Canadian Dollar    0.9992      +7.45%        +2.99%
     Australian Dollar  0.8650     +10.05%        +3.87%
     Weighted Currency Units/US$
     Jan. 1985 = 100
     Financial (FWD)     48.18      -3.70%        -1.45%
     Trade (TWD)         53.93      -4.26%        -1.66%


     Precious Metals(4)
     US$ per Troy Ounce
     Gold               737.00     +11.29%        +2.50%
     Silver              13.47      +8.94%        +6.99%


     bp -- Basis point or 0.01%. (1) Constant maturity yield, U.S.
     Treasury. (2) Department of Energy. (3) Shadow Government
     Statistics, Federal Reserve Board (See Dollar Index Section for
     definitions). (4) London afternoon fix, Kitco.com.
As discussed earlier, the "boom" in stocks was relative to the perspective of the currency of the domicile of the investor.
While the back-up in long-term interest likely reflects mounting inflation concerns, the change largely offset the flight-to-quality concerns that had lowered the same rates after August 16th. Long-term rates still are shy of the highs seen earlier this year.
Oil and precious metals boomed, while the dollar tanked, except against the yen. Significant selling pressure against the yen should be an early indicator of the dollar sell-off moving into a much more severe phase.
Two months ago, I noted, "little action can be expected from the Fed, until either a dollar panic or systemic liquidity issues force its hand. The Fed otherwise remains hamstrung, unable with its impaired monetary tools either to contain a commodity-driven inflation or to stimulate a structurally damaged economy. Unfortunately, signs of both risk cases -- dollar selling and possible systemic liquidity issues -- are starting to surface."
Last month, I added that, "The systemic liquidity crisis should continue blossoming for at least the next several weeks, with the dollar-panic risk case likely to kick in soon. At such time as the 'flight-to-safety' switches from into to out of the dollar and Treasuries, stocks and bonds will sell off heavily." The liquidity crisis has triggered Fed action, and the U.S. dollar is starting to hit back with a counteraction. The circumstance continues to evolve with the markets still playing out a very dangerous game.
General background note: The U.S. economy remains in a severe, structural inflationary recession, saddled with an impotent Fed and a federal government that is fiscally bankrupt in all but name. In combination, these factors offer the worst of all environments to the financial markets. Ahead lie higher long-term interest rates and much lower U.S. equity prices. On the plus side is the outlook for gold, which provides a solid hedge against many of the problems that have started to surface. Key to the near-term movements of these markets remains the fate of the U.S. dollar, which appears to have started a major downside move.
U.S. Equities -- After hitting all-time highs a couple of months back, and then selling off some, most U.S. stock indices have gyrated in increasingly volatile and unstable markets. Underlying fundamentals remain weak, but the markets are manic, driven by the latest story to be spun out of Wall Street. Stocks could go on to new highs or crash from current levels, but eventually are headed much lower than they are now. Net selling pressure should tend to mount as U.S. dollar selling turns serious.
General background note: As the equity markets catch up with the underlying economic and looming financial fundamentals, the downside adjustments to stock prices should be quite large, eventually rivaling the 90% decline in equities seen in the 1929 crash and ensuing several years. The decline might have to be measured in real terms (net of inflation), as a hyperinflation eventually will kick in as the Fed moves to liquefy the system. Stocks do tend to follow inflation, since revenues and earnings get denominated in inflated dollars. Hence with a hyperinflation, a DJIA of 100,000 or 100,000,000 could be expected, but such still would be below today's levels, adjusted for inflation.
General background note: The approaching financial maelstrom already has come over the horizon and now is nearing landfall. When it hits, those investors who have taken shelter in cash, gold and outside the U.S. dollar will be the ones with the wealth and assets available to take advantage of the extraordinary investment opportunities that should follow.
U.S. Credit Market -- Recent credit market activity remains dominated by the still unfolding liquidity crisis, and the markets will continue to gyrate accordingly. "Flight to quality" issues appear to have been overwhelmed by mounting market fears that inflation will not be contained, at least for the foreseeable future. Softer economic data ahead may fuel speculation of further, near-term Fed easings, but increasing U.S. dollar weakness can and eventually is likely to frustrate further Fed actions.
The dollar decline appears to have started, and general selling of the greenback can become severe at any time. Inflation problems also will worsen markedly, not only from the dollar pressures, but also from accelerating money growth and rising oil and food prices. These factors all should underpin higher long-term interest rates. As a result, six months to a year from now, I expect long-term interest rates will be much higher than they are now, with a sharp, positively-sloped yield curve.
U.S. Dollar -- The Fed's recent interest rate activity has intensified selling of the U.S. dollar against the major currencies, except for the Japanese yen. In prior crises, when the Fed knew that certain planned actions would affect the markets, preemptive, covert interventions were prepared and carried out to keep the markets orderly. Except against the yen, where the effort appears to have been to prop up the greenback, the effort seems to have kept the selling orderly, so far. Nonetheless, market sentiment now runs strongly against the dollar, and intensified, panicked selling can break at any time.
Potentially exacerbating the circumstance are recent moves by Communist China to threaten use of their dollar sales "nuclear option" (see Alert of August 12th), by Iran requesting that Japanese buyers pay for their oil purchases in yen, and now by press stories that the Saudis are looking to de-link from the U.S. dollar. The U.S. markets remain particularly vulnerable, at the moment, to "surprises" from those countries that are not so friendly to the United States, or even from those who simply would like to avoid large losses on the dollars they hold. Accordingly, reports of slowing official foreign investment in U.S. Treasuries could be signaling a major investment shift already underway.
Beyond further Federal Reserve missteps, or further major negative surprises out of the liquidity crisis, the proximal trigger for a dollar panic could come from a bad economic statistic, political missteps by the Administration, negative trade or market developments in Asia, or a terrorist attack or even increasingly likely military action against Iran. When it hits, the broad selling pressure should be strong enough to overcome short-lived central bank intervention.
General background note: In terms of underlying fundamentals that tend to drive currency trading, the dollar's portfolio could not be worse. Relative to major trading partners, the U.S. economy is much weaker, interest rates are lower and anticipated possibly to go lower still, inflation is higher, fiscal and trade-balance conditions are abysmal, and relative political stability is at a nadir. The President's approval rating commonly has moved currency trading in the past, and, despite any near-term bouncing, it remains lower than has been seen for any other U.S. President in the post-World War II era. Relative political stability issues are compounded by the presence of a Congress that is increasingly hostile to the President, and that is rated even lower by the American people than is the President. Generally, the greater the magnitude of the dollar selling, the greater will be the ultimate inflation pressure and liquidity squeeze in the U.S. capital markets.
As shown in the following graph, the U.S. dollar held about even in August versus July, holding at or near all-time lows on both a financial- and trade-weighted basis. The added September 21st data points show current levels below the August averages.

General background note: Historical data on both dollar series are available for download on the Alternate Data page of www.shadowstats.com. See the July 2005 SGS for methodology.
U.S. Dollar Indices. The Shadow Government Statistics' Financial-Weighted U.S. Dollar Index (FWD) is based on dollar exchange rates weighted for respective global currency trading volumes. For August 2007, the monthly dollar average rose by 0.29% after falling by 2.03% in July. The August 2007 average index level of 49.40 (base month of January 1985 = 100.00) was down 4.71% from August 2006, with July down 6.08% from the year before. The index's historic monthly-average low was 48.98 in April 1995, has been broken in the last week, with the September 21st closing level now at 48.18.
Holding at its all-time monthly-average low, August's level of the Federal Reserve's Major Currency Trade-Weighted U.S. Dollar Index (TWD) was unchanged versus July, which was down 1.80% versus June. The August 2007 index level of 55.78 (base month of January 1985 = 100.00) was down 4.51% from August 2006, against July's 5.41% decline from the year before. As of September 21st, the TWD closed at 53.93.
Gold -- As of Friday (September 21st), London gold closed at $737.00 per troy ounce, with silver at $13.47. For August, the monthly-average gold price (London afternoon fix per Kitco.com) averaged $665.41 per troy ounce, against July's $665.30 per troy ounce. Silver averaged $12.36 per troy ounce in August, down from $12.91 in July.
Gold price volatility continues, but generally, the price movement has turned to the upside during the still-breaking systemic liquidity crisis. Highly suspect here remains the possibility of covert central bank intervention in tandem with intervention aimed at muting the effects of dollar selling. Despite central-bank machinations or intervention, the upside potential for the precious metals remains explosive, new record high prices loom.
General background note: As discussed in the Hyperinflation Series (see the December 2006 to March 2007 SGSs), the eventual complete collapse of the U.S. dollar -- the world's reserve currency -- will force the creation of a new international currency system. Gold likely will be structured into any replacement system, in an effort by those organizing the new currency structure to gain public acceptance.


The updated gold versus oil and Swiss franc graphs show August averages as well as added points for closing prices on September 21st. As of Friday's closing prices, gold was trading around $737, oil at over $83 and the Swiss franc above $0.85. All three measures should trade significantly higher in the months ahead.
With the Fed facing tumultuous markets, the August inflation reports, in particular, showed unusual results, suggestive of some manipulation aimed at soothing a potentially market-disruptive easing. The bulk of the other major economic reports, however, generally have continued coming in on the soft side of expectations.
Financial-market sentiment has moved towards inflation and perhaps a bit away from recession, thanks to perceptions of overly aggressive Fed easing, but the reality of a recessionary economy beset by inflation problems will continue to dominate honest economic reporting.
With the President's positive rating continually bottom bouncing and with a distraught Fed still trying to contain an expanding systemic meltdown, recent and upcoming releases of major series have been, and likely will continue to be, subject to some manipulation, as mentioned above. Statistical games are being played for both the perceived political needs of the Administration and the increasingly heavy financial market needs of an impotent Federal Reserve. We are looking now at moves that continue to border on national security issues.
Absent manipulation, and against lagging and still largely distorted market expectations, most near-term economic reporting should tend to surprise the markets on the downside, while most inflation reporting should tend to surprise expectations on the upside.
Employment/Unemployment -- The August payroll report still appears to have been a set-up to push the Fed into an easing. The Bureau of Labor Statistics (BLS) easily could have shown a month-to-month gain, instead of a small monthly decline, if it wanted to. It also could have shown the much weaker growth that is inherent in the underlying numbers, but the intent here seems to have been not to scare the markets too terribly, just to push consensus forecasts into the recession camp and Mr. Bernanke into a rate cut.
Keep in mind that the payroll survey is based on the pay period (household survey is based on the week) including August 12th. Anyone who worked at all in that period is considered employed, hence the August data do not reflect any meaningful change due to the liquidity crisis, which just was beginning to come to a head at that time. The September report should pickup any resulting carnage in the financial services industry.
Seasonally-adjusted August nonfarm payrolls fell by 4,000 (down by 85,000 net of revisions) +/- 129,000 for the month, following a revised 68,000 (previously 92,000) gain in July, and a revised 69,000 (previously 126,000) gain in June. Annual growth slowed sharply from 1.31% in July to 1.12% in August.
Once again, applying consistent, not-seasonally-adjusted year-to-year change to the seasonally-adjusted numbers yielded weaker than advertised payroll result. Applying August's unadjusted annual growth rate to the adjusted numbers yields an adjusted monthly August payroll plunge of 82,000. Interestingly, where similar analysis last month suggested a 47,000 consistent gain, versus official initial reporting of 92,000, July's seasonal factors were revised so as to be consistent. On that basis, July's reported growth now is 69,000, higher than my estimate only because of other revisions in June.
The statistically-sounder household survey showed seasonally-adjusted employment tumbling by 316,000 for August, following a 30,000 decline in July. The seasonally-adjusted U.3 unemployment rate held at 4.64% +/- 0.23% in August, versus 4.65% in July. Unadjusted August U.3 fell to 4.6% from 4.9% in July, while the broader U.6 measure eased to 8.4% from 8.6% (unadjusted) but rose to 8.4% from 8.3% (adjusted). Net of the "discouraged workers" defined out of existence during the Clinton Administration, the traditional unemployment rate continues to run around 12%.
The August employment gain was against a background of plunging help-wanted advertising, rising new claims for unemployment insurance and weaker employment numbers in the August purchasing managers surveys (see respective sections). These background numbers remain consistent with continued weakness in official jobs and unemployment reporting.
The monthly bias factor (birth/death model) in August was an add-on of 120,000, compared with 122,000 a year ago. The add-ons continue to be mindless, such as the 15,000 upside bias in construction, which was the same factor as the year before. Where the September 2006 bias factor was 13,000, such suggests some added downside pressure on the September 2007 payroll estimate.
Next Release (October 5): The September payroll survey should show intensifying economic weakness but likely will be massaged towards market expectations. Financial market instabilities are likely to continue, and rigged numbers can be used as an inexpensive form of market intervention. In like manner, reality should be an increase in the unemployment rate, barring manipulations.
Gross Domestic Product (GDP) -- The "preliminary" estimate revision of annualized real (inflation-adjusted) growth for the second quarter of 2007 was 3.95% +/- 3%, per the Bureau of Economic Analysis (BEA), up from initial reporting of 3.38%. The second quarter's gain rebounded from 0.60% in the first quarter, while year-to-year growth revised to 1.92%, up from an initial second-quarter estimate of 1.78%, and up from 1.55% in the first.
On the inflation front, the GDP deflator in the second quarter helped to spike real growth, with annualized inflation of just 2.68% in revision (originally 2.69%) against the 4.23% inflation pace estimated for the first quarter.
The BEA also published its first estimates of two broad alternate GDP measures, Gross National Product (GNP), where GDP is GNP net of trade in factor income (interest and dividend payments), and Gross Domestic Income (GDI), which is the theoretically-equivalent income number that matches the GDP's consumption number. Annualized quarterly real growth in second-quarter GNP was 3.96%, up from 0.66% in the first quarter, while second-quarter GDI was 4.38% versus 1.17% in the first quarter.
Although the GDP report is the government's broadest estimate of U.S. economic activity, it is also the least meaningful and most heavily massaged of all major government economic series. Published by the BEA, it primarily has become a tool for economic propaganda. Adjusting for methodological distortions built into GDP reporting over time, the SGS-Alternate GDP measure suggests economic reality is much weaker than officially reported. Alternate year-to-year annual contractions continue, with an annual 2.3% contraction in the second quarter deepening from the 2.2% decline in the first quarter (see the graph in the Alternate Reality section of the Opening Comments).
Next Release (September 27): The "final" estimate revision of annualized quarterly real GDP growth for the second quarter could weaken slightly, if the new trade data were accounted for accurately. Politics and financial market sensitivities, however, argue in favor of revisions no greater than normal statistical noise.
Consumer Price Index (CPI) -- The BLS reported the seasonally-adjusted August CPI-U (I.6) down by 0.14% (down 0.18% unadjusted) +/- 0.12% (95% confidence interval) for the month, compared with a gain of 0.13% (down by 0.03% unadjusted) in July.
Annual inflation eased to 1.97% in August from 2.36% in July. Annualized year-to-date inflation through August was 3.67% adjusted, 4.58% unadjusted. The accounting for both CPI-U and PPI inflation again was suspiciously shy in the area of energy and food inflation. For example, the CPI gasoline was down by 4.9% for the month, while the retail sales report suggested a decline of 2.4%, enough of a difference to wipe out most of the reported monthly CPI decline.
Annual inflation for the Chain Weighted CPI-U (C-CPI-U) (I.5) -- the substitution-based series that increasingly gets touted by the manipulators as the replacement for the CPI-U -- was 1.85% in August versus 2.08% in July.
Adjusted to pre-Clinton (1990) methodology (I.7), annual CPI growth was about 5.4% in August, down from 5.7% in July, while the SGS-Alternate Consumer Inflation Measure (I.8), which reverses gimmicked changes to official CPI reporting methodologies back to 1980, was roughly 9.9% in August, against 10.1% in July. The eight levels of annual inflation, I.1 to I.8, are shown in the table in the Alternate Reality section, along with the graph of SGS-Alternate Consumer Inflation.
Next Release (October 17): Assuming some pick-up in monthly inflation for September, annual inflation should spike next month and continue rising into 2008. Seasonally-adjusted, monthly CPI-U fell by 0.5% in September 2006. Accordingly, any monthly reporting above or below that for the pending release of September 2007 CPI will add or subtract directly to or from the current annual CPI-U inflation rate. Reporting risks generally favor an upside surprise to modest market expectations, barring targeted manipulation. A renewed upside movement in core inflation remains long overdue.
Federal Deficit -- General background note: The federal government's fiscal 2006 (fiscal year-end September 30th) deficit, prepared based on generally accepted accounting principles (GAAP), widened to $4.6 trillion from 2005's $3.5 trillion. Those numbers dwarfed the officially-gimmicked 2006 federal budget deficit of $248.2 billion, which was down $70.8 billion from 2005's $318.5 billion (see the December SGS).
General background note: Although it lacks the accrual accounting of the GAAP numbers, the change in gross federal debt bypasses several of the reporting manipulations and is a better indicator of actual net cash outlays by the federal government than is the official, gimmicked deficit reporting. As of fiscal year-end 2006, the gross federal debt stood at $8.507 trillion, up $574 billion from 2005, which in turn was up $554 billion from 2004.
For the rolling 12 months through August 2007, the gimmicked deficit was $218.2 billion versus $269.0 billion in August 2006, compared with the rolling deficits of $165.8 billion in July 2007 and $255.4 billion in July 2006. The gap in the year-to-year rolling deficits narrowed sharply in August.
For August 30, 2007, the gross federal debt stood at $8.990 trillion, up $58 billion from July and up $486 billion from August 2006, which in turn was up $573 billion from August 2005. For July 31, 2007, the gross federal debt stood at $8.932 trillion, up $64 billion from June and up $488 billion from July 2006, which in turn was up $557 billion from July 2005.
General background note: The Administration and Congress continue playing bookkeeping games. Even so, the gimmicked deficit should widen in the next 12 months, as government finances begin to suffer from tax revenue losses due to the intensifying recession and relative tax receipt declines after the expiration of recent corporate tax incentives. While GDP growth estimates can be gimmicked, incoming tax receipts (based on consistently applied tax policies) remain an independent estimate of underlying economic reality and eventually will reflect the economy's mounting difficulties.
Initial Claims for Unemployment Insurance -- The trend in annual growth in initial claims has reversed, strengthening on a relative year-to-year basis and turning marginally positive (an economic negative). On a smoothed basis for the 17 weeks ended September 15th, annual change was growth of 0.5%, versus the 17 weeks ended August 11th, where annual change was a contraction of 1.7%.
General background note: More often than not, week-to-week volatility of the seasonally-adjusted weekly claims numbers is due to the Labor Department's efforts to seasonally adjust these numbers around holiday periods, such as Easter, Memorial Day, July 4th and Labor Day. The Labor Department has demonstrated an inability to do such adjusting successfully. When the new claims series is viewed in terms of the year-to-year change in the 17-week (four-month) moving average, however, such generally is a fair indicator of current economic activity.
Real Average Weekly Earnings -- Reflecting the artificial monthly decline in reported August CPI, August's seasonally-adjusted monthly real earnings rose by 0.5% against a 0.1% decline in July. Annual growth rose to 2.1% in August versus a 1.3% gain in July.
General background note: Gyrations in the poor quality of reported CPI growth account for most month-to-month volatility in this series. Adjusting for the major upside biases built into the CPI-W inflation measure used in deflating the average weekly earnings, annual change in this series shows the average worker to be under severe financial stress in an ongoing recession.
Retail Sales -- August's seasonally-adjusted retail sales rose by 0.28% (up 0.40% net of revisions) +/- 0.9% (95% confidence interval), thanks to reportedly strong auto sales. Little impact from the unfolding liquidity crisis would have made it into the August report. Retail sales in July increased by a revised 0.49% (previously up by 0.29%). Net of inflation, August sales were up by 0.42%, but there was a disconnect in related gasoline price reporting, and the government's numbers are not to be believed.
On a year-to-year basis, August retail sales were up by 3.74% before inflation and by 1.77% after inflation, compared with respective annual growth numbers for July of 3.56% and 1.20%.
General background note: Real (inflation-adjusted) year-to-year growth in retail sales below 1.8% (using the official CPI-U for deflation) signals recession, and a signal first was generated in this business cycle back in June 2006.
Next Release (October 12): Not only should September retail sales tumble anew, below expectations, but higher September inflation should generate real contractions on a monthly and possibly also on a year-to-year basis.
Industrial Production -- Seasonally-adjusted industrial production rose by 0.2% in August, against a revised 0.5% (was 0.3%) gain in July. A surge in heat-related utility usage helped to spike not only the utility index, but also the manufacturing index (still down 0.3%), where key components of production are estimate based on utility consumption. Annual growth in August held at 1.69%, the same as in July (previously 1.38%).
Next Release (October 16): Look for September industrial production to decline, moving once again into a pattern of contraction. Eventually, monthly contractions in this series should become regular, with the rapidly slowing annual growth turning negative.
New Orders for Durable Goods -- For July, the usually volatile durable goods orders rose by 5.9% (6.2% net of revisions), on a seasonally-adjusted basis, after rising a revised 1.9% (previously up 1.4%) in June. On an annual basis, durable goods orders rose a reasonably healthy 4.7%.
The closely followed nondefense capital goods new orders rose by 5.8% on top of a 6.4% gain in June. Gains were much softer after aircraft orders, which tend to be stretched out over time, with an ex-aircraft gain of 2.2% in July versus a 0.1% contraction in June. July's annual growth rate for total nondefense capital goods was 16.2%.
General background note: Durable goods orders lost its status as a solid leading economic indicator when the semi-conductor industry stopped reporting new orders in 2002.
Trade Balance -- The seasonally-adjusted monthly trade deficit for July narrowed to $59.2 billion, but it widened net of revisions. Originally reported at $58.1 billion, the June deficit was revised to $59.4 billion, along with revised larger deficits in the entire January to June 2007 period. For the first six months of 2007, the seasonally adjusted deficit now stands at $355.3 billion, against last month's estimate of $352.7 billion.
The difference was a re-estimation of the guesstimates used in the reporting of the services surplus, numbers that are little better than fudge factors. Although the new data widened both the first- and second-quarter deficits, and correspondingly should have weakened reported GDP in those periods, the first-quarter GDP is inviolate until nest July's annual revisions. What happens to the second-quarter GDP's "final" estimate remains to be seen.
That said, games still are being played with data, and the current trade shortfall remains well shy of reality. Continued trade deficit underreporting may be intended to help the dollar some, with the Fed abandoning the greenback. Historically, such as in 1987/1988, disruptions of import paper flows have been used to adjust initial trade deficit reporting. Something like that appears to be in play at the moment. Revisions next year should tell the story.
Next Release (October 11): Underlying reality favors renewed deterioration in the August monthly trade deficit, barring ongoing manipulation. Reporting risk generally remains on the negative side of consensus forecasts. The months ahead should see a pattern of regularly increasing deficits that shortly, again, will be setting new records.
Consumer Confidence -- August consumer confidence declined sharply, only partially reflecting the breaking liquidity crisis. The Conference Board's Confidence measure fell 6.2% for the month, with the three-month moving average up by 3.1% year-to-year. The University of Michigan's Sentiment measure plunged by 7.7% for the month, with the three-month moving average growth easing to 3.0%.
These lagging, not leading, indicators tend to reflect the tone of the popular financial media and show renewed concern of faltering business activity.
General background note: The Conference Board measure is seasonally adjusted, which can provide occasional, but significant distortion. The adjustment does not make much sense and is of suspect purpose, given that the Conference Board does not release the unadjusted number. The Michigan survey is unadjusted. How does one seasonally-adjust peoples' attitudes? Also, beware the mid-month Consumer Sentiment release from the University of Michigan. Its sampling base is so small as to be virtually valueless in terms of statistical significance.
Short-Term Credit Measures -- Patterns of annual growth in consumer and commercial borrowing have been disrupted by the liquidity crisis, with a sharp fall-off in annual growth for commercial paper outstanding in August. The ongoing crisis in commercial paper on a weekly basis is discussed and shown in the graph in this month's Opening Comments. Problems were not apparent in August reporting of commercial and industrial loans, and the early impact on consumer credit will not be seen until August or September reporting of that series.
Annual growth eased to 4.8% in July, from 5.1% in June, for seasonally-adjusted consumer credit, which includes credit cards and auto loans, but not mortgages. In the current environment, where inflation-adjusted growth in income (see this month's Reporting/Market Focus) is not adequate to support meaningful growth in the personal consumption component of GDP, GDP growth only can come from temporary debt expansion or savings liquidation. Accordingly, stagnating growth in consumer debt expansion places an ongoing constraint on economic growth. Benchmark revisions show overall consumer credit to be about 0.4% less than previously reported.
Commercial borrowing growth varied sharply, with annual growth in August commercial paper outstanding dropping to 4.7% from 21.7% in July. Annual growth in commercial and industrial loans held at 12.8% in August, the same as in July. Solid growth in the commercial credit measures can signal credit needs tied either to rising sales and receivables/inventory, or to slowing sales and slowing collections and involuntarily rising inventories. The forced slowing of growth in commercial paper outstanding, however, will place definite constraints on broad business activity.
Producer Price Index (PPI) -- Falling in line the Fed's need for weak inflation numbers, the seasonally-adjusted August finished goods PPI plunged by 1.4% (down by 1.4% unadjusted), thanks to "collapsing" energy prices. Such contrasted with the 0.6% (0.7% unadjusted) surge in July's PPI. Annual PPI in August fell to 2.2% from July's 4.0% reading. Also reflecting the sharp contraction in energy prices, seasonally-adjusted intermediate and crude goods fell by 1.2% and 2.0%, respectively, versus increases of 0.6% and 1.2% in July. The accounting for both PPI and CPI-U inflation, however, remains well shy of reflecting actual food and energy inflation.
Next Release (October 12): Despite the regular random volatility of the monthly price variations, PPI inflation reporting over the next six-to-nine months generally should come in above market expectations. As with the CPI, the core PPI inflation rate still is long overdue for an upside surprise, but such may be further delayed by the financial-market needs of a battered Federal Reserve.
General background note: The following numbers are generally good-quality leading indicators of economic activity and inflation that offer an alternative to the politically-hyped numbers when the economy really is not so perfect. In some instances, using a three-month moving average improves the quality of the economic signal and is so noted in the text.
Economic Indicators
Purchasing Managers Survey: Manufacturing New Orders -- Playing further catch up and continuing its trend toward showing a recession in manufacturing, the overall August ISM manufacturing index fell to 52.9 from 53.8 in July, with the August employment index at 51.3 versus 50.2 in July. Continued decline in the broad series is a good bet in the next several months, based on declining annual activity in a variety of underlying series.
The August new orders index eased to 55.3 from 57.5 in July. Seasonal-factor distortions, which have been present, usually are overcome by viewing the series using year-to-year change on a three-month moving average basis. On that basis, the August new orders index was up by 3.3% versus a 5.7% gain July.
General background note: Published by the Institute for Supply Management (ISM), the new orders component of the purchasing managers survey is a particularly valuable indicator of economic activity. The index is a diffusion index, where a reading below 50.0 indicates contracting new orders. The index gradually has notched lower from its peak annual growth of 42.6% in April of 2004. As an SGS early warning indicator of a major economic shift, the new orders measure breached its fail-safe point in mid-2005, generating a signal of pending recession.
Service Sector Index. The service-sector ISM index does not have much meaning related to overall business activity, since new order activity at law firms, hospitals or fast-food restaurants has little obvious relationship to broad economic activity. That said, the overall August services sector index held at 55.8, the same level as in July. Both the services employment and prices paid components, however, have some meaning. The August employment component plummeted to a recessionary 47.9 from July's 51.7. The prices paid component is covered in the Inflation Indicators.
Help-Wanted Advertising Index (HWA) -- As discussed and graphed in this month's Opening Comments, the Conference Board reported that help-wanted advertising plunged still again, to 25 in July, from 26 in June and down from 27 in May, down from 29 in April, down from 34 in December, hitting its lowest level since 1958. Even allowing for the advertising volume lost to the Internet in recent years, the current weakness is severe enough to signal a deepening problem in the employment sector. The July number was down 19.4% from the year before, versus an 18.8% annual contraction June.
Viewed on a three-month moving-average basis, July's year-to-year change was a contraction of 18.8% versus 17.2% in June. The series still indicates rapidly deteriorating employment conditions. Where the index never recovered from the 2000/2001 recession, its renewed and ongoing plunge has signaled a new and rapid contraction in economic activity. Continued deterioration remains likely in the months ahead.
Housing Starts -- August's seasonally-adjusted housing starts fell by 2.6% +/- 10% (95% confidence interval) for the month, after a revised 6.9% (previously 6.1%) monthly decline in July. Year-to-year, August starts were down by 19.1% (+/- 7.1%), the data still reflect little impact of the mortgage-related liquidity that broke in the latter part of the month.
Confirming ongoing weakness in the housing sector, August building permits were down 5.9% for the month and 24.5% for the year. August data on homes sales are due in the week ahead.
Inflation Indicators
Money Supply -- The SGS Ongoing M3 estimate of annual growth for the August average surged to 14.0% from 13.0% in July. The increase reflects liquidity crisis factors as discussed in this month's Opening Comments. The current pace of growth has disturbing inflationary implications.
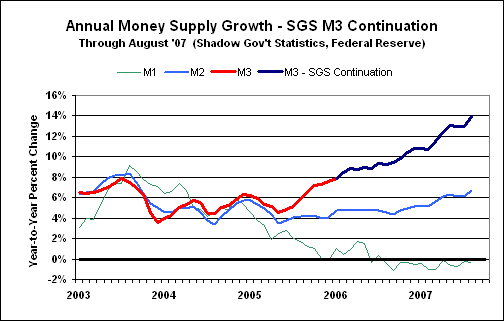
General background note: Historical annual growth data for the money supply series, including the SGS Ongoing M3 estimates, are available for download on the Alternate Data page of www.shadowstats.com. See the August 2006 SGS for methodology. The indicated M3 levels below are our best estimate and are provided at specific subscriber request. Keep in mind that regular revisions in the related Fed series affect historical M3. Usually, annual growth rates hold, although levels may shift a little. We have not attempted, nor do we plan to recreate a revised historical series for an M3 monthly-average level going back in time. The purpose of the SGS series was and is to provide monthly estimates of ongoing annual M3 growth. We are comfortable with those numbers and that our estimated monthly growth rates are reasonably close to what the Fed would be reporting, if it still reported M3. With those caveats on the table, here are the monthly-average levels for M3:
      Shadow Government Statistics Ongoing M3
  (Estimated seasonally-adjusted monthly average)


              Current     Yr Before
   Month      $ Tril      $ Tril     % Yr/Yr


   Mar 07     11.541      10.347     11.5%
   Apr        11.719 (r)  10.417     12.5%
   May        11.861 (r)  10.490     13.1%
   Jun        11.916 (r)  10.547     13.0%
   Jul        12.001 (r)  10.624     13.0%
   Aug        12.229 (p)  10.732     14.0%


  (p) August's preliminary estimate is based on full-month
  reporting. (r) Revised.


  NOTE OF CAUTION: The estimates of monthly levels best are
  used for comparisons with other dollar amounts, such as
  nominal GDP. While the estimates are based on seasonally-
  adjusted Federal Reserve data, great significance cannot
  be read into the month-to-month changes, as was the case
  when the Fed published the series. The most meaningful way
  to view the data is in terms of year-to-year change.
Based on the August data, annual growth for monthly M1 fell by 0.36%, versus a 0.28% contraction in July, while August M2 annual growth rose to 6.68% from 6.15% in July.
Purchasing Managers Surveys: Prices Paid Indices -- The August prices paid indices were slightly softer, again, still not reflecting the continuing surge in oil prices that should show up next month. The levels, however, remain high and in inflation territory, suggestive of ongoing inflation issues in both purchasing managers surveys.
On the manufacturing side, the August price index eased to 63.0 from July's 65.0. On a three-month moving average basis, August's annual change was down by 14.0%, following July's 12.1% drop. The manufacturing price indicator is not seasonally adjusted and, therefore, is a generally better indicator of pricing activity.
On the non-manufacturing side, the seasonally-adjusted August prices diffusion index also softened again, to 58.6 from July's 61.3. On a three-month moving-average basis August's annual change was a decline of 14.3% following July's decrease of 11.2%.
General background note: Published by the Institute for Supply Management (ISM), the prices paid components of the purchasing managers surveys are reliable leading indicators of inflationary pressure. The measures are diffusion indices, where a reading above 50.0 indicates rising prices.
Oil Prices -- For the month of August, the monthly-average West Texas Intermediate spot price (Department of Energy) eased by 2.4% to $72.39 per barrel from $74.18 in July. Against last year's average, August's level was down by 0.9%, versus July's year-to-year decline in average monthly price of just 0.3%.
As of Friday, September 21st, West Texas Intermediate closed at an all-time high of $83.36. Price movement remains highly volatile, but broadly is trending higher, and should continue setting new daily record highs. Continued, meaningful upside risks to oil prices remain in play, both from the intensifying dollar weakness and related OPEC rumblings, and from ever-volatile Middle Eastern political tensions. One can hope that the worst of the hurricane season has passed, but that still could be in play, too.
General background note: Whether from supply and demand, geo-political or currency pressures, oil prices will remain at highly inflationary levels and will continue as a major contributing factor to U.S. inflation woes. Historically high oil prices still are working their way through all levels of U.S. economic activity, ranging from transportation and energy costs, to material costs in the plastics, pharmaceutical, fertilizer, chemical industries, etc. These broad inflationary pressures will remain intact despite any near-term oil price volatility. Although these pressures may be slow to surface in government reporting of the so-called "core" inflation measures, they will surface.
The Census Bureau's Income, Poverty, and Health Insurance Coverage in the United States: 2006 was published in late August. I regularly ignore the heavily politicized reporting tied to poverty, as it has little meaning in the real world, but I do look at detail on reported income variance and income levels, which can be of significance.
Without getting into broader philosophical issues, income variance is a long-term (multi-year) indicator of economic activity. The more extreme it gets, the worse the economy and the financial markets eventually will become. Looking at two simplified markets with one man making $100,000,000 per year or 1,000 men making $100,000 per year, there will tend to be more speculative financial markets in the first case, but more automobiles will be sold in the second case. The system tends to be self-adjusting when income variance reaches an extreme, with the speculative market bubble eventually bursting and income and economic activity tending to get redistributed.
As shown in the following graph, income dispersion remains at an historic high, well beyond any level seen before the onset of the Great Depression. The mean logarithmic deviation of income actually declined to 0.543 in 2006 from 0.545 in 2005, but such is a statistically meaningless difference.
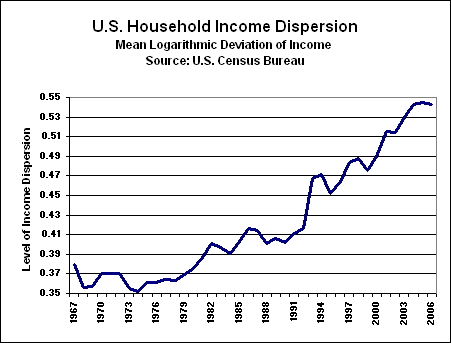
Curiously, the estimates of the 1929 peak variance were topped in the years before the 1987 stock crash. The extreme increase in income dispersion since 1987 was thanks largely to the policies of former Fed Chairman Greenspan, but it also has opened prospects of potentially unparalleled financial-market turmoil in the next several years.
Also found in the Poverty Report are a variety of income measures. As shown in the next two graphs, real (inflation adjusted) median income, which is the income level for the middle person in a survey, has been in annual decline for men since 2003, and for women since 2002. The patterns show a declining standard of living in the last three to four years and are much more consistent with an ongoing recession than the reported booming economy.


Keep in mind that these numbers use the woefully inadequate CPI numbers published by the Bureau of Labor Statistics. I shortly will explore various income measures over time using both official inflation and the SGS-Alternate CPI-U.
The good news is that real median household income rose for the second year in 2006. How could men and women have declining income and households have rising income? It is all in how one plays with the population statistics, and therein is a topic for a not-too-distant Reporting/Market Focus that will tie these games to the unemployment report, on the back of which this survey was conducted.
With the squirrelly season upon us, a review of historical financial-market panics could be of some interest as the current systemic turmoil plays out.
PLEASE NOTE: The Hyperinflation Summary Report still is pending, likely to be published in the third week of October. The October "Shadow Government Statistics" newsletter is targeted for the week of October 15th, allowing for some settling in to the new location in Oakland, California. Postings on the Web site of monthly newsletters, interim Flash Updates and Alerts are advised immediately by e-mail.
OCCASIONALLY, BRIEF UPDATES ARE COMMUNICATED DIRECTLY BY E-MAIL. IF YOU ARE NOT RECEIVING E-MAIL COMMUNICATIONS FROM US, PLEASE LET US KNOW at johnwilliams@shadowstats.com or by using the Feedback option on www.shadowstats.com.