Income Variance Data Signal Economic Troubles Ahead and Household Income Numbers Suggest GDP Fraud
Reporting/Market Focus from the September 2006 Edition of the SGS Newsletter
Income variance is a long-term driver and indicator of economic activity. Another record high — well in excess of the level seen before the 1929 stock crash and Great Depression — was reported as part of the Census Bureau’s just-released Income, Poverty, and Health Insurance Coverage in the United States: 2005
For the leading economic indicators analyzed monthly in SGS, lead times to broad economic activity range between three and nine months. One indicator, however, signals broad trends in liquidity and economic activity three to eight years in advance: income variance/dispersion.
Income variance, also known as dispersion, measures the distribution of household income from very low levels to extremely high levels. The more income is distributed in the extreme ranges, the higher is income dispersion; the more income is distributed in the middle income brackets, the lower is the income dispersion. Extremely high levels of income dispersion have tended to precede great economic and financial catastrophes. Those events, in turn, have tended to redistribute income towards the middle, in something of a self-correcting cycle.
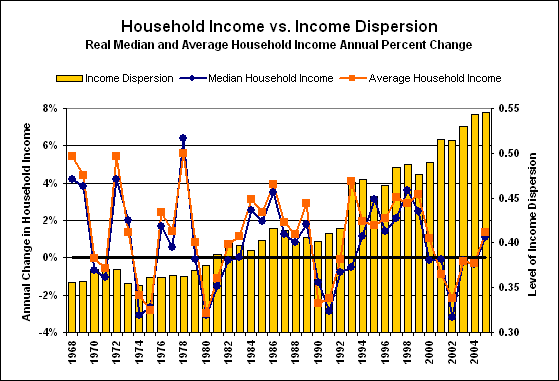
The 1986 variance in U.S. household income, which led the 1987 stock crash, was at the highest level estimated in modern times for the United States, topping the high seen before the 1929 stock crash and the ensuing Great Depression. The income variance level fell following the 1987 crash, but recovered the 1986 level in 1992. The Census Bureau’s estimate of 2005 income dispersion was 31.0% higher than the pre-1987-crash level.
The distribution of wealth and income provides the fundamental structure for all economies. Where income drives consumption, shifts in income distribution impact economic activity. When income distribution shifts away from extremes, a greater portion of the consuming public is in the middle-income bracket, consumption becomes more broadly based, and the economy booms.
Consider, for example, that someone earning $10 million per year likely will buy fewer automobiles than 100 people each earning $100,000 per year.
As income distribution shifts toward extremes, variance and dispersion rise, consumption becomes less broadly based and the economy turns down. A shift in income distribution leads to a structural shift in economic activity, such as currently is underway.
The current distribution of income in the United States has developed in something of a free-market system, with government modification in the form of tax, monetary, welfare, labor and antitrust policies. Without getting into the merits of various forms of modification, and without getting into the larger philosophical questions of wealth distribution, shifts in income variance can be shown to have significant long-term impact on general economic activity.
Our analysis shows a leading relationship between the level of income dispersion and annual growth in systemic liquidity, not adjusted for inflation. This is one reason why the Federal Reserve sometimes finds itself pushing on a string when it tries to stimulate economic activity through money supply growth (as it covertly is doing at present with M3). As shown in the following graph of inflation-adjusted household income vs. income dispersion, income variance was at an all-time extreme as of 2005.

The measure used here is the mean logarithmic deviation of income as published by the Census Bureau in its annual poverty report. There are a variety of income dispersion/variance measures, but they all show the same basic pattern: U.S. income variance is at an unprecedented level that portends a major break in the economic/financial system.
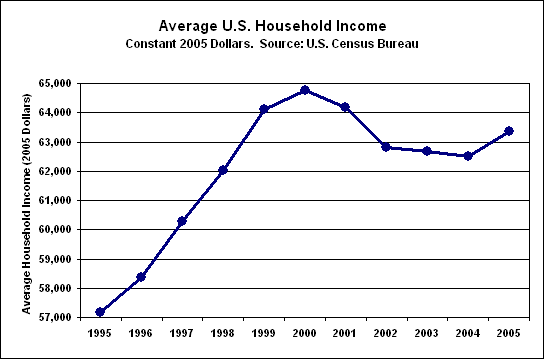
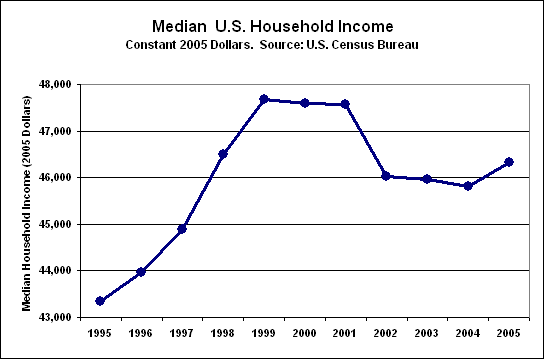
Also reported in the poverty report were estimates of inflation-adjusted average and median (meaning the middle measure) household income levels for 2005. Of some note, as shown in the graphs below, both average and median household income contracted each year from 1999/2000 through 2004, with a suspect rebound in 2005. The earlier years are consistent with data from the Internal Revenue Service. Reality for 2005 eventually will come from IRS reporting.


When real household income is in contraction, so too, usually, is the economy. This suggests that the one-year 2001 recession was much deeper and longer than proclaimed officially, lasting from 2000 through 2004. The unbelievable 2005 income gains likely were a pre-election gimmick worked by "re-weightings" that will revise away next year as IRS data become available. If so, these data will tend to confirm a longstanding SGS contention that the current recession is the second leg of a double-dip recession (see GDP graph in Alternate Reality section). The combination of negative annual growth in household income and the accompanying spike in income dispersion, as shown in the first graph, is a particularly ominous pairing.
Sustained economic growth is possible only in the event of sustained income growth. Debt growth and asset liquidation can buy only short-lived boosts in consumption. Nonetheless, Mr. Greenspan tried his best to gain time in stimulating stock-market and housing bubbles. The respective bubble bursts have helped in timing severe downlegs in the current double-dip recession.
The household income data cannot possibly support reported GDP growth of recent years, suggesting there is an ongoing reporting fraud at the Bureau of Economic Analysis.
Allowing for growth in the number of households, 2004 aggregate inflation-adjusted household income grew by just 0.9%, and 2005 (accepting the reported gain in average household income) was up by 2.3%, annual rates of growth well below annual official GDP growth that has held above 3.0% for the same years. Sustained GDP growth well above real income growth is not possible. Consumption growth fueled only by debt growth and asset liquidation has practical limits. These numbers indicate that reported GDP growth has been systematically and significantly overstated.
These numbers from the Census Bureau also show the system to be continuing at the brink of instability and unable to sustain the phony positive GDP growth reported by the Bureau of Economic Analysis.
As to poverty, the measures of same reported in this survey are poorly defined and manipulated by frequent methodological revisions. As a result, the poverty numbers are of no value. This situation is exacerbated by every-other report coming out two months before national elections.