Money Supply and the SGS Early Warning System
Reporting/Market Focus from the May 2005 Edition of the SGS Newsletter
The Shadow Government Statistics Early Warning System is designed to signal reliably, in advance, major upturns and downturns in the U.S. economy. Since unusually low growth rates in the money supply have triggered the first formal recession warning of this business cycle, money supply growth has become the center of this month’s "Reporting Focus," with an emphasis on the SGS-EWS. Analysis of series-specific information on the money measures will be continued in next month’s SGS.
The concept behind the SGS system was to find the better leading indicators to economic activity and to analyze their growth patterns to see if there were statistically significant growth levels that tended to signal major upturns (real year-to-year growth in GDP above 6.0%) and major downturns or recessions (real year-to-year contractions in GDP).
A series of such indicators was developed in the late 1980s that not only explained past history, but also accurately signaled the 1990-1991 recession with a three-to-nine month lead-time. The same system signaled the 2001 recession and now has begun signaling the 2005-2007 recession. Each series has a fail-safe growth rate level, beyond which, on the upside or the downside, a reliable boom or bust signal is generated.
Complicating factors in the current process are the significant methodological shifts in both CPI and GDP reporting in the 1990s and 2000s that tend to understate inflation and overstate GDP growth. As a result, the leading indicators could indicate a recession, but the actual recession might not get reported.
As discussed in the opening comments, the annual GDP contraction of the 2001 recession has disappeared in benchmark revisions. Nonetheless, the last time around, the NBER broke from heavy reliance on the government’s GDP reporting and called the 2001 recession. One can hope the NBER will continue to call major downturns. If not, then the U.S. may have suffered its last formal recession.
Undesignated periods of contracting economic growth (formerly known as recessions), however, will continue, with significant implications for business activity, sales, profits, the financial markets, etc. These periods still will be signaled by the system.
Money Supply M3 is the broadest money measure published by the Federal Reserve. Unlike the other SGS leading indicators, however, an upturn in money supply growth does not always signal an upturn in the economy. A major downturn in money supply growth, though, always signals recession, but not all recessions are so signaled.
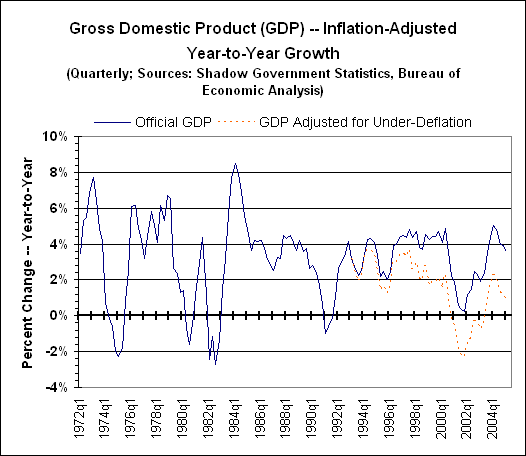
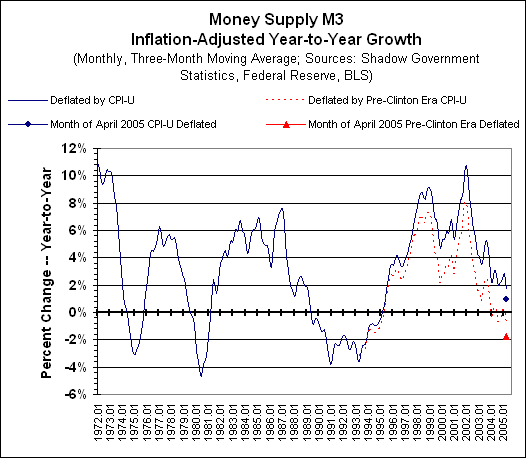
Money supply growth is a causal leading indicator, measuring liquidity in the system. The broader the liquidity measure, the better the relationship to GDP. When liquidity contracts, so does the economy, as can be seen in the graphs of annual, inflation-adjusted growth in GDP (Figure 1) and Money Supply M3 (Figure 2). The pattern of official national business activity is laid out in the graph of GDP growth. M3 growth reflects expansion and contraction of domestic liquidity, often times determined by Federal Reserve policy, and the growth patterns are deflated by the official CPI.
FIGURE 1.
            FIGURE 2.
In comparing the graphs, one can see how a downturn in money growth led the 1973-1975 recession. Similarly, a real money supply contraction led the 1980 recession, but the following surge in money growth did not prevent the second leg of the double-dip recession in 1981-1982. The Fed occasionally finds itself pushing on the proverbial string.
Declining money growth also led the 1990 recession, but the bursting of the stock-market bubble was the proximal trigger of the 2001 recession. The ensuing effort of pumping up the money supply by the U.S. central bank did not create the hoped-for economic boom that might be suggested for 2002 and 2003, despite the wishful thinking of the Bush administration.
The last point on the money supply graph is the three-month moving average of year-to-year M3 growth for April 2005, deflated by the CPI. With money supply growth slowing, 1.7% growth is at a level that always has preceded a recession, as seen before the 1973-1975, 1980 and 1990-1991 recessions. This signal is before any adjustment for distortions resulting from changes in CPI and GDP methodologies.
With inflation corrected to the Pre-Clinton Era methodology (see background articles on the home page), money growth, as shown by the dotted line in the graph, actually has turned negative, and 1999/2000 growth rates slowed enough to signal the 2001 recession.
The individual points for April 2005 on the graph show year-to-year change for just the one month. Adjusted for Pre-Clinton inflation, annual change was a contraction of 1.8%. Historically, the three-month moving averages hit that level one month either side of the NBER’s official timing of the onset of the 1973-1975, 1980 and 1990-1991 recessions. That puts the current system three months, plus or minus, from what likely will be designated the official onset of the 2005-2007 downturn.
Other key indicators are signaling recession or are close to a recession signal, as well. Unlike the money supply, however, these indicators signal reliably on both the upside and the downside and move accordingly in advance of the GDP. As each series kicks in, it will be graphed in the SGS newsletter, showing its historical relationship to GDP.
Like the money supply, annual growth in Real Earnings already has passed its fail-safe growth rate, signaling a recession in the next three months or so. Real Earnings will be graphed in next month’s SGS.
Currently with growth sitting at the fail-safe level is the Purchasing Managers New Orders Diffusion Index.
Above the fail-safe growth rate, but closing in on same, are Retail Sales, Initial Claims for Unemployment Insurance and Housing Starts.
One traditional series that may not actually generate a recession signal is Help Wanted Advertising. It never recovered from the 2001 recession, and recovery in some form is prerequisite to being able to generate a new signal.
Again, as discussed in the opening comments, what is unfolding is a double-dip recession, where the new downturn will be the second leg of a very long and very deep structural downturn in U.S. economic activity.

