JWSGS - MAY 2005 EDITION
Issue Number Seven
May 11, 2005
_____
RECESSION IS IMMINENT
SHARP SLOWING OF GROWTH IN KEY INDICATORS
GENERATES RELIABLE WARNING OF DOWNTURN
INFLATION SURGE AND DOLLAR WILL LIMIT FLATTENING OF YIELD CURVE
Irrespective of how one views the quality of government statistics, inflation-adjusted money supply growth has fallen to a level that always has been followed by an official recession -- always! A number of other key economic indicators also rapidly are nearing, are at or have moved beyond their fail-safe points. Once beyond their fail-safe points, these indicators have not sent out false alarms, either for an economic boom or bust.
The Shadow Government Statistics' Early Warning System (SGS-EWS) has been activated, signaling the onset of a formal recession in the later part of the current quarter or early part of third-quarter 2005. While the details of the warning signal are highlighted in this month's "Reporting Focus," here is the broad picture of what lies ahead.
Sporadic, negative GDP growth likely will not surface in government reporting until later in 2005 or 2006. The National Bureau of Economic Research (NBER), official arbiter of economic cycle timing, should time the downturn to mid-2005 and announce same sometime in early-to-mid 2006. The NBER's timing of the onset of economic contractions tends to be set with the first monthly downturns in the levels of industrial production and payroll employment. The popular financial media will begin to debate whether there is a recession underway by late 2005, but those Wall Street economists who act as shills for the market will keep up their "strong growth is just around the corner" hype regardless of any and all evidence to the contrary.
That said, the softening that has been seen recently in most economic data will accelerate sharply, with monthly contractions beginning for payroll employment and industrial production in the next several months. Significant deterioration also will be seen in federal tax receipts (a widening budget deficit) and corporate profits. This outlook is predicated on economic activity that already has taken place. Not considered, so far, are any risks from exogenous factors, such as renewed terrorist activity in the United States.
Market perceptions will be slow to adjust to the renewed downturn in business activity. When expectations finally begin to anticipate weak data, expectations will be lowered for inflation. As a result, consensus forecasts generally will tend to continue to be surprised on the downside for economic reports, and on the upside for inflation reports, for some time to come.
At the root of current difficulties, a consumer starved of income growth and overburdened with debt cannot sustain the real (inflation-adjusted) growth in consumption needed to keep GDP growth in positive territory. The income weakness is a direct result of the loss of a significant manufacturing base to offshore locations and the ensuing explosive, perpetual growth of the U.S. trade deficit.
Exacerbating consumers' travails will be unusually high inflation during this contraction. Inflation, fueled by high oil prices and weakness in the U.S. dollar, will not be brought under control simply by weakness in economic demand. Instead, persistently high prices only will serve to exacerbate the 2005-2007 recession, making it unusually long and protracted. Ongoing inflation woes and dollar problems will maintain upside pressure on long-term interest rates, inhibiting the traditional flattening of the yield curve expected with a recession.
As discussed last month, a weak economy and low inflation do not always go hand-in-hand, contrary to conventional economic wisdom. Economic reporting in the last month saw a combination of much stronger than expected CPI and PPI inflation rates, while GDP, retail sales, consumer confidence, housing starts, the purchasing managers survey, new orders for durable goods and help-wanted advertising all were much weaker than expected.
An inflationary recession is a nightmare for the financial markets and the Federal Reserve, a bad dream that Mr. Greenspan had hoped would not occur until after he had left office. Particularly hard hit will be the U.S. dollar, with downside implications for both equity and bond prices.
Moving aside from what looms for official economic reporting, reality is not quite so rosy. As seen in Figure 1, the GDP graph in the "Reporting Focus" section, all official recessions of the last 30 years or so (1973-1975, 1980, 1981-1982, 1990-1991 and 2001) have been accompanied by negative year-to-year change in real GDP for at least one quarter, except for the 2001 recession. Although the 2001 recession was reported with an annual GDP contraction at one time, subsequent politicized benchmark revisions erased all consecutive quarterly and year-to-year GDP declines.
Per current official GDP reporting, the 2001 recession never happened; it was just a soft period of erratically stagnant growth. Such nonsense, however, runs strongly counter to common experience and to the story told by most other economic statistics.
Common experience tends to be better mirrored by the dotted line on the GDP graph, which reflects annual GDP growth corrected only for the use of artificially low inflation in deflating GDP over the last decade. The lower the inflation rate used in the GDP deflator, the higher will be the reported rate of inflation-adjusted growth.
The difference between official reporting and common experience is that, officially, the 2005-2007 recession will be just another downturn, following the short and shallow 2001 recession. From the common-experience standpoint, however, the 2001 downturn was deep and protracted, with noticeable recovery not seen until well into 2003 or 2004. Accordingly, the renewed economic downturn in mid-2005 will seem more like the double-dip recession of the early 1980s than a separate and distinct event from 2001's official economic blip.
Greenspan Likely Will Avoid Leavenworth, but ...
As an aside, Alan Greenspan appears to have broken the law, again, with an early peek at the April jobs numbers. Memoirs published by former Labor Secretary Bob Reich confirmed that the Fed Chairman got early advice on what key economic numbers were going to show. The Fed clearly had such information with the April 2005 payroll report, where the FOMC comment after last Tuesday's meeting included: "Labor market conditions, however, apparently continue to improve gradually."
The FOMC would not have made such a statement on Tuesday if the numbers were going to disappoint the markets Friday morning. (See the same-day comments of Gillespie Research, re: "A Little Hanky Panky at the Federal Reserve Banky?") Similar tip-offs in the past by the Fed or White House on employment, inflation or GDP growth always have proved out. Recently, for example, the President's Council of Economic Advisors accurately "guesstimated" the upside annual benchmark revision to payroll employment as part of an effort to show how many jobs the Bush administration really had created.
Although it is not illegal to manipulate the government's economic reports, it is a federal crime for Mr. Greenspan or the White House to have access to them before 4:30 p.m. of the day preceding the official release. While one reasonably could argue that the Fed chairman and the White House should have earlier access to these data, the thinking behind the law was that those at the White House and the Fed would not be able to profit in the U.S. markets off inside information.
Regardless of when the Bureau of Labor Statistics (BLS) or Bureau of Economic Analysis has its final numbers set, the general result usually is known a week or so in advance. All the Fed or White House needs for an accurate public comment is a reliable indication of what is going to happen, not the precise number. Such violates the spirit if not the letter of the law. On the other hand, of course, if you have helped to fix the results of an upcoming report in advance, your knowledge of same is not exactly a leak.
THE BIG THREE MARKET MOVERS
(Each of these series is explored in the background article "A Primer On Government Economic Reports," available on the home page.)
Employment/Unemployment -- April's relatively strong payroll numbers and unchanged unemployment rate largely resulted from poor quality seasonal factors and reflected neither reality nor common experience.
The April data were against a background of falling help-wanted advertising, softening employment as reported in both the manufacturing and services purchasing managers surveys, and deteriorating new claims for unemployment insurance (see the respective sections).
The popularly followed unemployment rate U-3 for April 2005 was 5.15% against 5.17% in March, seasonally adjusted. Unadjusted, U-3 declined from 5.4% in March to 4.9% in April. When such unusually large seasonal swings take place, as is the case in handling variable timing on Easter or the seasonal improvements in the construction climate, it is not unusual for the seasonally-adjusted estimates to overshoot or undershoot reasonableness.
The broader U-6 unemployment measure moved in tandem with U-3, with the unadjusted rate dropping from 9.4% in March to 8.7% in April, and the seasonally-adjusted rate notching lower from 9.1% to 9.0%. Including the long-term "discouraged workers" defined away during the Clinton administration, total unemployment is roughly 12.0%.
The household survey showed a seasonally-adjusted 598,000 surge in March employment, following March's 357,000 gain in the number of people who were gainfully employed.
Moving for once in the same direction, the April payroll survey showed an above-consensus, seasonally-adjusted gain of 274,000 (367,000 net of revisions), with March's original 110,000 increase in jobs revising to 146,000. The current monthly gain in payrolls was statistically significant by about 120,000 jobs. Despite all the good news, except for February's 1.8% year-to-year growth in payrolls, April's annual growth remained stalled at 1.7% for the six straight month.
Of course, 257,000 of the 274,000 gain was the monthly bias factor that the BLS adds in for good measure. That plug factor was up from 179,000 used in March and the 225,000 used in April 2004.
Next Release (June 3): With bias factors still something of a neutral factor in the May report, economic reality, combined with a reversal of April's bad seasonals, offers a good shot at weaker-than-consensus growth. As discussed in this month's opening comments, monthly employment levels soon should peak and begin to decline during the next several months. In like manner, the unemployment rate is a due for a rebound and then should move sharply higher in the third quarter.
Gross Domestic Product (GDP) -- The "advance" estimate of first-quarter 2005 annualized real GDP growth disappointed the markets at 3.08% +/- 3.1%. From the not-widely-stated viewpoint of the BEA, first-quarter GDP growth was statistically indistinguishable from zero growth. With final sales (GDP net of inventory change) at 1.87%, growth was statistically indistinguishable from a contraction. Fourth-quarter 2004 GDP and final sales growth rates were 3.85% and 3.39% respectively.
As shown in the GDP graph (see "Reporting Focus"), first-quarter 2005 year-to-year growth continued to slow, easing to 3.56% from 3.91% in fourth-quarter 2004, 3.99% in the third quarter and down from the cyclical peak of 5.04% in first-quarter 2004.
The GDP implicit price deflator (the inflation rate used to deflate the GDP) rose from an annualized 2.26% in the fourth quarter to 3.26% in the first quarter. For once, the GDP deflator has overtaken the understated CPI, which gained 2.40% on an annualized basis in the first quarter.
As discussed in the background articles, the GDP is the most heavily politicized of the popularly followed series and has little meaning other than as political propaganda, or for the impact it may have on the financial markets. It rarely indicates actual economic activity, except for an occasional coincidence. GDP reporting is overstated by about three percent, which would place actual annualized real growth at roughly zero plus or minus about three percent, given 90% confidence intervals.
Next Release (May 26): The revision published as the "preliminary" estimate of first-quarter 2005 GDP will be influenced by any surprises in today's trade deficit report (see that section). The nature of how the "advance" estimate is put together suggests the BEA inflated the growth rate in order to bring it in closer to consensus forecasts. Accordingly, barring unexpected swings in new underlying data, the first revision should be to the downside.
Early estimates of first-quarter growth in Gross National Product (GNP) and Gross Domestic Income (GDI) also should surface in next month's report.
Consumer Price Index (CPI) -- The seasonally-adjusted March CPI-U provided the markets with an upside surprise, rising by 0.6% (0.8% unadjusted), after gaining 0.4% in February. That resulted in unadjusted March year-to-year inflation inching higher to 3.1% from February's 3.0%.
Using the CPI's original (pre-Clinton Era) methodological approach of a fixed basket of goods (vs. substitution of hamburgers for steak as estimated by geometric weighting) would leave year-to-year inflation at about 5.8% instead of the "official" 3.1%.
The "experimental" Chained Consumer Price Index (C-CPI-U) for March, the fully substitution based CPI that presumably is the eventual replacement for current CPI reporting, held at February's year-to-year inflation rate of 2.6%.
Next Release (May 18): Inflation pressures are not about to abate and will continue offering upside surprises in most reports. Market expectations for inflation are beginning to strengthen, with the expected rise in April CPI around 0.4%, so April may not be as big a market surprise as March was. Nonetheless inflation will be much higher than generally expected for the balance of 2005.
Any seasonally-adjusted monthly change above or below roughly 0.2% in April should add directly to or subtract from the currently reported annual growth of 3.1%.
OTHER TROUBLED KEY SERIES
To varying degrees, the following series have significant reporting problems. Each series will be addressed in a monthly "Reporting Focus," with Money Supply covered this month and next. In addition to the big three, other series that have been detailed are The Federal Deficit (a background article that will be updated shortly), Consumer Confidence (November 2004 SGS), the Trade Balance (December 2004 SGS), Industrial Production (January 2005 SGS), Initial Claims for Unemployment Insurance (February 2005 SGS), Retail Sales (March 2005 SGS) and Alternate Payroll Employment Measures (April 2005 SGS).
Federal Deficit -- The official deficit for the fiscal year ended September 30, 2004 was $412.3 billion, up from $374.8 billion the year before. For the twelve months ended March 2005, the rolling deficit was $406.1 billion versus $420.6 billion in March 2004. Gross federal debt as of the end of September (U.S. fiscal year-end 2004) was $7.379 trillion, up $596 billion from a year earlier; at month-end April 2005, gross federal debt was $7.765 trillion, up $631 billion from April 2004, which, in turn, was up by $673 billion from April 2003.
Despite happy talk of the fiscal 2005 deficit coming in below expectations, the outlook will shift rapidly to the negative side as recession sets in. Since the government's borrowing needs will tend to exceed expectations, there is a good chance that the Treasury will confirm the resurrection of the 30-year Treasury bond come August 3rd.
Initial Claims for Unemployment Insurance -- The annual change for new claims on a smoothed basis, for the 17 weeks ended April 30th was a decline of 6.5% versus a revised decline of 7.1% (was 7.5%) for March 26th. The deterioration over the last several weeks is on track for growth to turn positive (a negative economic development) in the next month or so, supporting signals of a recession onset.
The volatility of the seasonally-adjusted weekly numbers is due partially to the seasonal-adjustment process. When the series is viewed in terms of the year-to-year change in the 17-week (three-month) moving average, however, such is a fair indicator of current economic activity.
Real Average Weekly Earnings -- March's seasonally-adjusted real average weekly earnings fell 0.3% from February, which was down a revised 0.3% (was 0.4%) from January. March's level was 0.5% below March of 2004, against February's 0.7% annual decline.
Average weekly earnings of $537.52 in March 2005 adjusted to $276.08 in constant 1982 dollars. That inflation-adjusted earnings level is 1.8% below the November 2003 recovery peak, 0.1% above the level at the onset of the 2001 recession and 17.3% below the all-time high of December 1972. December 1972 was a little more than a year after Nixon closed the gold window and two months before the U.S. dollar was floated.
Allowing for the biases built into the CPI series used to deflate the weekly earnings, annual change in this series is signaling a recession warning signal, as highlighted in this month's "Reporting Focus."
Retail Sales -- Seasonally-adjusted March retail sales rose 0.3% (0.2% net of revisions) +/- 0.7%, which continues to be statistically indistinguishable from zero growth or a contraction. On a year-to-year basis, March retail sales were up 5.8%, a pace that slowed sharply from February's 7.8% gain. Net of official CPI inflation, annual growth now has slowed to 2.7%.
Inflation-adjusted growth in retail sales below 1.8% (using the official CPI-U for deflation) signals recession, and annual growth is closing in on that level. See comments in this month's "Reporting Focus."
Next Release (May 12): Reflecting the softening economy, the April report should come in on the weak side of expectations, which are running strong, in the 0.7% to 0.8% range.
Industrial Production -- March's seasonally-adjusted industrial production gain of 0.3% (0.1% net of revisions) was boosted by utilities; monthly manufacturing contracted by 0.1%. February's original overall index increase of 0.3% was revised to 0.2%. March's year-to-year growth of 3.9% was up from February's downwardly revised 3.3% (was 3.5%).
Next Release (May 17): With the economy entering recession, overall industrial production should enter a period of protracted decline beginning in the next several months. Accordingly look for downside surprises in production reporting. Expectations for April already are for a small monthly contraction.
New Orders for Durable Goods -- Seasonally-adjusted new orders for durable goods in March fell by 2.8% (3.4% net of revisions) following a revised 0.2% decline (originally a 0.3% increase) in February. March year-to-year change plunged to a 2.8% decline from February's 5.9% (was 5.7%) gain. The widely followed Nondefense Capital Goods Orders plummeted 6.2% for the month after a 0.7% decline in February.
Monthly volatility is high for this series, which used to be one of the better leading indicators of broad economic activity, when smoothed using a three-month moving average. After the semi-conductor industry stopped reporting new orders, the series' quality fell apart. If current monthly growth rates were three-month moving averages in the old series, durable goods orders would be sending out a recession signal.
Trade Balance -- The February trade deficit in goods and services rose to a record $61.0 billion, seasonally adjusted, from an upwardly revised $58.5 (was $58.3) billion in January. The sharp deterioration was one factor behind the slower rate of growth in first-quarter GDP, where widening, negative net exports reduced the reported level of GDP.
Next Release (Today -- May 11): Look for a widening in the March trade deficit, likely beyond the small deterioration expected by the markets. Continued sharp deterioration will follow for at least the next six-to-nine months, with most reports consistently coming in worse than consensus forecasts.
(NOTE: This newsletter was put to bed the evening of May 10th. Results on the March trade data can be found on the Gillespie Research Associates website later this morning, but content is restricted to subscribers only. However, if you are not a GRA subscriber but would like this material, e-mail Doug Gillespie at gsrdr@aol.com; he will forward it to you.)
Consumer Confidence -- April 2005 confidence measures continued their downward trends. The Conference Board's Consumer Confidence dropped for the third month, losing 5.1%, while the University of Michigan's Consumer Sentiment fell for the fourth month, down by 5.3%. Year-to-year change in Confidence slowed from 16.4% in March to 4.8% in April, while Sentiment sank from a 3.3% contraction in March to a loss of 6.9% in April. As lagging, not leading, indicators, these numbers continue to confirm the economy was slowing throughout fourth-quarter 2004 and then stagnating and slowing again into late first-quarter 2005.
Producer Price Index (PPI) -- The seasonally-adjusted March Finished Goods PPI surprised the markets, again, on the upside, rising 0.7% (0.9% unadjusted) for the month, after February's 0.4% gain. March's 4.9% year-to-year inflation is within easing striking distance of the 14-year high of 5.0% seen in November 2004 and could top that in the next report.
Next Release (May 17): Despite a large component of random volatility in monthly price variations, PPI inflation reporting over the next three-to-six months should continue averaging above consensus forecasts.
Purchasing Managers Survey (Non-Manufacturing) -- Published by the Institute for Supply Management (ISM), there is nothing unusually wrong with this survey of the service industry, except it does not have much meaning. Unlike its older counterpart, the manufacturing survey, if service companies such as law firms, hospitals or fast-food restaurants have "increased orders," that does not necessarily mean the economy is picking up.
That considered, the overall index eased from 63.1 in March to 61.7 in April. The index is a diffusion index, where a reading above 50 indicates a growing service economy, in theory. Both the employment and prices paid components, however, have some meaning.
The April employment component dropped sharply from 57.1 to 53.3, suggesting a weak April employment report that did not materialize.
The Prices Paid component diffusion index is a general indicator of inflationary pressures. The April index continued to fall, dropping to 61.9 from 65.6 in March, still consistent with a high level of inflation. On a three-month-moving-average basis, the April prices paid index year-to-year change continued to slow, up 2.2% from April 2004 versus March's 8.2% gain.
BETTER-QUALITY NUMBERS
The following numbers are generally good-quality leading indicators of economic activity and inflation that offer an alternative to the politically hyped numbers when the economy really is not so perfect. In some instances, using a three-month moving average improves the quality of the economic signal and is so noted in the text.
Economic Indicators
Purchasing Managers Survey (Manufacturing) - New Orders -- With the money supply and real earnings data locked into recession warning signals, the new orders index looks like it will be the next of the key SGS early warning indicators to signal a downturn. It basically is at its fail-safe point as discussed in the "Reporting Focus."
The April index plunged 6.0% from 57.1 in March to 53.7. The Commerce Department provides the seasonal factors for this series, and the adjusted monthly numbers often can be misleading in the reporting of month-to-month change. This problem is overcome by using year-to-year change on a three-month moving average basis. April's index was down 18.4% from April 2004 compared with March's 12.5% decline, while the three-month moving average annual decline held at 15.9% for a second month, having continually notched lower from its 36.6% peak annual gain in April of 2004.
Published by the Institute for Supply Management (ISM), the New Orders component of the Purchasing Managers Survey is a particularly valuable indicator of economic activity. The index is a diffusion index, where a reading above 50 indicates rising new orders. The overall April index eased to 53.3 from 55.2 in March, still slowly closing in on the 50.0 that divides a growing versus contracting manufacturing sector.
Also of note, the April employment component of the index eased to 52.3 from 53.3, running counter to the strength reported in April payrolls.
Help Wanted Advertising Index (HWA) -- The March index dropped 4.9% to 39 from 41 in February, continuing something of what might be a seasonal pattern that was followed in 2004. Smoothing seasonal distortions is the reason this series is best viewed on a year-to-year basis with a three-month moving average.
For March, that year-to-year change in the three-month moving average held at 3.4% for a second month but should drop off sharply with the next reporting. HWA is a series that never recovered from the 2000/2001 recession, having been at its cyclical nadir of 36 as recently as November 2004. Accordingly, current movement still is bottom bouncing but worthy of close attention, as per comments in this month's "Reporting Focus."
Published by the Conference Board, the HWA is a reliable leading indicator of employment activity.
Housing Starts -- March housing starts collapsed by 17.6% from February, which, in turn, had shown a monthly gain of 1.8%. March year-to-year change fell by 8.2% after February's 17.6% gain, while, on a three-month moving average basis, March year-to-year growth softened to 7.3% from February's 9.8%. The series remains near-borderline for generating a recession warning.
Money Supply -- Before inflation adjustment, the year-to-year rates of change in seasonally-adjusted April (four weeks) and March M1, M2 and M3 were 2.3%, 4.2% and 4.5%, and 4.9%, 4.8% and 4.8%, respectively, versus February's growth rates of 3.8%, 5.2% and 5.6%. A rapidly slowing trend in the annual growth rates by month has been evident for the last five to six months.
Adjusted for current CPI reporting, April's M1, M2 and M3 annual year-to-year rates of change were down 1.2%, up 0.6% and up 0.9%. On a three-month moving average basis, these annual rates of change were down 0.1%, up 1.5% and up 1.7%, levels that would be well underwater using the old-style CPI. These growth rates have triggered a recession warning signal, which is discussed in detail in this month's "Reporting Focus."
Inflation Indicators
Purchasing Managers Survey (Manufacturing) - Prices Paid -- The April Prices Paid diffusion index eased back 2.7% to 71.0 from March's 73.0, levels that suggest significant ongoing inflation pressures. Nonetheless, on a three-month moving average basis, year-to-year change was down 18.0% after March's 14.6% decline.
Published by the Institute for Supply Management (ISM), the Prices Paid component of the Purchasing Managers Survey is a reliable leading indicator of inflation activity. The measure is a diffusion index, where a reading above 50 indicates rising inflation.
Oil Prices -- West Texas Intermediate Spot (St. Louis Fed) averaged above $50 per barrel in April, but eased back 2.3%, on average, after the 13.2% gain in March's monthly average price. Year-to-year, the average April spot price remained up an extraordinarily inflationary 44.6%, little changed from March's 47.7% annual gain. Despite any near-term sell-offs or price volatility, high oil prices are likely to become a major feature of 2005's inflationary recession.
Oil price changes permeate costs throughout the economy, ranging from transportation and energy costs, to material costs in the plastics, pharmaceutical, fertilizer, chemical industries, etc. Where effects of continued oil price volatility will affect CPI reporting, downside oil price movements tend to be picked up more quickly and fully than are upside movements. Even as currently understated, the, CPI inflation will be stronger than commonly predicted for the next six-to-nine months, partially as a result of these continued high oil prices.
U.S. Dollar -- April's monthly dollar average (the Federal Reserve's Major Currencies U.S. Dollar Index) rose by 1.7% after March's 1.1% decline, movements that appear to be somewhat seasonal in nature. The year-to-year decline in the greenback was 5.9% after March's 6.4% drop.
Dollar volatility has been encouraged by continued huffing and puffing from Asian central banks over investing more funds outside the U.S. dollar, increasing rumors of a pending change in Communist China's currency system, and continued unfettered deterioration of the U.S. trade deficit. Add in the prospects of negative economic shocks looming in U.S. economic data, and serious selling pressure against the U.S. currency could develop in minutes, with very little warning.
New record lows for the dollar remain likely in the months ahead, despite near-term bouncing and any official or unofficial supportive intervention by any central bank(s).
Generally, the weaker the dollar, the greater will be the ultimate inflation pressure and the eventual liquidity squeeze in the U.S. capital markets.
AND THE SGS EARLY WARNING SYSTEM
The Shadow Government Statistics Early Warning System is designed to signal reliably, in advance, major upturns and downturns in the U.S. economy. Since unusually low growth rates in the money supply have triggered the first formal recession warning of this business cycle, money supply growth has become the center of this month's "Reporting Focus," with an emphasis on the SGS-EWS. Analysis of series-specific information on the money measures will be continued in next month's SGS.
The concept behind the SGS system was to find the better leading indicators to economic activity and to analyze their growth patterns to see if there were statistically significant growth levels that tended to signal major upturns (real year-to-year growth in GDP above 6.0%) and major downturns or recessions (real year-to-year contractions in GDP).
A series of such indicators was developed in the late 1980s that not only explained past history, but also accurately signaled the 1990-1991 recession with a three-to-nine month lead-time. The same system signaled the 2001 recession and now has begun signaling the 2005-2007 recession. Each series has a fail-safe growth rate level, beyond which, on the upside or the downside, a reliable boom or bust signal is generated.
Complicating factors in the current process are the significant methodological shifts in both CPI and GDP reporting in the 1990s and 2000s that tend to understate inflation and overstate GDP growth. As a result, the leading indicators could indicate a recession, but the actual recession might not get reported.
As discussed in the opening comments, the annual GDP contraction of the 2001 recession has disappeared in benchmark revisions. Nonetheless, the last time around, the NBER broke from heavy reliance on the government's GDP reporting and called the 2001 recession. One can hope the NBER will continue to call major downturns. If not, then the U.S. may have suffered its last formal recession.
Undesignated periods of contracting economic growth (formerly known as recessions), however, will continue, with significant implications for business activity, sales, profits, the financial markets, etc. These periods still will be signaled by the system.
Money Supply M3 is the broadest money measure published by the Federal Reserve. Unlike the other SGS leading indicators, however, an upturn in money supply growth does not always signal an upturn in the economy. A major downturn in money supply growth, though, always signals recession, but not all recessions are so signaled.
Money supply growth is a causal leading indicator, measuring liquidity in the system. The broader the liquidity measure, the better the relationship to GDP. When liquidity contracts, so does the economy, as can be seen in the graphs of annual, inflation-adjusted growth in GDP (Figure 1) and Money Supply M3 (Figure 2). The pattern of official national business activity is laid out in the graph of GDP growth. M3 growth reflects expansion and contraction of domestic liquidity, often times determined by Federal Reserve policy, and the growth patterns are deflated by the official CPI.
FIGURE 1.


            FIGURE 2.
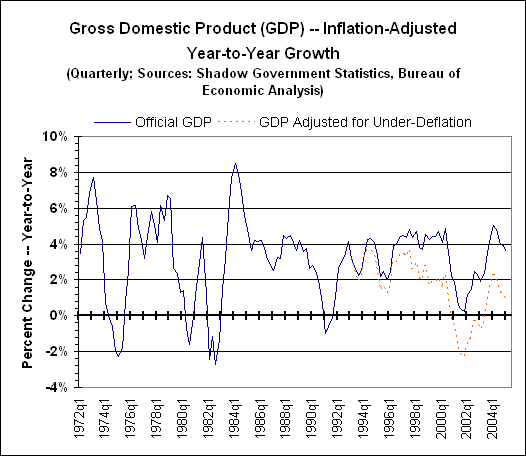
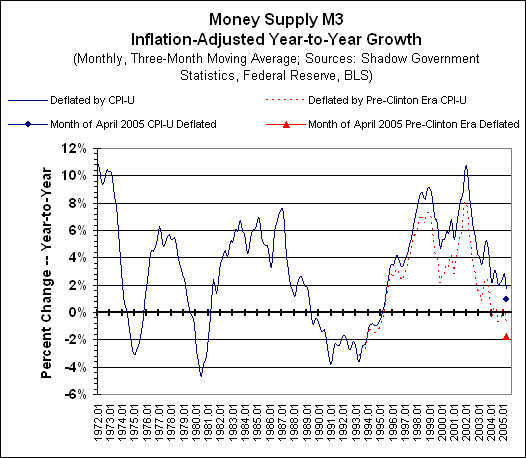
In comparing the graphs, one can see how a downturn in money growth led the 1973-1975 recession. Similarly, a real money supply contraction led the 1980 recession, but the following surge in money growth did not prevent the second leg of the double-dip recession in 1981-1982. The Fed occasionally finds itself pushing on the proverbial string.
Declining money growth also led the 1990 recession, but the bursting of the stock-market bubble was the proximal trigger of the 2001 recession. The ensuing effort of pumping up the money supply by the U.S. central bank did not create the hoped-for economic boom that might be suggested for 2002 and 2003, despite the wishful thinking of the Bush administration.
The last point on the money supply graph is the three-month moving average of year-to-year M3 growth for April 2005, deflated by the CPI. With money supply growth slowing, 1.7% growth is at a level that always has preceded a recession, as seen before the 1973-1975, 1980 and 1990-1991 recessions. This signal is before any adjustment for distortions resulting from changes in CPI and GDP methodologies.
With inflation corrected to the Pre-Clinton Era methodology (see background articles on the home page), money growth, as shown by the dotted line in the graph, actually has turned negative, and 1999/2000 growth rates slowed enough to signal the 2001 recession.
The individual points for April 2005 on the graph show year-to-year change for just the one month. Adjusted for Pre-Clinton inflation, annual change was a contraction of 1.8%. Historically, the three-month moving averages hit that level one month either side of the NBER's official timing of the onset of the 1973-1975, 1980 and 1990-1991 recessions. That puts the current system three months, plus or minus, from what likely will be designated the official onset of the 2005-2007 downturn.
Other key indicators are signaling recession or are close to a recession signal, as well. Unlike the money supply, however, these indicators signal reliably on both the upside and the downside and move accordingly in advance of the GDP. As each series kicks in, it will be graphed in the SGS newsletter, showing its historical relationship to GDP.
Like the money supply, annual growth in Real Earnings already has passed its fail-safe growth rate, signaling a recession in the next three months or so. Real Earnings will be graphed in next month's SGS.
Currently with growth sitting at the fail-safe level is the Purchasing Managers New Orders Diffusion Index.
Above the fail-safe growth rate, but closing in on same, are Retail Sales, Initial Claims for Unemployment Insurance and Housing Starts.
One traditional series that may not actually generate a recession signal is Help Wanted Advertising. It never recovered from the 2001 recession, and recovery in some form is prerequisite to being able to generate a new signal.
Again, as discussed in the opening comments, what is unfolding is a double-dip recession, where the new downturn will be the second leg of a very long and very deep structural downturn in U.S. economic activity.
While the money supply was discussed in this month's focus, the concentration was on the recession warning. Next month will concentrate on the particulars and peculiarities of the money supply series and its evolution.
The June edition of Shadow Government Statistics is scheduled for release on Wednesday, June 8, 2005. The posting of the June SGS on the website, as well as any interim alerts, will be advised immediately by e-mail.