No. 292: March Housing Starts, Industrial Production
JOHN WILLIAMS’ SHADOW GOVERNMENT STATISTICS
COMMENTARY NUMBER 292
March Housing Starts, Industrial Production
April 16, 2010
__________
Housing Still Bottom-Bouncing
Production Set to Soften
__________
PLEASE NOTE: The next regular Commentary is scheduled for Friday, April 23rd, following the release of March new orders for durable goods, with analyses also of the March PPI and home sales data.
– Best wishes to all, John Williams
Year-to-year change was a gain of 20.2% in March, following a revised annual gain of 7.3% (previously 0.2%) in February. The extreme variation in annual growth patterns is due to the collapsing and troughing of data a year ago.
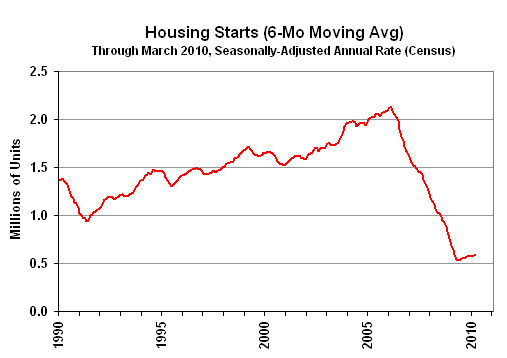
Since December 2008, housing starts have been bottom-bouncing at an historically low level, averaging a seasonally-adjusted annual rate of 565,400. In the past 16 months, all monthly readings have been within the normal range of monthly volatility for the series around that average, including March 2010’s reading of 626,000.

The "recovery" in housing is shown in the above graph. The data are smoothed using a six-month moving average to remove the extreme month-to-month volatility seen in this series. Regardless of any level of smoothing, though, in the current cycle, housing starts remain at least 25% below any levels seen since before the end of World War II. Along with the activity in the broad economy, a renewed downturn in housing appears to be in the offing.
The Federal Reserve Board reported yesterday (April 15th) that seasonally-adjusted March 2010 industrial production rose by 0.09% (0.62% net of revisions) for the month, versus a revised 0.30% (previously 0.08%) monthly gain reported for February. The year-to-year change in March rose to 3.95% from a revised February annual gain of 2.19% (was 1.66%). The spike in annual growth was due largely to the pattern of collapsing activity a year ago.
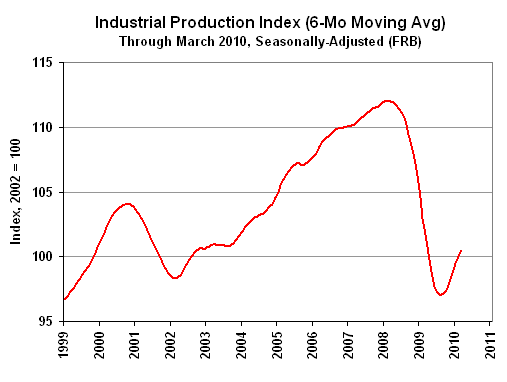
The June 2009 reading of 95.75 remained the record low for annual production growth since the shutdown of war-time production that followed World War II. For the last 15 months, the production index has averaged 98.87, around which the series has been fluctuating, with March’s six-month moving average reading at 100.50, versus 101.61 for the single month.

The "recovery" in production is shown in the above graph, where month-to-month volatility is smoothed using a six-month moving average. Production activity has leveled off at a low-level plateau of activity that effectively has wiped out the last eight years of growth in industrial production. Despite the near-term upside bump generated by short-lived stimulus and seasonal distortions, the series generally still is bottom-bouncing and should begin to soften anew, significantly, in the next several months.
Producer Price Index — PPI (March 2010). The March producer price inflation estimate is due for release on Thursday, April 22nd. Briefing.com reports a consensus expectation of a 0.5% seasonally-adjusted monthly gain. This series tends to be volatile in terms of monthly reporting, and the higher oil prices seen in March suggest some upside reporting risk to expectations. The PPI was reported down by 0.6% seasonally-adjusted month-to-month in February, with the average oil price (West Texas Intermediate) down by 2.3% in February. March oil was up by 6.3% for the month, although March’s seasonal adjustments will tend to soften the impact of higher oil prices. New Orders for Durable Goods (March 2010). Due for release on Friday, April 23rd, March durable goods orders are expected to be flat month-to-month (Briefing.com) versus a 0.5% monthly gain in February. This series also tends to be irregularly volatile month-to-month and any reported gain or loss likely will not be meaningful, although the numbers should start trending lower in the near term. Home Sales (March 2010). As discussed in Commentary No. 288, these series are heavily impacted at present by an extraordinarily high level of foreclosure activity, which seriously impairs the meaningful use of these series as indicators of regular activity in residential sales. Existing home sales are due for release on Thursday, April 22nd, and new homes sales are due for release on Friday, April 23rd. While the markets may be expecting somewhat stronger numbers on a monthly basis, the monthly change in new home sales activity likely will not be statistically significant. There may be some gains reflecting tax incentives, but watch out for a rising portion of existing home sales being reported for existing home sales.
__________