No. 800: March Industrial Production, Economic Review
COMMENTARY NUMBER 800
March Industrial Production, Economic Review
April 15, 2016
___________
Economic Activity Is Deteriorating Rapidly, Not Improving
First-Quarter 2016 Annual Contraction of 1.7% (-1.7%) in Production
Followed a 1.6% (-1.6%) Year-to-Year Drop in Fourth-Quarter 2015
That Pattern of Consecutive Annual Quarterly Declines
Never Has Been Seen Outside of a Formal Recession,
Since the Industrial Production Series Was First Published in 1919
Quarter-to-Quarter Production Tumbled by 2.2% (-2.2%) in First-Quarter,
the Fourth Quarterly Contraction in Last Five Quarters
Decades of Bad Trade Deals Have Decimated U.S. Production,
Starving U.S. Consumers of the Liquidity Needed to
Sustain Domestic and Global Economic Growth
___________
PLEASE NOTE: The next regular Commentary, scheduled for Tuesday, April 19th, will cover March Housing Starts and preview the initial reporting of first-quarter 2016 GDP.
Best wishes to all — John Williams
OPENING COMMENTS AND EXECUTIVE SUMMARY
Meaningful Contractions in First-Quarter Activity Foreshadow GDP Contractions and Market Recognition of a “New” Recession. Beyond early indications of trade-deficit deterioration in first-quarter 2016, first-quarter real retail sales showed a formal, quarterly contraction yesterday (see Commentary No. 799), while today’s detail on first-quarter 2016 industrial production showed the same, along with patterns of downturn never seen outside of official recessions. A “new” recession remains in play and should gain general recognition soon, possibly with the early estimates of first-quarter 2016 GDP, and almost certainly no later than in the wake of looming downside GDP benchmark revisions on July 29th. ShadowStats will publish its estimate of the initial first-quarter GDP number in Commentary No. 801, subsequent to the April 19th March 2016 reporting on housing starts.
The production series, however, is leading the way and has set the tone for a number of benchmark revisions still to come in the underlying economic detail, all of which will be published in advance of, and will incorporated into the GDP benchmarking. Consider Graph 1, which updates the industrial production benchmark revisions through February 2016, just published on April 1st (see Commentary No. 796-A), updated just for the additional detail released today, April 14th. All is not quite as previously represented, and that should become increasingly and painfully obvious, particularly with the looming April 30th retail sales benchmarking.
Graph 1: Benchmark-Revised/Updated Index of Aggregate Industrial Production since 2000
U.S. economic activity has entered an extremely severe structural downturn, from which there is no easy or rapid recovery, as has been discussed in earlier missives including No. 777 Year-End Special Commentary, No. 742 Special Commentary: A World Increasingly Out of Balance, 2014 Hyperinflation Report—The End Game Begins and particularly 2014 Hyperinflation Report—Great Economic Tumble. Various horrendous trade agreements and poorly-considered immigration policies—backed by numerous U.S. administrations—have had the effect of re-distributing significant U.S. productive wealth to the rest of the world. Systemic distortions resulting from this circumstance have begun to hit the U.S. and global economies hard.
The Once-Golden Goose of Sustainable U.S. and Global Economic Growth—the U.S. Consumer—Has Been Wounded by Bad Trade and Immigration Deals. Policies of establishment politicians in recent decades have favored “free trade” and open immigration, fueled by the normal interests of businesses looking to lower their costs and to increase their profits. Standard practice has evolved to include cutting manufacturing costs by shifting to cheaper labor and less-regulated business environments outside the United States, or reducing domestic labor costs with imported workers who work well below what had become traditional wages in an industry.
In the context of domestic commerce moving excessively in that direction, no one considered stabilizing broad financial circumstances for those who had lived and thrived in the pre-existing system. Seriously impaired are those who at one time had been the backbone of the extraordinary U.S. consumption machine, which drove sustainable economic growth both in the United States and globally. While the effects of the U.S. trade and immigration policies eviscerated consumer liquidity in the United States, pundits now scratch their heads trying to figure out why the U.S. economy has fallen into perpetual non-recovery and stagnation, and why the global economy has started showing a similar pattern. Simply put, the golden goose of the ever-thriving U.S. consumer has been mortally wounded, starved of liquidity and confidence and increasingly underemployed or displaced.
This same circumstance also helps explain why the U.S. electorate has turned so vehemently against establishment politicians in this presidential election year. The domestic and global economic and financial systems are broken, and the political establishment does not seem to understand fully what is happening. These issues extend to the Federal Reserve and other major central banks, who increasingly appear to lack confidence their abilities to address global economic imbalances and banking-system solvency concerns.
A Special Report on this topic will be generated soon.
Today’s Commentary (April 15th). The balance of these Opening Comments provides summary coverage of March 2016 Industrial Production.
The Hyperinflation Watch revisits the monetary conditions review of the April 1st Commentary No. 796, updated for full-March 2016 reporting. The most recent Hyperinflation Outlook Summary is found in Commentary No. 783, again with No. 777 Year-End Special Commentary as background to currently unfolding financial circumstances.
The Week Ahead section previews next Tuesday’s March 2016 Housing Starts release.
Index of Industrial Production—March 2016—An Annual Contraction Pattern Never Seen Outside of Formal Recessions. In the context of a severely-negative annual benchmark revision (see earlier Graph 1, and the April 3rd Commentary No. 796-A for specifics), headline March 2016 production reporting and related revisions confirmed an ongoing and deepening recession. The accompanying detail and graphs in this Commentary all reflect the post-benchmarking data.
The headline 0.6% (-0.6%) contraction in March 2016 monthly activity came in well below expectations for roughly a 0.1% (-0.1%) decline, and that was before downside revisions to prior activity. In terms of year-to-year growth, production contracted in first-quarter 2016 for the second consecutive quarter. Since the creation of the Federal Reserve’s Index of Industrial Production in 1919, that never has happened outside of a formal recession.
A second consecutive quarter-to-quarter contraction also was seen in first-quarter 2016, the fourth quarterly downturn in the last five quarters. Production activity began a downturn in December 2014, which remains the likely starting point for the formal recession recognition.
The aggregate production index briefly recovered its pre-2007 recession high in November 2014, turning down thereafter, with total production now down by 2.22% (-2.22%) from its December 2007 high. The manufacturing sector never recovered its pre-recession peak, and currently is down by 6.26% (-6.26%) from its December 2007 milestone.
Conditions deteriorated broadly, with monthly contractions in all three major production industry sectors of manufacturing, mining and utilities. Mining was hit hard, as usual, with collapsing coal production, oil and gas extraction and oil drilling (see Graphs 17 to 22 in the Reporting Detail section), but Manufacturing took a solid hit, as well, with reduced auto production and monthly contractions in production of consumer goods, both durable and nondurable (see Graphs 11 to 15). The contraction in Utilities was within the normal range of monthly volatility (see Graph 16).
Quarterly and Annual Production Contractions. Annual growth in aggregate production held in negative territory for the seventh straight month, down by 2.03% (-2.03%) in March 2016, locking in a second consecutive quarterly contraction on a year-to-year basis, as well as a second consecutive quarter-to-quarter contraction, the fourth such contraction of the last five quarters. Again, this type of activity never is seen outside of formal recessions.
First-quarter 2015 industrial production contracted at an annualized quarterly pace of 1.85% (-1.85%), followed by a second-quarter 2015 contraction of 2.75% (-2.75%), with a third-quarter 2015 production gain of 1.53%. That was followed by a fourth-quarter 2015 contraction of 3.26% (-3.26%), and a first-quarter 2016 annualized quarterly decline of 2.24% (-2.24%).
Year-to-year growth patterns in quarterly production continued to slow and now have declined, ranging from a positive 2.43% in first-quarter 2015, to 0.36% in second-quarter 2015, to 0.12% in third-quarter 2015, to an annual decline of 1.60% (-1.60%) in fourth-quarter 2015, and an annual contraction of 1.70% (-1.70%) in first-quarter 2016.
Headline Industrial Production—March 2016. In the context of the April 1st benchmarking (Commentary No. 796-A) and today’s downside revisions to prior history, the headline monthly decline in March 2016 was 0.60% (-0.60%), versus a revised monthly decline of 0.59% (-0.59%) in February and a revised, reduced gain of 0.52% in January. Net of prior-period revisions to the benchmarking, March 2016 monthly activity declined by 0.78% (-0.78%).
Detailed by major industry groups in Graphs 10, 11, 16 and 17 (Reporting Detail), the headline March 2016 monthly aggregate production decline of 0.60% (-0.60%) [a February decline of 0.59% (-0.59%)] was composed of a monthly March drop of 0.26% (-0.26%) [a February decline of 0.14% (-0.14%)] in manufacturing activity; a March decline of 2.90% (-2.90%) [a February decline of 0.95% (-0.95%)] in mining activity (including oil and gas production); and a March decline of 1.15% (-1.15%) [a February decline of 3.62% (-3.62%)] in utilities activity.
Year-to-year March 2016 production declined by 2.03% (-2.03%), versus a revised February 2016 annual decline of 1.76% (-1.76%), and a revised annual contraction of 1.31% (-1.31%) in January 2016.
Production Graphs—Corrected and Otherwise. The regular graphs of headline production level and annual growth detail are found in the Reporting Detail (Graphs 7 to 10), along with the drill-down graphs of major subcomponents of the production series (Graphs 11 to 22). The level of headline production showed a topping-out process late in 2014, followed by a deepening downturn into first- and second-quarter 2015. Third-quarter 2015 showed some bounce, but activity in fourth-quarter 2015 and the just-complete first-quarter 2016 turned down anew, dropping sharply into negative year-to-year growth and quarter-to-quarter growth, patterns never seen outside of what have become designated as formal recessions. Such faltering patterns of monthly, quarterly and annual decline last were seen in the depths of the economic collapse from 2007 into 2009.
Graphs 2 and 3, which follow in this section, address reporting quality issues tied just to the overstatement of headline growth that results directly from the Federal Reserve Board using too-low an estimate of inflation in deflating some components of its production estimates into real dollar terms, for inclusion in the Index of Industrial Production. Hedonic quality adjustments to the inflation estimates understate the inflation rates used in deflating those components; thus overstating the resulting inflation-adjusted growth in the headline industrial production series (see Public Comment on Inflation and Chapter 9 of 2014 Hyperinflation Report—Great Economic Tumble).
Graph 2 shows official, headline industrial production reporting, but indexed to January 2000 = 100, instead of the Fed’s formal index that is set at 2012 = 100. The 2000 indexing simply provides for some consistency in the series of revamped “corrected” graphics (including real retail sales [see Commentary No. 799], new orders for durable goods [see Commentary No. 794] and the GDP [see Commentary No. 795]); it does not affect the appearance of the graph or reported growth rates (as can be seen with a comparison to Graph 10 in the Reporting Detail section).
Graph 3 is a recast version of Graph 2, corrected for the estimated understatement of the inflation used in deflating certain components of the production index. Estimated hedonic-inflation adjustments have been backed-out of the official industrial-production deflators used for headline reporting.
This “corrected” Graph 3 shows some growth in the period subsequent to the official June 2009 trough in production activity, however, that upturn has been far shy of the full recovery and the renewed expansion reported in official GDP estimation (see Commentary No. 795, and No. 777 Year-End Special Commentary). Unlike the headline industrial production data and the headline GDP numbers, corrected production levels have not recovered pre-recession highs. Instead, corrected production entered a period of protracted low-level, but up-trending, stagnation in 2010, with irregular quarterly contractions seen through 2014, and an irregular uptrend into 2014, a topping-out in late-2014 and generally turning lower through 2015 and into first-quarter 2016.
Graph 2: Indexed Headline Level of Industrial Production (Jan 2000 = 100)
Graph 3: Headline ShadowStats-Corrected Level of Industrial Production (Jan 2000 = 100)
Where the corrected series has remained well shy of a formal recovery, both the official and corrected series suffered an outright contraction in both first- and second-quarter 2015; this is a pattern of severe economic weakness last seen during the economic collapse. Despite the brief third-quarter uptick, fourth-quarter 2015 and first-quarter 2016 industrial production saw both annual and quarterly contractions.
[The Reporting Detail section includes significant additional information and graphs.]
__________
HYPERINFLATION WATCH
MONETARY CONDITIONS REVISITED
Annual M3 Annual Growth Still Rebounded in March, along with M2 and M1. Due to the unusually early reporting of the ShadowStats Ongoing M3 Estimate in the April 1st Commentary No. 796, and the somewhat limited underlying detail at the time, a re-visitation of the headline data was promised for this Commentary. Despite the limited underlying data and limited, intervening Federal Reserve benchmark revisions, the M3 estimate is little changed. There were larger revisions to the monthly M2 and M1 estimates, also updated here.
The ShadowStats Ongoing M3 Money Supply annual growth rebounded to 3.9%, the same as in its preliminary estimate for March 2016, up from a two-year low of 3.6% in February 2016. Both M1 and M2 annual growth rallied in tandem.
Headline Details. The final estimate of the year-to-year change in the ShadowStats Ongoing M3 Money Supply Measure was 3.9% in March 2016, up from an unrevised 3.6% in February 2016 and against an unrevised 3.9% January 2016. The annual change had been in continual month-to-month slowing since the near-term revised peak growth of 5.8% (previously 5.9%) in August 2015, as seen in Graph 4. On a month-to-month basis, March 2016 M3 rose by a revised 0.6% [previously 0.7%], following an unrevised 0.4% in February.
The minor, relative weakness in annual M3 growth versus M2 still reflects the shift over time in funds from accounts included just in M3, such as large time deposits and institutional money funds, into accounts in M2. Following are final March 2016 year-to-year and month-to-month changes for the narrower M1 and M2 measures (M2 includes M1; M3 includes M2). See the Money Supply Special Report for full definitions of those measures. Again, the latest estimates of level and annual growth for March 2016 M3, M2 and M1, and for earlier periods are available on the Alternate Data tab of www.ShadowStats.com.
Graph 4: Comparative Money Supply M1, M2 and M3 Year-to-Year Changes through March2016
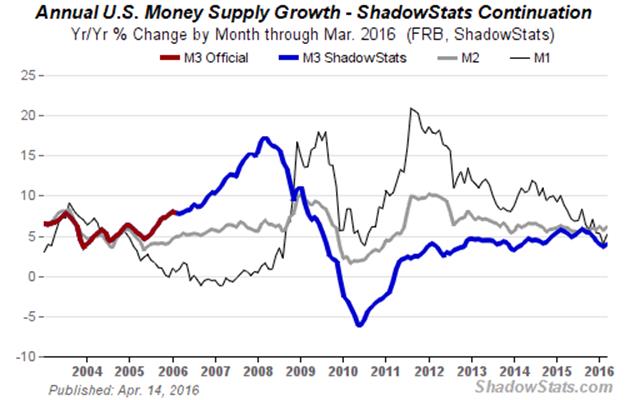
Annual M2 growth in March 2016 rose to 6.2% [previously 6.0%] from an unrevised annual gain of 5.7% in February 2016, with a revised month-to-month increase of 0.7% [previously 0.6%] in March 2016, versus an unrevised gain of 0.4% in February.
For M1, year-to-year growth rose to a 5.2% [previously estimated at 4.4%] in March 2016, up from a revised 4.0% [previously 3.9%] annual gain in February 2016, with a revised month-to-month 1.3% [previously 0.6%] increase in March 2016, versus a revised 0.3% [revised 0.4%] gain in February.
Monetary Base Still Holding Reasonably Stable, Despite Continued Fed Waffling. Following up on earlier Commentary No. 796, No. 790, No. 783, No. 779, No.779-A, and No. 784 the St. Louis Fed’s monetary base appears to have stabilized both in terms of level and annual change, in the wake of the December 2015 rate hike. Subsequently, the Fed did not raise rates as planned in March, and further “tightening” appears to be on hold indefinitely. The detail here has been updated in the accompanying graphs for data as of the two-weeks ended April 13th.
Late in 2014, the Federal Reserve ceased net new purchases of U.S. Treasury securities as part of its quantitative easing QE3, but its outright holdings of Treasury securities have remained stable at $2.5 trillion, rolling over maturing issues. Discussed in the previously-referenced Commentaries, where the monetary base during the last year had been plus-or-minus 5% around the St. Louis Fed’s estimated 12-month average of $4.0 trillion, that range was broken once, and on the downside, in the immediate post-FOMC period ended January 6th, due largely to related New York Fed activities establishing the newly boosted federal funds rate. Graphs 5 and 6 show reporting of the St. Louis Fed’s Monetary Base through the two-week period ended April 13th, with a level of $3.924 trillion, versus $3.875 trillion as of March 30th. Year-to-year growth showed a deepening decline of 5.8% (-5.8%) versus a 4.6% (-4.6%) annual contraction in the prior period. Those recent measures all are approaching the deep side of normal volatility in annual change.
Graph 5: Monetary Base Level, Bi-Weekly through April 13, 2016

Graph 6: Monetary Base, Year-to-Year Percent Change, through April 13, 2016
__________
REPORTING DETAIL
INDEX OF INDUSTRIAL PRODUCTION (March 2016)
This Never Has Been Seen Outside of a Formal Recession. In the context of a severely-negative benchmark revisions (see Graph 1 in the Opening Comments, and the April 3rd Commentary No. 796-A for specifics), the headline March 2016 production detail and related revisions confirmed an ongoing and deepening recession. The accompanying detail and graphs all reflect the new, post-benchmarking data.
The monthly 0.6% (-0.6%) contraction in March 2016 activity came in well below expectations for roughly a 0.1% (-0.1%) decline, and that was before downside revisions to prior activity. In terms of year-to-year growth, production contracted in first-quarter 2016 for the second consecutive quarter. Since the creation of the Federal Reserve’s Index of Industrial Production in 1919, that never has happened outside of a formal recession, never.
A second consecutive quarter-to-quarter contraction also was seen for first-quarter 2016, the fourth quarterly downturn in the last five quarters. Production activity turned down in December 2014, which remains the likely starting point for the formal recession recognition.
The aggregate production index briefly recovered its pre-2007 recession high in November 2014, turning down thereafter, with total production now down by 2.22% (-2.22%) from its December 2007 high. The manufacturing sector never recovered its pre-recession peak, and currently is down by 6.26% (-6.26%) from that December 2007 milestone.
Conditions continued to deteriorate broadly, with monthly contractions in the three major production industry sectors of manufacturing, mining and utilities. Mining was hit hard, as usual, with collapsing coal production, oil and gas extraction and oil drilling (see Graphs 17 to 22), but Manufacturing took a solid hit, as well, with reduced auto production and monthly contractions in the production of consumer goods, both durable and nondurable (see Graphs 11 to 15). The contraction in Utilities was within the normal range of monthly volatility (see Graph 16).
Quarterly and Annual Production Contractions. Annual growth in aggregate production held in negative territory for the seventh straight month, down by 2.03% (-2.03%) in March 2016, locking in a second consecutive quarterly contraction on a year-to-year basis, as well as a second consecutive quarter-to-quarter contraction, the fourth such contraction of the last five quarters. Again, this type of activity never is seen outside of formal recessions.
First-quarter 2015 industrial production contracted at an annualized quarterly pace of 1.85% (-1.85%), followed by a second-quarter 2015 contraction of 2.75% (-2.75%), with a third-quarter 2015 production gain of 1.53%, followed by a fourth-quarter 2015 contraction of 3.26% (-3.26%), and a first-quarter 2016 annualized quarterly decline of 2.24% (-2.24%).
Year-to-year growth patterns in quarterly production continued to slow and now have declined, ranging from a positive 2.43% in first-quarter 2015, to 0.36% in second-quarter 2015, to 0.12% in third-quarter 2015, to an annual decline of 1.60% (-1.60%) in fourth-quarter 2015, and an annual contraction of 1.70% (-1.70%) in first-quarter 2016.
Headline Industrial Production—March 2016. The Federal Reserve Board released its first estimate of seasonally-adjusted, March 2016 industrial production this morning (April 15th). In the context of the April 1st benchmark revisions discussed in Commentary No. 796-A and today’s prior-period downside revisions, the headline monthly decline in March 2016 was 0.60% (-0.60%), versus a revised monthly decline of 0.59% (-0.59%) [previously benchmarked at down 0.52% (-0.52%)] in February and a revised gain of 0.52% [previously benchmarked up by 0.64%] in January. Net of prior-period revisions to the benchmarking, March 2016 monthly activity declined by 0.78% (-0.78%).
Detailed in Graphs 10, 11, 16 and 17, by major industry groups, the headline March 2016 monthly aggregate production decline of 0.60% (-0.60%) [a February decline of 0.59% (-0.59%)] was composed of a monthly March contraction of 0.26% (-0.26%) [a February decline of 0.14% (-0.14%)] in manufacturing activity; a March decline of 2.90% (-2.90%) [a February decline of 0.95% (-0.95%)] in mining activity (including oil and gas production); and a March decline of 1.15% (-1.15%) [a February decline of 3.62% (-3.62%)] in utilities activity.
Year-to-year change in March 2016 production was a drop of 2.03% (-2.03%), versus a revised decline of 1.76% (-1.76%) [previously down by a benchmarked 1.58% (-1.58%)] in February 2016, and a revised contraction of 1.31% (-1.31%) [previously down by a benchmarked 1.19% (-1.19%)] in January 2016.
Production Graphs. The regular two sets of plots for long- and short-term industrial production levels and annual growth rates (Graphs 7 to 10) set the background for the drill-down detail graphs of various components of the aggregate industrial series (Graphs 11 to 22).
Graphs 7 and 8, and Graphs 9 and 10 show headline industrial production activity to date. Graph 7 shows the monthly year-to-year percent change in the aggregate series, in historical context since World War II. With the headline annual declines in monthly production currently hitting 2.03% (-2.03%) in March 2016, with headline annual contractions in place for the last seven months, the pattern is one never seen outside of formal recessions, post-World War II or otherwise.
Graph 8 shows the monthly level of the production index post-World War II, with a topping-out and renewed downturn—deepening quarterly contractions in first- and second-quarter 2015, with a bounce in third-quarter 2015, followed by a renewed and deeper contraction in fourth-quarter 2015 and first-quarter 2016. Such patterns of monthly and quarterly declines and stagnation were seen last in the economic collapse into 2009. Graphs 9 and 10 show the same series in greater near-term detail, beginning in January 2000.
Seen most clearly in Graph 9, the pattern of year-to-year activity dipped anew in 2013, again, to levels usually seen at the onset of recent recessions, bounced higher into mid-2014, fluctuated thereafter, now turning sharply negative, again, as seen only in formal recessions. Growth remains well off the recent relative peak for the series, which was a benchmarked 8.48% [previously 8.56%] in June 2010, going against the official June 2009 trough of the economic collapse. Indeed, as shown in Graph 7, the June 2009—the end of second-quarter 2009—year-to-year contraction of a benchmarked 15.40% (-15.40%) [previously down by 15.20% (-15.20%)] was the steepest annual decline in production since the shutdown of wartime production following World War II.
Although now-faltering official production levels had moved higher since the June 2009 trough, corrected for the understatement of inflation used in deflating portions of the industrial production index (see the Opening Comments section, Graph 3) the series has shown more of a pattern of stagnation with a slow upside trend, since 2009, with irregular quarterly contractions interspersed. The slow uptrend continued into a topping out pattern in late-2014. Headline growth—purportedly neutered of any inflation impact— contracted in both first- and second-quarter 2015, with monthly activity moving lower again, following a third-quarter increase. The “corrected” series has done the same but remains well shy of every reflecting a formal recovery.
[Graphs 7 to 10 begin on the following page]
Graph 7: Industrial Production, Year-to-Year Percent Change since 1945
Graph 8: Index of Industrial Production (Aggregate) since 1945
Graph 9: Aggregate Industrial Production, Year-to-Year Percent Change since 2000
Graph 10: Index of Aggregate Industrial Production since 2000
Graph 11: Industrial Production - Manufacturing (78.48% of the Aggregate in 2015)
Graph 12: Industrial Production - Manufacturing , Year-to-Year Percent Change Since 2000

Drilling Down into the March 2016 U.S. Industrial Production Detail. Graphs 10, 11, 16 and 17 show headline reporting of industrial production and its major components. The broad, aggregate index (Graph 10) contracted in both first- and second-quarter 2015, with a third-quarter 2015 bounce, followed by ongoing quarterly and annual contractions in fourth-quarter 2015 and now first-quarter 2016. Such circumstances simply are not seen outside of recessions, discussed in the regular reporting of headline production earlier in this section.
Again, in headline March 2016 reporting, all three major industry sectors in the production series declined month-to-month, manufacturing, utilities and mining, as reflected in Graphs 11, 16 and 17, respectively.
Graph 11 of the dominant manufacturing sector showed a month-to-month drop in March 2016 of 0.26% (-0.26%), versus a decline of 0.14% (-0.14%) in February. The series remains down by 6.26% (-6.26%) from reclaiming its pre-recession high of December 2007. Graph 12 reflects annual growth patterns in manufacturing, which have been fluttering at low levels since an initial bounce off the 2009 trough.
The story with consumer goods remains bleak, in line with troubled real retail sales (see Commentary No. 799), which remains heavily representative of conditions underlying roughly 70% of the GDP. Seen in Graphs 13 to 15, total consumer goods have remained in low-level stagnation since the economic collapse, with the only upside movement in durable goods (such as now-faltering automobile sales). The dominant, nondurables sector never recovered and continues to falter. Both the durable and nondurable sectors declined in March, with durables down for the month by 0.76% (-0.76%), having gained 0.13% in February, with nondurables down by 0.24% (-0.24%) in March, having declined by 1.06% (-1.06%) in February.
Graph 13: Consumer Goods (27.08% of the Aggregate in 2015)
Graph 14: Durable Consumer Goods (6.36% of the Aggregate in 2015)
Graph 15: Nondurable Consumer Goods (20.73% of the Aggregate in 2015)
The utilities sector (Graph 16) fell month-to-month by 1.15% (-1.15%) in March 2016, having dropped by 3.62% (-3.62%) in February 2016, usually moved by the temporary impact of “unseasonable” extremes or reversals of same in weather patterns.
Graph 16: Industrial Production - Utilities (10.76% of the Aggregate in 2015)
Graph 17: Industrial Production - Mining, Including Oil and Gas (10.76% of the Aggregate in 2015)
Mining-sector activity (Graph 17) continued its decline in March 2016, down month-to-month by 2.90% (-2.90%), which followed a 0.95% (-0.95%) monthly contraction in February. Activity here, particularly in oil and gas exploration and production (and coal production), remains the near-term focus of this analysis, where oil and gas pricing issues increasingly have taken a toll on aggregate production and broad economic activity. This sector easily recovered its pre-recession high and accounts for the full “recovery” seen in the aggregate production detail since the economic collapse. Mining production, however, has turned down sharply recently, reflecting a number of factors, including the impact of lower oil prices (and related recent, now-faltering U.S. dollar strength) and government actions to limit coal production. March 2016 mining activity was down by 12.95% (-12.95%) year-to-year.
Graph 18 reflects monthly production continuing off the near-term-trough in activity for gold and silver, irrespective of the recent pummeling given the prices of precious metals by market interventions likely orchestrated by flailing central banks. Discussed in yesterday’s Commentary No. 799 Hyperinflation Watch, however, pricing circumstances may be shifting to the upside for gold and silver, as well as for oil.
Graph 18: Mining – Gold and Silver Mining (Since 2000)
Graph 19 shows a continuing, extraordinarily sharp headline drop month-to-month coal production, which dropped by 12.17% (-12.17%) month-to-month in March 2016, and was down year-to-year by 36.14% (-36.14%)
Graph 19: Mining - Coal Mining (Since 2000)

Graph 20: Mining – U.S. Oil & Gas Extraction (Since 2000)
Graph 21: U.S. Drilling for Oil & Gas (Since 2000)
Graph 22: Mining – U.S. Drilling for Oil & Gas versus Real Oil Prices (WTI ShadowStats 1990 Base)
With oil prices moving off recent lows, oil and gas extraction remained off its all-time high, down in March 2016 by 0.74% (-0.74%) for the month, down by 4.19% (-4.19%) year-to-year, as seen in Graph 20. Exploration in terms of oil and gas drilling (Graph 21) continued to plunge, down in March 2016 by 8.45% (-8.45%) for the month, down by 55.37% (-55.37%) year-to-year. The recent collapse in drilling largely is an artefact of the massive U.S. dollar rally and oil-price plunge that began in July 2014. Those shifts appeared, at least initially, to be U.S.-orchestrated covert actions designed to stress Russia, financially, in response the circumstance in Ukraine. Shown in Graph 22, with some lag following the sharp movements in oil prices, oil and gas exploration tends to move in tandem. The oil price index used is for the West Texas Intermediate (WTI) monthly average spot price, deflated using the ShadowStats Alternate CPI measure (based on 1990 methodologies).
With the dollar having started to weaken anew, dollar-denominated oil prices also have begun to strengthen, even in a circumstance with excess supply conditions. At such time as the U.S. dollar declines meaningfully—ShadowStats is looking for a massive sell-off in the dollar in the year ahead—U.S. dollar-denominated oil prices should rally (again see Commentary No. 799 Hyperinflation Watch).
__________
WEEK AHEAD
Economic Reporting Generally Should Continue in Deterioration, Increasingly Pummeling the Dollar and Boosting Gold, Silver and Oil Prices. Market expectations for business activity should continue to deteriorate sharply, amidst intensifying, negative headline reporting in the weeks and months ahead. The broad trend in weakening expectations for business activity, and in movement towards looming recession recognition, continues, as discussed in the Opening Comments, Commentary No. 796-A, Commentary No. 795, Commentary No. 794, Commentary No. 789 and in No. 777 Year-End Special Commentary.
In response to perpetual non-recovery and a now intensifying downtrend in underlying economic activity, increasingly-negative market reactions have surfaced in trading of the U.S. dollar and in related financial markets, with upside price movements in gold, silver and oil, discussed in prior Commentary No. 799. These reactions reflect, at least in part, a growing sense of Federal Reserve impotence. Any further tightening by the Fed before the election is unlikely, but renewed quantitative easing is a fair shot.
Weaker headline reporting of the regular monthly economic numbers increasingly should be accompanied by much worse-than-expected—negative—reporting for at least the next several quarters of GDP (and GDI and GNP). That includes a developing possible outright quarterly contraction for first-quarter 2016 GDP activity on April 28th, as well as pending downside revisions to GDP history (including first-quarter 2015 and fourth-quarter 2015) in the July 29th annual benchmark revisions.
In line with recent downside revisions to industrial production and pending negative benchmark revisions to retail sales, construction, durable goods orders and trade, expectations for the GDP benchmarking also should fall sharply. That GDP benchmarking now is the most-likely point at which the elements for a “formal” recession call will be in full play.
CPI-U consumer inflation—intermittently driven lower in 2015 and early-2016 by collapsing prices for gasoline and other oil-price related commodities—likely has seen its near-term, year-to-year low. Headline March 2016 detail moved into positive headline territory , in tandem with rising gasoline prices. Inflation will rise more sharply, going forward, boosted by a weakening U.S. dollar environment, and a continued, related upturn in oil prices and other commodities. Fundamental reporting issues with the headline CPI also are discussed here: Public Commentary on Inflation Measurement.
Note on Reporting-Quality Issues and Systemic-Reporting Biases. Significant reporting-quality problems remain with most major economic series. Beyond the pre-announced gimmicked changes to reporting methodologies of the last several decades, which have tended to understate actual inflation and to overstate actual economic activity, ongoing headline reporting issues are tied largely to systemic distortions of monthly seasonal adjustments. Data instabilities—induced partially by the still-evolving economic turmoil of the last nine-to-eleven years—have been without precedent in the post-World War II era of modern-economic reporting. The severity and ongoing nature of the downturn provide particularly unstable headline economic results, when concurrent seasonal adjustments are used (as with retail sales, durable goods orders, employment and unemployment data). That has been discussed and explored in the labor-numbers related Supplemental Commentary No. 784-A and Commentary No. 695.
Further, discussed in Commentary No. 778, a heretofore unheard of spate of “processing errors” has surfaced in recent surveys of earnings (Bureau of Labor Statistics) and construction spending (Census Bureau). This is suggestive of deteriorating internal oversight and control of the U.S. government’s headline economic reporting. At the same time, it indicates an openness of the involved statistical agencies in revealing the reporting-quality issues.
Combined with ongoing allegations in the last year or two of Census Bureau falsification of data in its monthly Current Population Survey (the source for the BLS Household Survey), these issues have thrown into question the statistical-significance of the headline month-to-month reporting for many popular economic series (see Commentary No. 669).
PENDING RELEASE:
Residential Construction—Housing Starts (March 2016). The Census Bureau will release March 2016 residential construction detail on Tuesday, April 19th. In line with common-reporting experience of recent years, monthly results are likely to be unstable and not statistically meaningful, holding in a general pattern of down-trending stagnation. While consensus expectations are likely to be on the upside, as usual, they also remain well shy of statistical significance. Of fair risk is a downside surprise that could reverse February’s gains and take the series negative for first-quarter 2016.
Irrespective of the generally meaningless headline detail, the broad pattern of housing starts should remain consistent with the low-level, stagnant activity, seen in the series at present, where February 2016 current activity remained down by about 48% (-48%) from its pre-recession high. Such is particularly evident with the detail viewed in the context of a six-month moving average. This series also is subject to regular and extremely-large, prior-period revisions.
As discussed in Commentary No. 660 on the August 2014 version of this most-unstable of major monthly economic series, the monthly headline detail here simply is worthless. The series best is viewed in terms of a six-month moving average. Again, not only is month-to-month reporting volatility frequently extreme, but also those headline monthly growth rates rarely come close to being statistically significant.
__________