The Producer Price Index
Reporting Focus from the April 2006 Edition of the SGS Newsletter
Today’s Producer Price Index (PPI) is defined as measuring "average changes in prices received by domestic producers for their output." The series is published monthly, by the Bureau of Labor Statistics (BLS), based on a survey dated from the week that includes the 13th of the month. Full, official detail on the series is available from the BLS website - "Producer Price Index Overview."
As the oldest series regularly published by the BLS, the PPI has been through more severe series redefinition and methodological changes than most other series, including the Consumer Price Index (CPI). Unlike the CPI, however, the PPI is not commonly used as an inflation-adjustment mechanism in contracts or as a cost-of-living adjustment in government programs such as Social Security.
Initially published in 1902, with data back to 1891, the Wholesale Price Index (WPI) continued until 1978 as primarily a commodity price index. At that time, the series was renamed, with the term "Wholesale" being changed to "Producer," and with the index broken into subcomponents based on the level of completion of the surveyed goods: finished goods; intermediate materials, supplies and components; crude materials. Those separate series had been tracked previously, and historical data were recreated and published back through 1947.
Less drastic changes over time have included elimination of imported goods prices, which helped to erase inflation resulting from a weakening dollar. Hedonic quality adjustments also were introduced to the series, but not the geometric weighting that was applied to the CPI.
Once predominantly a measure of manufactured goods, PPI in the last decade or two increasingly has become a useless measure of the services sector "wholesale" inflation. Due to the limited scope of services surveying, those costs are heavily understated and artificially depress inflation reported for the broad finished goods index. For example, it is rare to find a PPI measure of insurance costs that represents more than 20 percent of the inflation rate seen in actual policy costs. The PPI concept lends itself as poorly and nonsensically to the services sector as the Purchasing Managers Survey concept (see comments in the February 2006 SGS "Reporting Focus" and this issue’s respective Purchasing Managers Survey sections).
On top of all survey issues, the PPI measures usually are viewed on a seasonally-adjusted basis. Instead of smoothed monthly changes, however, the resulting adjusted data tend to show a high level of random volatility in terms of month-to-month change. Viewed in terms of year-to-year change, or the annual rate of inflation, though, the series begins to show a strong leading correlation to the CPI, as evidenced in the accompanying graphs.
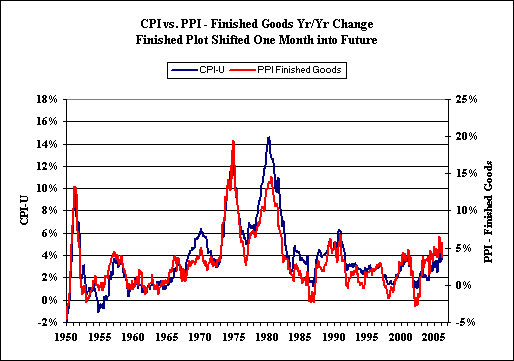

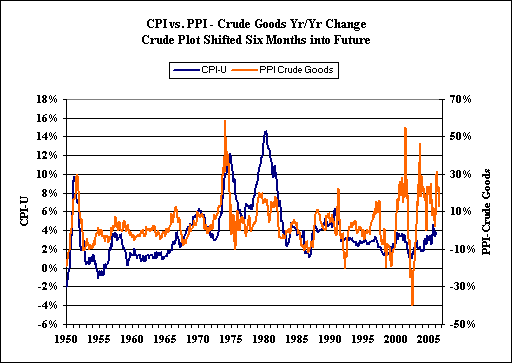
All the graphs show annual inflation by month, but the plots of the PPI stage-of-reporting components have been shifted ahead by the number of months indicated against the CPI plot, so as to show the best leading correlation between the PPI and the CPI.
Shown above, finished goods has a 93% correlation, with a one-month lead time, to the CPI; intermediate goods has a 77% correlation with a three-month lead; and crude goods has a 39% correlation with a six-month lead. As can be seen in the relative scales of change for the various PPI measures versus the CPI, the cruder the measure, the more volatile are the monthly year-to-year changes. Also, the cruder the index, the smaller the portion of the CPI it affects, and the more the PPI inflation rate is dampened in the ultimate CPI.
All three graphs, however, suggest that annual CPI inflation is headed higher in the months ahead, based on PPI annual inflation that already has been reported.
Further, given the leverage of retail markups on PPI costs, the reluctance of retailers to cut prices when crude costs decline, and the difference between surveyed goods, the CPI generally has outpaced the PPI over time.
That said, the CPI-U and PPI finished goods have an overall coincident correlation of 91%, broken out as 92% 1950 to 1980 versus 89% 1980 to date. In contrast, the SGS Standard CPI has a slightly better 91% correlation in the later 1980-to-date period (the period in which it varies from the CPI-U).