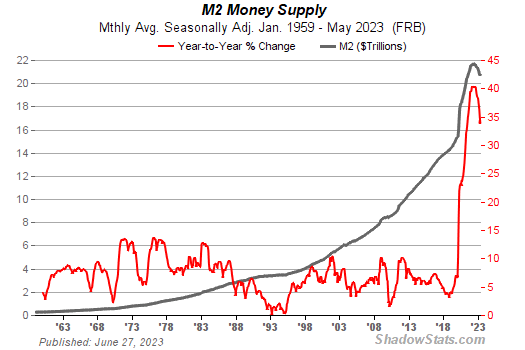
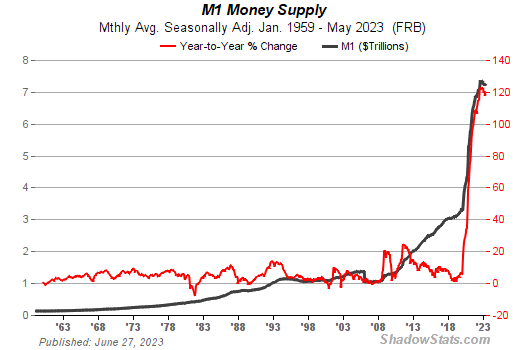
Annual Growth and Money Stock Levels Since 2006 (Scroll down for longer term charts)
 |
 |
 |
Longer Term Historical Charts (Note logarithmic scaling)
 |
 |
 |
|
||||||||
|
| ||||||||
Annual Growth and Money Stock Levels Since 2006 (Scroll down for longer term charts)
Longer Term Historical Charts (Note logarithmic scaling)
| ||||||||
This material is provided under the ShadowStats.com Terms of Use. Use of this material constitutes agreement to those terms.
Privacy Policy | Contact Us Copyright 2003-2022. Shadow Government Statistics, Walter J. Williams. | ||||||||