No. 252: General Outlook, Housing, Production and PPI
JOHN WILLIAMS’ SHADOW GOVERNMENT STATISTICS
COMMENTARY NUMBER 252
General Outlook, Housing, Production and PPI
October 20, 2009
__________
Key Indicators Continue Bottom-Bouncing
At Low-Level Plateaus of Business Activity
10 Years of Production Growth Has Evaporated,
All Post-World War II Housing Growth Is Gone
Positive Quarterly 3rd-Qtr GDP Growth
Would Not Mean Recession’s End
PPI Annual Inflation Should Turn Positive by Year-End
__________
PLEASE NOTE: The next planned Commentary is for Thursday, October 29th, following the release of the" advance" estimate of third-quarter GDP, although there will be a brief intervening update of likely GDP reporting. The Hyperinflation Special Report — 2009 Update is planned for release by the end of the first weekend in November, with a new-format full newsletter following immediately thereafter.
– Best wishes to all, John Williams
Broad Outlook Unchanged. As discussed in Commentary No. 251, the worst remains ahead for the economic and systemic-solvency crises. Economic reporting has shown no meaningful signs of business recovery, with the current depression likely to evolve into a great depression, in conjunction with the collapse of the value in the U.S. dollar and a hyperinflation. Risks are high for these crises to explode in the year ahead. The general outlook is not changed.
A full review of the economic outlook will follow with next week’s third-quarter GDP commentary. In the interim, some selling pressure has continued against the U.S. dollar, along with continued strength in oil and gold prices, generally reflective of the Federal Reserve’s ongoing efforts to debase the U.S. currency.
Rarely have market expectations (economic recovery, contained inflation, contained solvency crisis) been so far removed from underlying economic and financial-system fundamentals and reality. That circumstance leaves open the possibility of extreme, negative market reactions, with highly volatile and disorderly markets possible. Such is true particularly for U.S. equities and the U.S. dollar.
September Housing Starts Continued Bottom-Bouncing. The Census Bureau reported today (October 20th) that September housing starts rose month-to-month by a statistically-insignificant 0.5% (down by 1.3% net of revisions) +/- 12.1% (95% confidence interval). August’s starts were revised so as to show a 1.0% decline, after initially having been reported up by 1.5%. Year-to-year change was down by 28.2% in September, following a revised annual contraction of 30.5% (previously 29.6%) in August.
Annual contractions continue to moderate here and in a number of other series, due to year-ago comparisons that were against extreme annual downturns at the time. Since December 2008, housing starts have been bottom-bouncing at an historically low level, averaging a seasonally-adjusted annual rate of 553,000. September’s reading of 590,000 was within the range of normal monthly volatility.
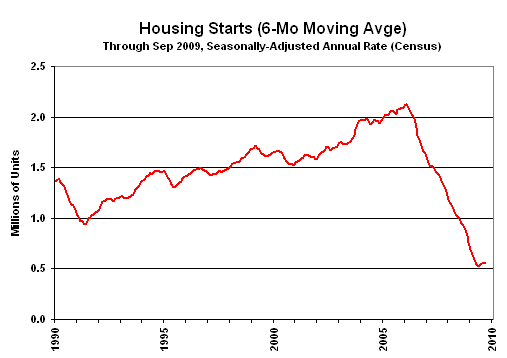
The "recovery" in housing is shown in the above graph. The data are smoothed using a six-month moving average to remove the extreme month-to-month volatility seen in this series. Regardless of any level of smoothing, though, housing starts remain well below any levels seen since the end of World War II.
As noted last month, new and existing home sales data remain very difficult to assess in terms of the implications for underlying economic activity. September reporting will continue to be warped by a large portion of activity tied to foreclosures, with an increasing number of new foreclosures reportedly hitting the market. Also, to the extent there has been any prop to housing-market activity from the first-time home buyers tax credit program, such will be gone from the numbers within the next month.
Temporary Production Growth Not Matched by Consumption. Not only was September industrial well above expectations, but it surged on top of an upside revision to August’s activity. Beyond the one-time nature of the clunkers activity, the problem for the economy is that there is no evidence of gains in consumption adequate to absorb the production. That means inventories are being built up, and the involuntary increase in inventories will help to produce the much expected quarter-to-quarter upturn in third-quarter GDP (see Week Ahead). Liquidation of those inventories will help to return the reported GDP to a quarter-to-quarter contraction in the fourth-quarter, a pattern common to prior recessions.
The Federal Reserve reported that seasonally-adjusted September industrial production rose by 0.7% (1.1% net of revisions) for the month, following a revised 1.2% (previously 0.8%) gain in August. Year-to-year contraction in September narrowed to 6.1% from a revised 10.4% (previously 10.8%) contraction in August. The June 2009 reading had set a record low for annual production growth since the shutdown of war-time production that followed World War II.
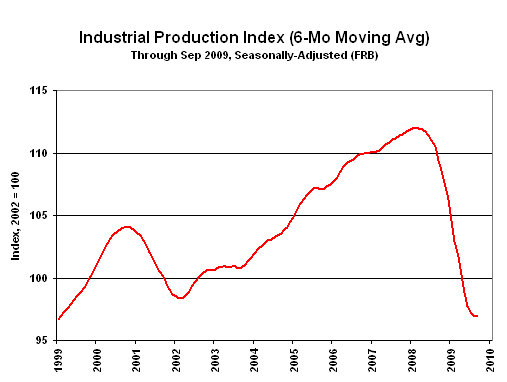
The "recovery" in production is shown in the above graph, where month-to-month volatility is smoothed using a six-month moving average. Production activity has leveled off at a low-level plateau of activity that effectively has wiped out the last 10 years of growth in industrial production. Despite the near-term gains (as will tend to become evident as inventories are worked off in the months ahead), the series generally still is bottom-bouncing.
Brief Softening of Oil Prices Contained September PPI Inflation. As reported by the Bureau of Labor Statistics (BLS) this morning (October 20th), the regularly-volatile, seasonally-adjusted producer price index (PPI) eased by 0.6% (down by 0.5% unadjusted) in September, following August’s 1.7% (1.0% unadjusted) monthly increase. September oil prices softened some, on average, with the West Texas Intermediate (WTI) spot at $69.46 per barrel, down from August’s average of $71.06. WTI is trading somewhat shy of $80 per barrel as this goes to press.
Year-to-year, the annual contraction in PPI inflation intensified slightly, with September prices down by 4.8% from the year before, versus a 4.3% annual contraction in August. Going against the pressures of collapsing oil prices in fourth-quarter 2008, year-to-year change in PPI inflation should turn positive, once again, by year-end 2009.
On a monthly basis, seasonally-adjusted September intermediate goods rose by 0.2% (up by 1.8% in August), with crude goods falling by 2.1% (up by 3.6% in August). The decline in year-to-year inflation continued to narrow, with September intermediate goods down by 11.7% (down by 12.3% in August) and September crude goods down by 31.5% (down by 35.2% in August).
Week Ahead. Given the underlying reality of a weaker economy and a more serious inflation problem than expected by the financial markets, risks generally will remain for higher-than-expected inflation and weaker-than expected economic reporting in the month ahead. Such is true especially for economic reporting net of prior-period revisions.
New Orders for Durable Goods (September 2009).Market expectations are for a small monthly gain (0.5% per Briefing.com) in September durable goods orders, due for release on October 27th (next Tuesday). Whatever the monthly change is (plus or minus) in this highly volatile series, it likely will be indistinguishable from unchanged in terms of statistical significance.
Gross Domestic Product — GDP (Advance Estimate, Third-Quarter 2009). Due for release on October 29th (a week from Thursday), third-quarter GDP is being touted as returning to near-average growth of around 3%. The Bureau of Economic Analysis (BEA) will tend to target the consensus outlook for its first guesstimate of third-quarter GDP activity, but the reporting should fall short of consensus, if indeed the consensus is that strong. Any positive quarter-to-quarter change in activity likely will reflect one-time impacts from the clunkers and the first-time homebuyers programs, and a buildup in business inventories that will face liquidation in the fourth-quarter. Accordingly, fourth-quarter quarterly GDP change likely will turn negative again. Once public consensus numbers are published, the GDP reporting assessment will be updated. As previously discussed, one-quarter of quarterly GDP gain is usual during recessions and does not necessarily signal a recession’s end, irrespective of any happy hype out of Wall Street.
__________