No. 259 General Outlook, October CPI, PPI, Production, Housing
JOHN WILLIAMS’ SHADOW GOVERNMENT STATISTICS
COMMENTARY NUMBER 259
General Outlook, October CPI, PPI, Production, Housing
November 18, 2009
__________
Annual October CPI-U Inflation -0.18% (+7.1% SGS)
Formal Deflation Has Run Its Course
Bottom-Bouncing Continued in
Real Retail Sales, Housing and Production
__________
PLEASE NOTE: The next regular Commentary is planned for Tuesday (November 24th), following release of the first revision ("second estimate") of third-quarter 2009 GDP. A quick comment also will be published subsequent to the next reporting of monetary base activity.
– Best wishes to all, John Williams
Beware of Central Bankers Jawboning for a Stronger U.S. Dollar. When the Fed Chairman starts talking about "watching" the U.S. dollar, the greenback is in serious trouble. Where the concern is dollar weakness, beyond the short-lived impact of jawboning, the Fed usually has two options for firming the dollar’s value: intervention or raising interest rates.
Intervention, usually under the direction of the U.S. Treasury, and most likely coordinated with other central banks, probably has been used covertly in the last two years as part of the process aimed at stabilizing the financial system. Dollar-supportive intervention has been noted in the last year for the central banks of Japan and Switzerland. Intervention can be used at any time, but usually it proves to be ineffective and short lived, particularly against powerful selling forces.
Raising interest rates is one of the few fundamental shifts the Fed could pursue, but such is not too likely at present, given the fragility of the economy and the financial markets.
Separately, contradicting Mr. Bernanke’s expressed concerns, the Fed has been working to debase the U.S. currency, by flooding the system with dollars. Such has been a major contributing factor to recent selling pressures against the dollar. As will be explored in some detail in the forthcoming Hyperinflation Special Report Update (2009), monetary theory works most simply in explaining inflation in a closed system, such as was seen largely with Zimbabwe. For the U.S. dollar, beyond the majority of physical currency reported in the U.S. money supply being held outside the United States, there has been a significant flow of electronic dollars to institutions outside the country. A fair portion of mortgage-backed securities now on the Fed’s balance sheet likely came off the books of banks outside the United States.
As those excess dollar’s get dumped, the dollar’s value sinks, spiking oil and other dollar-denominated commodity prices, which in turn creates a non-economic-demand-driven inflation in the United States. From a domestic U.S. inflation standpoint, the global perspective of dollars in circulation and foreign willingness to hold same are major factors.
General Outlook Unchanged. The most severe economic downturn since the onset of the Great Depression continues, as does the systemic liquidity crisis. At best, activity in key areas such as retail sales, housing and production has flattened out at extremely low levels, as discussed below. Those levels saw recent short-lived support from one-time stimulus gimmicks that have run their courses. There are no quick fixes for the economy, since the downturn is structural, tied to consumer income growth failing to keep up with inflation. The traditional offset to weak income issues in recent years has been encouragement of consumer debt expansion. Such debt expansion, however, is not available at present, at least not in quantities that would support an expanding economy.
The Fed has continued in panic mode, spiking the monetary base at annualized pace not seen since the "worst" of the crisis a year ago. Such detail will be updated following the monetary-base reporting Thursday (November 19th). At the same time, broad money supply is contracting at a pace that even in the best of times would promise a recession in the months ahead.
The broad outlook remains unchanged. I cannot remember stock market prices ever being so far removed from reflecting underlying economic and financial-system reality. Irrespective of near-term market gyrations, the long-term outlook remains extremely bearish for U.S. equities and the U.S. dollar, and extremely bullish for gold and silver. The economy still faces an eventual hyperinflationary great depression, with high risk of that circumstance beginning to unfold in the year ahead.
Also as a result of the financial markets being removed from reality, surprises in economic reporting should tend to continue on the downside, as seen this week in industrial production and housing (retail sales would have been weaker but for downside revisions to prior-period reporting), while inflation will tend to surprise on the upside, as seen in the CPI reporting.
Notes on Different Measures of the Consumer Price Index.
The Consumer Price Index (CPI) is the broadest inflation measure published by U.S. Government, through the Bureau of Labor Statistics (BLS), Department of Labor:
The CPI-U (Consumer Price Index for All Urban Consumers) is the monthly headline inflation number (seasonally adjusted) and is the broadest in its coverage, representing the buying patterns of all urban consumers. Its standard measure is not seasonally adjusted, and it never is revised on that basis except for outright errors,
The CPI-W (CPI for Urban Wage Earners and Clerical Workers) covers the more-narrow universe of urban wage earners and clerical workers and is used in determining cost of living adjustments in government programs such as Social Security. Otherwise its background is the same as the CPI-U.
The C-CPI-U (Chain-Weighted CPI-U) is an experimental measure, where the weighting of components is fully substitution based. It generally shows lower annual inflation rate than the CPI-U and CPI-W. The latter two measures once had fixed weightings—so as to measure the cost of living of maintaining a constant standard of living—but now are quasi-substitution-based. Since it is fully substitution based, the series tends to reflect lower inflation than the other CPI measures. Accordingly, the C-CPI-U is the "new inflation" measure being proffered by Congress and the White House as a tool for reducing Social Security cost-of-living adjustments by stealth. Moving to accommodate the Congress, the BLS announced pending changes to the C-CPI-U estimation and reporting process on October 22, 2014, which are described in Commentary No. 668
The ShadowStats Alternative CPI-U measures are attempts at adjusting reported CPI-U inflation for the impact of methodological change of recent decades designed to move the concept of the CPI away from being a measure of the cost of living needed to maintain a constant standard of living.
Deflation is Over: October Annual Inflation Statistically Indistinguishable from Zero. Though still shy of the peak levels seen last year, oil and gasoline prices have soared since their near-term lows at the end of last year. The relative collapse then in gasoline and oil prices triggered a period of year-to-year decline — formal deflation — in the CPI-U. Now with relatively high prices going against falling prices in year-ago comparisons, annual CPI inflation will turn positive, again, as of November. As reported by the BLS, annual CPI-U inflation for October was not statistically distinguishable from zero.
CPI-U. The BLS reported this morning (November 18th) that the seasonally-adjusted October CPI-U rose by 0.28% (up by 0.10% unadjusted) +/- 0.12% (95% confidence interval not seasonally adjusted) for the month, after rising by 0.17% (up by 0.06% unadjusted) in September. Seasonally-adjusted, the annualized rate of inflation for the three months ended October was 3.62%, versus 2.51% for the three months ended September.
Unadjusted, year-to-year inflation was far less negative (though still formal deflation), down by a statistically insignificant 0.18% +/- 0.20% (95% confidence interval) in October, versus a 1.29% annual contraction in September. With the negative annual inflation having bottomed in July, year-to-year inflation should turn positive in November. Annual CPI-U inflation could break above the positive two-to-three percent range by year-end.
Recent annual declines in CPI-U inflation have been the biggest since 1950. I estimate, however, that CPI reporting methods used in 1950 would have generated current inflation rates that did not drop below 5%, at worst, in the current cycle (see Alternative Consumer Inflation Measures below). The brief and shallow formal deflation that now is at an end — based on official CPI-U reporting — appears to have been about half the depth and half the length of the negative inflation bout in the 1950 circumstance.
Annual inflation would increase or decrease in November 2009 reporting, dependent on the seasonally-adjusted monthly change, versus the 1.67% adjusted monthly decline seen in November 2008. I use the adjusted change here, since that is how consensus expectations are expressed. The difference in growth would directly add to or subtract from October’s annual inflation rate of negative 0.18%.
For those interested in exploring the various facets of official CPI-U reporting, I continue to refer you to CPIwatch.com, a site prepared by one of my SGS colleagues.
CPI-W. The BLS reported that the narrower, seasonally-adjusted October CPI-W rose by 0.33% (up by 0.11% unadjusted), following an increase of 0.18% (up by 0.08% unadjusted) in September. Year-to-year, CPI-W inflation declined by 0.30% in October, following a 1.68% drop in September. As with the CPI-U, annual inflation in the CPI-W should turn positive in November’s reporting.
C-CPI-U. Year-to-year or annual inflation for the Chain-Weighted CPI-U — the fully substitution-based series that gets touted by CPI opponents and inflation apologists as the replacement for the CPI-U — fell by 0.46% in September, versus a 1.37% drop in September. The deeper decline in the C-CPI-U annual inflation rate versus the CPI-U is the normal relationship for the two series, but even here, annual inflation should turn positive next month.
Alternative Consumer Inflation Measures. Adjusted to pre-Clinton (1990) methodology, annual CPI growth rose to 3.2% in October, versus 2.1% in September, while the SGS-Alternate Consumer Inflation Measure, which reverses gimmicked changes to official CPI reporting methodologies back to 1980, rose to about 7.1% (7.13% for those using the extra digit) in October, versus 6.1% in September.
The SGS-Alternate Consumer Inflation Measure adjusts on an additive basis for the cumulative impact on the annual inflation rate of various methodological changes made by the BLS. Over the decades, the BLS has altered the meaning of the CPI from being a measure of the cost of living needed to maintain a constant standard of living, to something that no longer reflects the constant-standard-of-living concept. Roughly five percentage points of the additive SGS adjustment reflect the BLS’s formal estimate of the impact of methodological changes; roughly two percentage points reflect changes by the BLS, where SGS has estimated the impact, not otherwise published by the BLS.
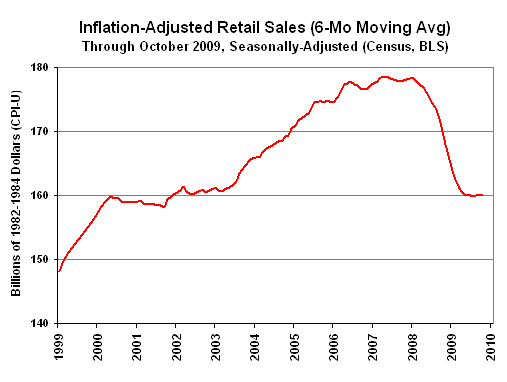
Real Retail Sales. Based on October CPI-U reporting, inflation- and seasonally-adjusted October retail sales rose by 1.1% (by 0.6% net of revisions), where the current number is up 1.4% before inflation adjustment. In contrast, real retail sales fell in September by a revised 2.2% (previously down 1.5%) that now is down by 2.3% before inflation adjustment. Year-to-year, October real retail sales fell by 1.5% (down by 1.7% before inflation adjustment), while September real retail sales fell by 5.1% (down 6.3% before inflation adjustment).
For the last 11 months, monthly real retail sales (CPI-U deflated) have been fluctuating around an average of $160.1 billion. Real sales levels ($ billions) for the past six months were: October 160.6, September 158.9, August (clunkers) 162.4, July 159.7, June 159.9, May 159.7. Smoothed for monthly volatility on a six-month moving-average basis, as shown in the accompanying graph, the pattern of activity here has shifted to bottom bouncing in terms of the level of inflation-adjusted sales. Again, there is no turnaround in economic activity — no recovery — evident here, just bottom-bouncing.

Annual PPI Inflation Should Turn Positive in November. As reported by the Bureau of Labor Statistics (BLS) yesterday (November 17th), the regularly-volatile, seasonally-adjusted producer price index (PPI) rose by 0.3% (up 0.4% unadjusted) in October, following September’s 0.6% (0.5% unadjusted) monthly decline.
Year-to-year, the annual contraction in PPI inflation narrowed sharply, with October prices down by 1.9% from the year before, versus a 4.8% annual contraction in September. Going against the pressures of collapsing oil prices in fourth-quarter 2008, year-to-year change in PPI inflation should turn positive, once again, with next month’s (November) reporting.
On a monthly basis, seasonally-adjusted October intermediate goods rose by 0.3% (up by 0.2% in September), with crude goods jumping by 5.4% (down by 2.1% in September). The decline in year-to-year inflation continued to narrow, with October intermediate goods down by 7.5% (down by 11.7% in September) and October crude goods down by 14.1% (down by 31.5% in September).
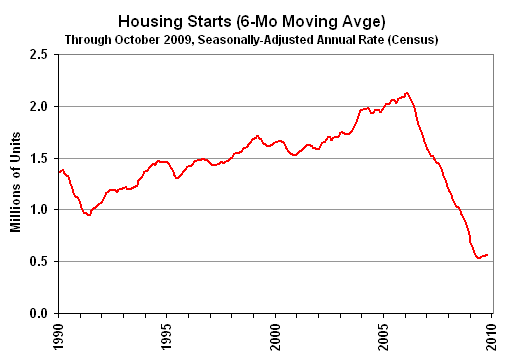
Weak October Housing Starts Continued Bottom-Bouncing. The Census Bureau reported today (November 18th) that October housing starts fell month-to-month by a statistically-significant 10.6% (down by 10.3% net of revisions) +/- 10.2% (95% confidence interval). September’s starts were revised so as to show a 1.9% gain, after initially having been reported up by 0.5%. Year-to-year change was down by 30.7% in October, following a revised annual contraction of 28.0% (previously 28.2%) in September.
Since December 2008, housing starts have been bottom-bouncing at an historically low level, averaging a seasonally-adjusted annual rate of 550,400. In the past 11 months, all monthly readings have been within the normal range of monthly volatility for the series around that average, including October’s reading of 529,000, which was down from 592,000 in September. The higher level in September reflected the now-expired first-time home buyers tax credit program.

The "recovery" in housing is shown in the above graph. The data are smoothed using a six-month moving average to remove the extreme month-to-month volatility seen in this series. Regardless of any level of smoothing, though, housing starts remain well below any levels seen since the end of World War II.
Industrial Production Slowed, Except for Utility Usage. Month-to-month October production fell by 0.1% in manufacturing, by 0.2% in mining (including oil and natural gas production), but utility usage jumped by 1.6%, increasing the overall index of industrial production by 0.1%. The clunkers-related production jump seen in September was not repeated, but the elevated level of September production largely held. Large swings in reported utility usage often impact reported manufacturing production, as electricity consumption is used as a surrogate for measuring production of a number of goods. Production should back off sharply in the months ahead as the irregular volatility in utilities (often tied to unusual weather) reverses, and as inventory build-up wanes in the light of continued weakness in inflation-adjusted retail sales.
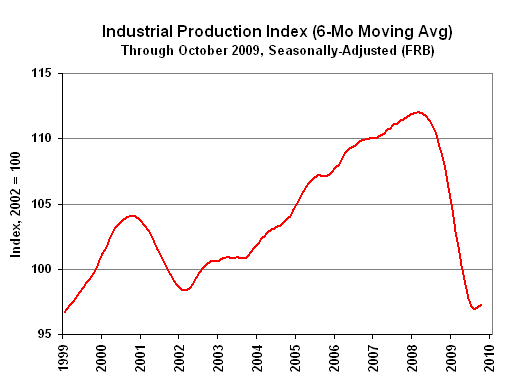
The Federal Reserve reported that seasonally-adjusted October industrial production rose by 0.05% for the month to a level of 98.63, following a revised 0.64% (previously 0.7%) gain in September. Year-to-year contraction in October widened to 7.10% from a revised 6.0% (previously 6.1%) contraction in September. The June 2009 reading of 95.78 had set a record low for annual production growth since the shutdown of war-time production that followed World War II. For the last nine months, the production index has averaged 97.6, around which the series has been fluctuating.

The "recovery" in production is shown in the above graph, where month-to-month volatility is smoothed using a six-month moving average. Production activity has leveled off at a low-level plateau of activity that effectively has wiped out the last 10 years of growth in industrial production. Despite the near-term upside blip from short-lived stimulus impact, the series generally still is bottom-bouncing.
Week Ahead. Given the underlying reality of a weaker economy and a more serious inflation problem than generally is expected by the financial markets, risks to reporting will favor higher-than-expected inflation and weaker-than-expected economic reporting in the month ahead. Such is true especially for economic reporting net of prior-period revisions.
Gross Domestic Product (GDP) (Third-Quarter 2009 — Second Estimate). Due for release on Tuesday, November 24th, the first revision to third-quarter GDP could be a negative one, as discussed in Commentary No. 258, due to new data on the trade deficit and retail sales. Yesterday’s reporting on October industrial production, however, showed a slight upside revision to third-quarter activity, which could provide some offset to the other factors. Nonetheless, my betting still would be for some downside revision to the initial estimate of 3.5% annualized, inflation-adjusted, quarter-to-quarter growth.
__________