No. 280: January CPI, PPI, Housing Starts, Production
JOHN WILLIAMS’ SHADOW GOVERNMENT STATISTICS
COMMENTARY NUMBER 280
January CPI, PPI, Housing Starts, Production
February 19, 2010
__________
Annual Inflation 2.6% (CPI-U), 3.3% (CPI-W), 9.8% (SGS)
Quarterly Inflation Shifted from Fourth- to Second-Quarter 2009
Economy Keeps Bottom-Bouncing as
Intensified Contraction Nears
__________
PLEASE NOTE: Due to the time consumed in reviewing the various CPI revisions, today, a special Commentary reviewing current conditions is planned for Tuesday, February 23rd. The next regular Commentary is scheduled for Friday, February 26th, following the release of the second estimate (first revision) of fourth-quarter GDP. The Treasury’s 2009 GAAP-based financial statements for the U.S. government also are scheduled for release on the 26th, and a special Commentary will follow, likely over the weekend.
– Best wishes to all, John Williams
Thank Goodness for Seasonal Factors. The January CPI report showed unusually large shifts in revised seasonal inflation patterns for 2009, with late-year inflation being redistributed to earlier months. Such could affect GDP reporting (upping more recent quarterly growth rates), and it resulted in more-than-the-normal upside blip in the real (inflation-adjusted) retail sales graph shown later. Those revisions make a strong case for concentrating on the unadjusted data, best viewed in terms of year-to-year change. Until recently, the Bureau of Labor Statistics (BLS) emphasized the unadjusted data, which never are revised, shy of an outright calculation error. Going forward, however, expenditure weightings in the CPI series now get revised every two years, as happened with the January reporting. Those revisions once took place every 10 years. The shift to greater frequency has been part of the movement to make the CPI a substitution-based measure, one that no longer reflects the cost of living needed to maintain a constant standard of living.
Notes on Different Measures of the Consumer Price Index.
The Consumer Price Index (CPI) is the broadest inflation measure published by U.S. Government, through the Bureau of Labor Statistics (BLS), Department of Labor:
The CPI-U (Consumer Price Index for All Urban Consumers) is the monthly headline inflation number (seasonally adjusted) and is the broadest in its coverage, representing the buying patterns of all urban consumers. Its standard measure is not seasonally adjusted, and it never is revised on that basis except for outright errors,
The CPI-W (CPI for Urban Wage Earners and Clerical Workers) covers the more-narrow universe of urban wage earners and clerical workers and is used in determining cost of living adjustments in government programs such as Social Security. Otherwise its background is the same as the CPI-U.
The C-CPI-U (Chain-Weighted CPI-U) is an experimental measure, where the weighting of components is fully substitution based. It generally shows lower annual inflation rate than the CPI-U and CPI-W. The latter two measures once had fixed weightings—so as to measure the cost of living of maintaining a constant standard of living—but now are quasi-substitution-based. Since it is fully substitution based, the series tends to reflect lower inflation than the other CPI measures. Accordingly, the C-CPI-U is the "new inflation" measure being proffered by Congress and the White House as a tool for reducing Social Security cost-of-living adjustments by stealth. Moving to accommodate the Congress, the BLS announced pending changes to the C-CPI-U estimation and reporting process on October 22, 2014, which are described in Commentary No. 668
The ShadowStats Alternative CPI-U measures are attempts at adjusting reported CPI-U inflation for the impact of methodological change of recent decades designed to move the concept of the CPI away from being a measure of the cost of living needed to maintain a constant standard of living.
In addition to recasting expenditure weightings for January 2010 forward, revisions to the CPI-U included an unusually sharp recasting of seasonal-adjustment patterns back through 2005, which threw significant fourth-quarter 2009 inflation back into the second-quarter. The historical not-seasonally-adjusted data were not affected. What had been annualized CPI-U inflation of 3.44% in fourth-quarter 2009 now stands at 2.62%, while second-quarter 2009 inflation of 1.33% now stands at 1.86%. The third-quarter 2009 (3.60% changed to 3.69%) and first-quarter 2009 (changed from -2.37% to -2.24%) revisions were minimal. These changes impact the patterns of recent real retail sales activity (see below), and while these changes could be used to increase reported growth in inflation-adjusted fourth-quarter GDP (weaker inflation means stronger inflation-adjusted growth), such revamping usually would be done in the upcoming July 2010 annual GDP revisions, not in the monthly revision due next week.
Seasonally-adjusted, the CPI-U annualized rate of inflation for the three months ended January 2010 (January versus October) was 2.29%, against December’s 2.45% (revised from 3.28%).
Unadjusted, January’s year-to-year inflation was 2.63% +/- 0.20% (95% confidence interval) against a 2.72% annual increase in December.
Year-to-year inflation would increase or decrease in February 2010 reporting, dependent on the seasonally-adjusted monthly change, versus the 0.43% adjusted monthly gain seen in February 2009. I use the adjusted change here, since that is how consensus expectations are expressed. To approximate the annual inflation rate for February 2010, the difference in February’s headline monthly change versus the year-ago monthly change should be added to or subtracted directly from January 2010’s annual inflation rate of 2.63%.
CPI-W. Revised in tandem with the CPI-U, the narrower, seasonally-adjusted January CPI-W rose by 0.34% (up by 0.41% unadjusted), following an increase of 0.24% (revised from 0.16%, and down by 0.14% unadjusted) in December. Seasonally-adjusted, the annualized rate of CPI-W inflation for the three months ended January (January versus October) was 3.32%, versus a revised 3.00% (was 4.18%) for December. The seasonally-adjusted annualized quarter-to-quarter inflation was revised to 3.25% from 4.22% in the fourth-quarter versus a revised 4.05% (previously 4.55%) in the third.
Year-to-year CPI-W inflation rose by 3.34% in January, following a 3.36% increase in December.
C-CPI-U. The Chain-Weighted CPI-U — the fully substitution-based series that gets touted by CPI opponents and inflation apologists as the replacement for the CPI-U — underwent massive revisions, including series reweightings. The series, which is reported only on an unadjusted basis, now shows higher annual inflation than had been previously reported. Where recent C-CPI-U inflation now is higher than the CPI-U, in revision, and where the C-CPI-U purportedly should be showing weaker inflation, these mounting inconsistencies suggest reporting difficulties with the CPI series.
Year-to-year or annual inflation was 2.84% in January 2010, versus revised 2.98% annual growth (previously 2.76%) in December. In revision, the average C-CPI-U for 2009 versus 2008 moved to flat (down by 0.06%) from a preliminary contraction of 0.52%, compared with an upwardly revised 3.73% annual inflation rate (previously 3.37%) in 2008 versus 2007.
Alternative Consumer Inflation Measures. Adjusted to pre-Clinton (1990) methodology, annual CPI eased to roughly 6.0% growth in January from to 6.1% in December, while the SGS-Alternate Consumer Inflation Measure, which reverses gimmicked changes to official CPI reporting methodologies back to 1980, rose to about 9.8% (9.76% for those using the extra digit) in January, versus 9.7% in December.
The SGS-Alternate Consumer Inflation Measure adjusts on an additive basis for the cumulative impact on the annual inflation rate of various methodological changes made by the BLS. Over the decades, the BLS has altered the meaning of the CPI from being a measure of the cost of living needed to maintain a constant standard of living, to something that no longer reflects the constant-standard-of-living concept. Roughly five percentage points of the additive SGS adjustment reflect the BLS’s formal estimate of the impact of methodological changes; roughly two percentage points reflect changes by the BLS, where SGS has estimated the impact not otherwise published by the BLS.
Gold and Silver Highs Adjusted for CPI-U/SGS Inflation. Even with the December 2, 2009 historic high gold price of $1,212.50 per troy ounce, the prior all-time high of $850.00 (London afternoon fix, per Kitco.com) of January 21, 1980 has not been hit in terms of inflation-adjusted dollars. Based on inflation through January 2010, the 1980 gold price peak would be $2,367 per troy ounce, based on not-seasonally-adjusted-CPI-adjusted dollars, and would be $7,378 per troy ounce in terms of SGS-Alternate-CPI-adjusted dollars.
In like manner, the all-time high price for silver in January 1980 of $49.45 per troy ounce (London afternoon fix, per silverinstitute.org) has not been hit since, including in terms of inflation-adjusted dollars. Based on inflation through January 2010, the 1980 silver price peak would be $138 per troy ounce, based on not-seasonally-adjusted-CPI-adjusted dollars, and would be $429 per troy ounce in terms of SGS-Alternate-CPI-adjusted dollars.
For the last 14 months, monthly real retail sales (CPI-U deflated) have been fluctuating around an average of $160.7 billion (the deflated January number was $163.5). Smoothed for monthly volatility on a six-month moving-average basis, as shown in the accompanying graph, the pattern of activity here has shifted to bottom-bouncing in terms of the level of inflation-adjusted sales. The revamped seasonal patterns in CPI reporting have given the plot a late upside bounce, in conjunction with some serious late-year seasonal factor distortions. There remains no fundamental turnaround in economic activity — no recovery — evident here, just bottom-bouncing, as should be confirmed in the next several months’ reporting On a monthly basis, seasonally-adjusted January intermediate goods rose by 1.7% (up by a revised 0.6%, previously 0.5%, in December), with crude goods jumping by 9.6% (up by a revised 0.8%, previously 1.0%, in December). Year-to-year inflation continued to rise, with January intermediate goods up by 4.6% (up by 3.0% in December) and January crude goods up by 25.2% (up by 12.3% in December). Industrial Production Jumped with Auto Production. The Federal Reserve reported on February 17th that seasonally-adjusted January industrial production rose by 0.93% for the month, following a 0.66% (previously a 0.64%) gain in December. The year-to-year change as of January moved to a positive 0.94% from a revised 2.20% (previously 2.01%) contraction in December. The June 2009 reading of 95.75 remained the record low for annual production growth since the shutdown of war-time production that followed World War II. For the last 12 months, the production index has averaged 98.3, around which the series has been fluctuating, with January’s six-month moving average reading at 99.4, versus 101.1 for the single month. A gain in automobile production was a major contributor to January’s industrial production surge, but auto sales contracted per January retail sales reporting. Strong production that is unresponsive to weak sales tends to lead to inventory build-up and subsequent inventory liquidation. A significant weakening in auto sales is likely in the next several months, as the economy enters its double- or multiple-dip downturn. The "recovery" in production is shown in the above graph, where month-to-month volatility is smoothed using a six-month moving average. Production activity has leveled off at a low-level plateau of activity that effectively has wiped out the last 10 years of growth in industrial production. Despite the near-term upside bump generated by short-lived stimulus impact and unusual weather, the series generally still is bottom-bouncing and should soften significantly in the next several months. January Housing Starts Continued Bottom-Bouncing. The Census Bureau reported on February 17th that January housing starts rose month-to-month by a statistically-insignificant 2.8% (up by 6.1% net of revisions) +/- 13.7% (95% confidence interval). December’s starts were revised so as to show a 0.7% decline, narrowed from an initial estimate of a 4.0% drop. Year-to-year change was up by 21.1% in January, following a revised annual gain of 3.4% (previously 0.2%) in December. Since December 2008, housing starts have been bottom-bouncing at an historically low level, averaging a seasonally-adjusted annual rate of 556,300. In the past 14 months, all monthly readings have been within the normal range of monthly volatility for the series around that average, including January’s reading of 591,000, which effectively was at the same levels seen in June (590,000) and July (593,000) of 2009. The "recovery" in housing is shown in the above graph. The data are smoothed using a six-month moving average to remove the extreme month-to-month volatility seen in this series. Regardless of any level of smoothing, though, in the current cycle, housing starts remain at least 25% below any levels seen since the end of World War II. Week Ahead. Given the underlying reality of a weaker economy (and likely re-intensifying downturn in the coming months) and more serious inflation problems than generally are expected by the financial markets, risks to reporting will tend towards higher-than-expected inflation and weaker-than-expected economic reporting in the months ahead. Such is true especially for economic reporting net of prior-period revisions. New Orders for Durable Goods (January 2010). The January durable goods orders, due for release on Thursday, February 25th, likely will continue bottom bouncing, with month-to-month change remaining within the range of normal, random volatility. Gross Domestic Product — GDP (Fourth-Quarter 2009, Second Estimate). Due for release on Friday, February 26th, the consensus forecast per Briefing.com for fourth-quarter 2009 GDP revised real quarterly growth is 5.6%, versus the initial 5.7% estimate. By itself, the December trade deficit — adjusted for inflation — was enough worse than Bureau of Economic Analysis initial assumptions to knock 1.1% off the quarterly GDP growth estimate. There likely will be other offsetting revisions, but the reporting risk is high of a more-negative aggregate revision than commonly is expected. GAAP-Based Financial Statements of the U.S. Government (2009). The Treasury’s GAAP financial statements appear set for release on Friday, February 26th, with the Treasury now posting that release date on its Web site. The time of day has not been posted. The statements were delayed, without explanation, from the regularly scheduled release date of December 15, 2009 to mid February, and then again due to weather disruptions. A Reporting Focus Commentary will follow after I have had a chance to assess the report. A table of what I expect in the summary reporting is available in the Hyperinflation Special Report.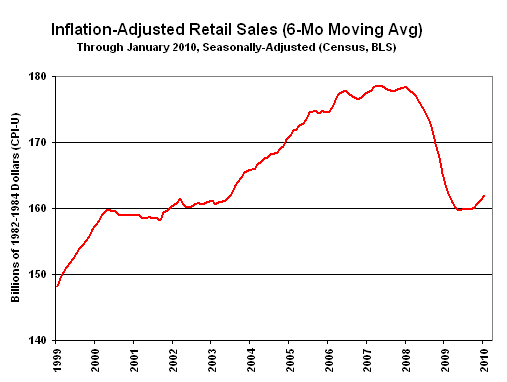


__________