No. 284: February Employment and Unemployment
JOHN WILLIAMS’ SHADOW GOVERNMENT STATISTICS
COMMENTARY NUMBER 284
February Employment and Unemployment
March 5, 2010
__________
Payroll Drop of 36,000 was 51,000 Net of Census Hiring
Broader February Unemployment Measures Rose:
U.6 at 16.8% (up 0.3%), SGS at 21.6% (up 0.4%)
Economy Remains Headed into Deepening Downturn
__________
PLEASE NOTE: The next regular Commentary is scheduled for Friday, March 12th, following the release of the February retail sales report.
– Best wishes to all, John Williams
Data Distortions Still Playing Out. With an unchanged unemployment rate and a near-consensus payroll number reported this morning (March 5th) by the Bureau of Labor Statistics (BLS), I certainly misread the nature of Larry Summers’ employment comments, as discussed in yesterday’s Commentary No. 283. Historically, at least with earlier administrations, it has been unusual for individuals in positions such as Mr. Summers’ to offer comments on employment in the week before a pending release, without having a specific political or market-related purpose.
Distortions to economic reporting — in seasonal factors and in other methodologies not designed to handle a protracted and severe economic downturn — appear to be continuing. Where seasonals have warped the U.3 unemployment rate reporting (non-headline U.6 components seem less affected), such should reverse out shortly (next month or so), as the factors face eventual catch-up. The issues for the payroll data — aside from monthly swings of less than 129,000 jobs being statistically not meaningful — remain with the continued upside biases created in monthly reporting by the birth-death model, discussed below.
As economic activity shows renewed or intensified downside movement in the months ahead, the unemployment rate should rise and payroll declines should intensify (net of short-lived census hiring), regardless of the reporting distortions.
Payroll Survey. The BLS reported a statistically-insignificant, seasonally-adjusted jobs loss of 36,000 (down by 1,000 net of revisions) +/- 129,000 (95% confidence interval) for February 2010, following a revised 26,000 (previously 20,000) jobs loss in January. With the 2010 federal census nearing, temporary hiring in that area has begun to pick-up, with 15,000 reported for February, versus a 9,000 gain in January. Accordingly, net of the temporary census-related spike, seasonally-adjusted February payrolls declined by 51,000. The census hiring will become a major factor boosting relative payroll levels in the next several months.
The BLS also announced an unusual correction to April to July 2009 data, revamping estimates as to how many people had been hired by the federal government in preparation for the census. Payrolls for April 2009 were upped by 54,000, in the largest monthly revision. The complexity of the federal government accurately counting its employees pales in comparison to the issues involved for counting those employed in the private sector.
From peak-to-trough (the peak month was December 2007; the current month of February 2010 is the short-lived trough of the current cycle), payroll employment has declined by a seasonally-adjusted 8,425,000 jobs, or 6.1%.
As the pace of reported monthly decline has continued to slow sharply against year-ago comparisons, year-to-year contraction (unadjusted) in total nonfarm payrolls narrowed to 2.5% in February from an unrevised 3.0% in January, and from a post-World War II record 5.0% decline in July. The July 2009 decline was the most severe annual contraction seen since the production shutdown at the end of World War II, which reflected a trough of a 7.6% contraction in September 1945. Disallowing the post-war shutdown as a normal business cycle, the current annual decline would be the worst since the Great Depression.

Concurrent Seasonal Factor Bias (CSFB). The pattern of impossible biases built into the headline monthly payroll employment of recent years appears to have ended, and, accordingly, I am ceasing reporting on it, unless it becomes a major factor again either in terms of upside or downside biases built into the payroll survey.
Birth-Death/Bias Factor Adjustment. As discussed in previous writings, the Birth-Death Model biases tend to overstate payroll employment levels — to understate employment declines — during recessions. The flaws were confirmed last month by the nature of BLS’s massive benchmark revision, where the BLS had indicated that the underlying assumptions to the Birth-Death Model were missing certain jobs losses.
Although the upside bias is scaled down some from last year, the Birth-Death Model survives and remains a major distorting factor in monthly payroll reporting. Such the misreporting, however, will not be adjusted at all until the next benchmark revision in February 2011, following the November 2010 elections.
The unsupportable premise that jobs created by start-up companies in this downturn have more than offset jobs lost by companies going out of business, continues. So, if a company fails to report its payrolls because it has gone out of business, the BLS assumes it still has its previously-reported employees and adjusts those numbers for the trend in the company’s industry. The "surplus" jobs created by start-up firms, which get added on to the payroll estimates each month as a special add-factor, have been revised lower, which is the only portion of the model that has been scaled back, averaging at present roughly an extra 50,000 seasonally-adjusted jobs per month. This monthly bias should be negative, on average. Since it is not, the BLS continues regularly to overestimate monthly growth in payroll employment.
That said, the unadjusted February 2010 bias was a monthly addition of 97,000 jobs, versus a pre-benchmark addition of 134,000 jobs in February 2009, and against a subtraction of 427,000 in January 2010 (January is the one month of big subtraction on an unadjusted basis).
Household Survey. The usually statistically-sounder household survey, which counts the number of people with jobs, as opposed to the payroll survey that counts the number of jobs (including multiple job holders), showed a monthly employment gain in February of 308,000, versus an estimated January-over-December gain of 784,000 gain.
The February 2010 seasonally-adjusted U.3 unemployment of 9.69% +/- 0.23% (95% confidence interval) was unchanged from the January estimate of 9.69%. Unadjusted U.3 was reported at 10.4% in February, down from 10.6% in January. Distorted seasonal factors appear to be an ongoing issue, but that should be resolved in the next month or so, as a seasonal factor catch-up reverses some of the recent relatively happy news with an exaggerated jump to a higher U.3 unemployment rate.
Removed from the headline U.3 unemployment number, the broader unemployment measures do not seem to be suffering the same level of seasonal issues with their non-U.3 components. February U.6 unemployment rose to an adjusted 16.8% (eased to 17.9% unadjusted), from 16.5% (18.0% unadjusted) in January.
During the Clinton Administration, "discouraged workers" — those who had given up looking for a job because there were no jobs to be had — were redefined so as to be counted only if they had been "discouraged" for less than a year. This time qualification defined away the long-term discouraged workers. The remaining short-term discouraged workers (less than one year) are included in U.6.
Adding the excluded long-term discouraged workers back into the total unemployed, unemployment — more in line with common experience as estimated by the SGS-Alternate Unemployment Measure — rose to about 21.6% in February from 21.2% in January. While there likely were some ongoing seasonal aberrations in the February reporting, the SGS measure is based on the reported U.6 measure and usually varies with it. See the Alternate Data tab at www.shadowstats.com for a graph and more detail.
While 21.6% unemployment might raise questions in terms of a comparison with the purported peak unemployment in the Great Depression (1933) of 25%, the SGS level likely is about as bad as the peak unemployment seen in the 1973 to 1975 recession. The Great Depression unemployment rate was estimated well after the fact, with 27% of those employed working on farms. Today, less that 2% work on farms. Accordingly, for purposes of a Great Depression comparison, I would look at the estimated peak nonfarm unemployment rate in 1933 of 34% to 35%.
Signal for Intensified Downturn Continues. As discussed in recent Commentaries (see Commentary No. 277 for example), declining year-to-year change in real (inflation-adjusted) M3 signals a pending economic downturn or pending intensification of an existing economic contraction. The following updated graph reflects both the annual payroll change and the approximate annual real contraction in the SGS Ongoing M3 Estimate as of February 2010. The M3 plot is shifted forward on the time scale by six months so as to show its leading relationship to payrolls. The February real M3 estimate is based on approximations of 3.1% annual nominal M3 contraction and 2.2% annual CPI-U (total 5.3% contraction). A formal M3 estimate for February will be published over this weekend.
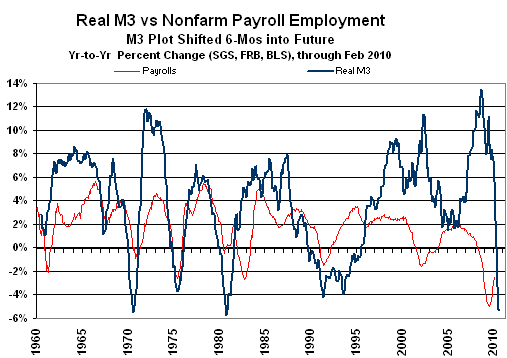
As the ongoing credit contraction squeezes personal and business consumption, most major economic series should begin to soften "unexpectedly" in the next several months of reporting.
Week Ahead. Given the underlying reality of a weaker economy (and likely re-intensifying downturn in the coming months) and more serious inflation problems than generally are expected by the financial markets, risks to reporting will tend towards higher-than-expected inflation and weaker-than-expected economic reporting in the months ahead. Such is true especially for economic reporting net of prior-period revisions.
Trade Balance in Goods and Services (January 2010). Due for release on Thursday, March 11th, the January trade deficit should widen further, against a relatively flat consensus (Briefing.com), setting an early, more-negative tone for reporting of first-quarter 2010 GDP growth at the end of April.
Retail Sales (February 2010). The February retail sales report is scheduled for release on Friday, March 12th. Briefing.com reports a consensus estimate of retail sales rising 0.1% month-to-month, following an initially-reported monthly gain of 0.5% in January. Unusual seasonal factor swings should kick-in here in the next month or so, showing weaker-than-expected growth, compounded by an actual slowing in economic activity beyond any blizzard effects. There are downside reporting risks to the consensus outlook, with both monthly and annual growth rates likely to flutter around zero, after inflation-adjustment.
__________