No. 286: February Production and Housing
JOHN WILLIAMS’ SHADOW GOVERNMENT STATISTICS
COMMENTARY NUMBER 286
February Production and Housing
March 16, 2010
__________
Bottom-Bouncing Continues
Fault Lines in "Recovery" Begin to Show
__________
PLEASE NOTE: The next regular Commentary is scheduled for Thursday, March 18th following release of the February CPI.
– Best wishes to all, John Williams
In both instances, the headline monthly reports were positive, thanks in part to downward revisions to prior reporting. This pattern of revision is most typical during periods of economic contraction, and the resumption of this pattern may suggest some early cracks in the facade of the consensus economic "recovery," consistent with indications of a pending intensification of the economic downturn as signaled by the year-to-year contraction in real (inflation-adjusted) broad money supply (SGS-Ongoing Measure of M3, see Commentary No. 284). Both the retail and production series had seen some near-term monthly gains due to the short-lived impact of stimulus gimmicks. Also, as discussed in recent writings, both series — particularly retail sales — have seen unusual boosts from likely distortions in seasonal factors resulting from the unusual duration and depth of the current economic contraction. Those near-term gains increasingly should prove to have been very fleeting. Real retail sales for February will be addressed in the Thursday (March 18th) Commentary. Today’s February housing starts report, once again, showed no statistically-meaningful month-to-month change, continuing the pattern of bottom-bouncing seen for the last 15 months.
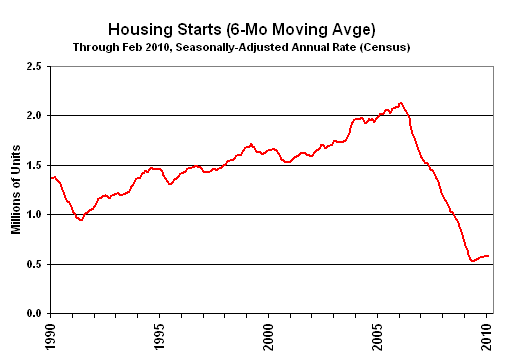
Since December 2008, housing starts have been bottom-bouncing at an historically low level, averaging a seasonally-adjusted annual rate of 558,700. In the past 15 months, all monthly readings have been within the normal range of monthly volatility for the series around that average, including February 2010’s reading of 575,000.

The "recovery" in housing is shown in the above graph. The data are smoothed using a six-month moving average to remove the extreme month-to-month volatility seen in this series. Regardless of any level of smoothing, though, in the current cycle, housing starts remain at least 25% below any levels seen since before the end of World War II.
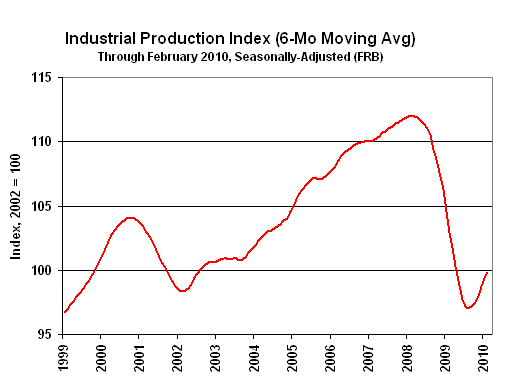
The June 2009 reading of 95.75 remained the record low for annual production growth since the shutdown of war-time production that followed World War II. For the last 14 months, the production index has averaged 98.61, around which the series has been fluctuating, with February’s six-month moving average reading at 99.84, versus 100.99 for the single month.

The "recovery" in production is shown in the above graph, where month-to-month volatility is smoothed using a six-month moving average. Production activity has leveled off at a low-level plateau of activity that effectively has wiped out the last eight years of growth in industrial production. Despite the near-term upside bump generated by short-lived stimulus impact, the series generally still is bottom-bouncing and should begin to soften significantly in the next several months.
Producer Price Index — PPI (February 2010). Scheduled for release tomorrow, Wednesday, March 17th, the regularly volatile PPI could offer some upside surprise to expectations. Briefing.com suggests a consensus estimate of a 0.1% monthly contraction following January’s 1.4% gain.
Consumer Price Index — CPI (February 2010). Scheduled for release on Thursday, March 18th, the February CPI-U also may offer some upside surprise to expectations, given the monthly gains shown in February gasoline station and grocery store sales. Seasonally-adjusted monthly CPI-U could pick-up 0.1% to 0.2% for the month, following a 0.3% gain in January.
Year-to-year inflation would increase or decrease in February 2010 reporting, dependent on the seasonally-adjusted monthly change, versus the 0.43% adjusted monthly gain seen in February 2009. I use the adjusted change here, since that is how consensus expectations are expressed. To approximate the annual inflation rate for February 2010, the difference in February’s headline monthly change versus the year-ago monthly change should be added to or subtracted directly from January 2010’s annual inflation rate of 2.63%. So a result of an adjusted 0.1% monthly gain would suggest annual CPI-U inflation for February of roughly 2.3%.
__________