No. 297: Inflation, Housing Starts
COMMENTARY NUMBER 297
Inflation, Housing Starts
May 19, 2010
__________
Market Fears of European Financial Instability
Should Shift to Fears of U.S. Financial Instability
Annual Inflation: 2.2% (CPI-U), 9.5% (SGS)
Perils of "Core" and Seasonally-Adjusted Inflation
Housing Starts Keep Bottom Bouncing
__________
PLEASE NOTE: The next regular Commentary is scheduled for Thursday, May 27th, following the release of the second estimate (first revision) of first-quarter GDP, along with analysis of April new orders for durable goods, which will be released earlier in the week (see Week Ahead).
– Best wishes to all, John Williams
Over the short-term, elements of "flight to safety" in the U.S. dollar will help to contain short-term U.S. inflation. As the dollar strengthens or weakens against the currencies of the major U.S. trading partners, those foreign exchange moves respectively help to reduce or increase the price of oil, which is denominated in U.S. dollars. Oil is the most significant commodity in terms of impacting U.S. inflation, where prices drive not only energy and transportation costs, but also raw material costs for a variety of chemicals, including those used in fertilizers, pharmaceuticals and plastics. As the euro has come under sharp selling pressure in May against the dollar, oil prices have dropped in tandem. As long as such pressures continue, they will act as a depressant to U.S. inflation.
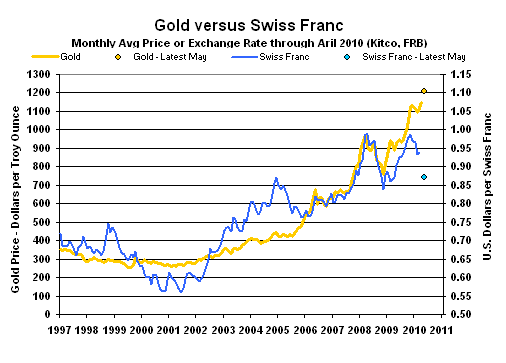
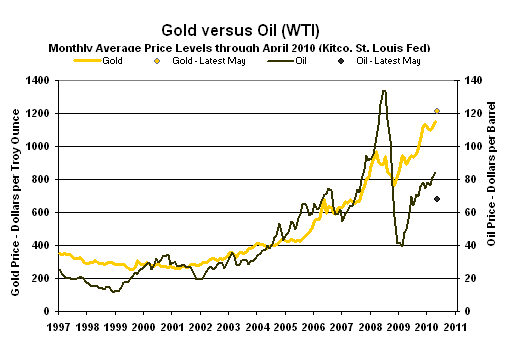
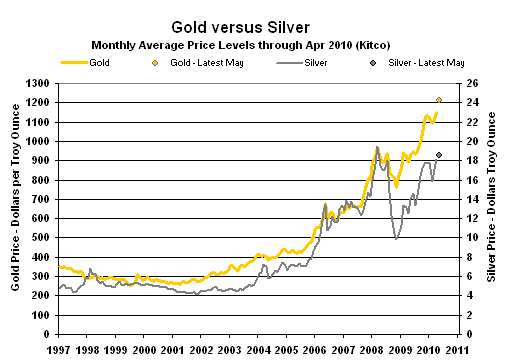
Eventually, I expect the euro will be broken up, at least partially. That system likely was doomed from the start, with little realistic chance of countries with such widely varying fiscal traditions coming into required financial harmony. Nonetheless, risks to global systemic solvency from current instabilities are significant, and it remains likely that anything necessary to keep the system together for the short-term likely will be pursued, specifically in ongoing efforts and arm-twisting by the Fed and the Administration.
There also, however, have been elements of "flight to safety" in gold and silver, the prices of which have rallied recently in U.S. dollar terms. Beyond the euro crisis, such suggests some anticipation of the problems ahead for the U.S. dollar and U.S. inflation.
Indeed, the greatest risk to global markets and systemic stability and solvency remains the United States. Already in the midst of an intractable fiscal disaster (see the Hyperinflation report), the U.S. economy is on the brink of an intensified/renewed economic downturn. Such is signaled by annual contraction in real (inflation-adjusted) M3, a solid leading indicator to U.S. economic activity (see Commentary No. 296). Projections ranging from federal and state budget deficits to banking solvency have been predicated on 2% to 3% GDP growth in 2010, not a continued contraction.
As the federal budget deficit and Treasury funding needs explode in the year-ahead, eventually domestic and foreign balking at buying U.S. Treasuries should become widespread, with Fed becoming the buyer of last resort, monetizing that federal debt. Coincident with that likely will be heavy dumping of the U.S. dollar and dollar-denominated paper assets. Such should spike U.S. money supply and dollar-based oil prices. The pace of inflation would tend to pick up significantly in response to these circumstances, setting the stage for the hyperinflation referenced earlier.
The general outlook on the economy and the markets is unchanged, and circumstances suggest looking at actions for long-range preservation of wealth and assets. Despite any severe near-term volatility in the markets, physical gold and silver, assets outside the U.S. dollar (I like the Canadian dollar, the Australian dollar and Swiss franc) and assets outside the United States, offer long-term hedges against the severe loss ahead in U.S. dollar’s purchasing power.
Notes on Different Measures of the Consumer Price Index.
The Consumer Price Index (CPI) is the broadest inflation measure published by U.S. Government, through the Bureau of Labor Statistics (BLS), Department of Labor:
The CPI-U (Consumer Price Index for All Urban Consumers) is the monthly headline inflation number (seasonally adjusted) and is the broadest in its coverage, representing the buying patterns of all urban consumers. Its standard measure is not seasonally adjusted, and it never is revised on that basis except for outright errors,
The CPI-W (CPI for Urban Wage Earners and Clerical Workers) covers the more-narrow universe of urban wage earners and clerical workers and is used in determining cost of living adjustments in government programs such as Social Security. Otherwise its background is the same as the CPI-U.
The C-CPI-U (Chain-Weighted CPI-U) is an experimental measure, where the weighting of components is fully substitution based. It generally shows lower annual inflation rate than the CPI-U and CPI-W. The latter two measures once had fixed weightings—so as to measure the cost of living of maintaining a constant standard of living—but now are quasi-substitution-based. Since it is fully substitution based, the series tends to reflect lower inflation than the other CPI measures. Accordingly, the C-CPI-U is the "new inflation" measure being proffered by Congress and the White House as a tool for reducing Social Security cost-of-living adjustments by stealth. Moving to accommodate the Congress, the BLS announced pending changes to the C-CPI-U estimation and reporting process on October 22, 2014, which are described in Commentary No. 668
The ShadowStats Alternative CPI-U measures are attempts at adjusting reported CPI-U inflation for the impact of methodological change of recent decades designed to move the concept of the CPI away from being a measure of the cost of living needed to maintain a constant standard of living.
For the individual who has to fill his or her gas tank with cash from not-seasonally-adjusted take-home pay, the unadjusted monthly inflation rate is the most relevant one. The most meaningful inflation measure overall is unadjusted on a year-to-year basis, with April CPI-U up by 2.2% and April gasoline prices up by 38.3%.
Traditionally, the CPI has been reported with the emphasis on the unadjusted number, but the Obama Administration’s BLS shifted its reporting emphasis to the seasonally-adjusted monthly number in the reporting of August 2009 inflation.
The opening two lines of text in the July 2009 CPI release, the last use of a template that goes as far back as the BLS publishes its historic press releases, were:
"The Consumer Price Index for All Urban Consumers (CPI-U) decreased 0.2 percent in July before seasonal adjustment[my emphasis], the Bureau of Labor Statistics of the U.S. Department of Labor reported today. Over the last 12 months the index has fallen 2.1 percent…"
Since August 2009, the opening two lines of text have been based on a new template, as used in the April 2010 release:
"On a seasonally adjusted basis [my emphasis], the Consumer Price Index for All Urban Consumers (CPI-U) declined 0.1 percent in April, the U.S. Bureau of Labor Statistics reported today. Over the last 12 months, the index increased 2.2 percent before seasonal adjustment."
Core Inflation Nonsense. Ostensibly, Federal Reserve Chairman Arthur Burns popularized the concept of "core" inflation — price inflation net of changes in food and energy prices — during the Nixon Administration, as a way to obfuscate the inflationary pressures generated by the oil crisis of the time. The concept has been embraced ever since by Fed chairmen faced with ongoing inflation problems exacerbated by oil prices. Although the BLS had tended to distance itself from the core inflation concept, it embraced the "core" numbers in the April CPI release: "The continuing stability of the index for all items less food and energy has resulted in an increase over the last 12 months of 0.9 percent, the smallest 12-month increase since January 1966."
Where core inflation has its value is in assessing a monthly (or other short-term) number to see how other inflation is doing during times of volatile oil or food prices. Extending core inflation to an annual basis, however, is meaningless in terms of assessing anyone’s cost of living, and, correspondingly, in terms of an inflation basis for Federal Reserve targeting. Energy and food are major components of consumer expenditures (22.3% of current CPI-U weighting). Even Fed Chairman Bernanke consumes food and energy. Using the BLS numbers — assuming they were accurate (see alternative measures, below) — a core-inflation 0.9% cost-of-living adjustment would be somewhat shy of what the average consumer would be looking for, with CPI-U annual inflation (including food and energy) running at 2.2%.
CPI-U. The BLS reported this morning (May 19th) that the seasonally-adjusted April CPI-U eased by 0.07% (up by 0.17% unadjusted) +/- 0.12% (95% confidence interval not seasonally adjusted) for the month, after a 0.06% (0.41% unadjusted) gain in March. Seasonally-adjusted, the CPI-U annualized rate of inflation for the three months ended April 2010 (April versus January) was zero, against March’s 0.93%. The lack of inflation in the latest three months, again, was due to seasonal adjustments. Unadjusted, the CPI-U annualized rate of inflation for the three months ended April 2010 (April versus January) was 2.46%, against March’s 3.15%.
Unadjusted, April’s year-to-year inflation was 2.24% +/- 0.20% (95% confidence interval) against a 2.31% annual increase in March.
Year-to-year inflation would increase or decrease in next month’s May 2010 reporting, dependent on the seasonally-adjusted monthly change, versus the 0.11% adjusted monthly gain seen in May 2009. I use the adjusted change here, since that is how consensus expectations are expressed. To approximate the annual inflation rate for May 2010, the difference in May’s headline monthly change (or forecast of same) versus the year-ago monthly change should be added to or subtracted directly from April 2010’s annual inflation rate of 2.24%.
CPI-W. The narrower, seasonally-adjusted April CPI-W notched lower by 0.14% (gained 0.20% unadjusted) for the month, following a gain of 0.06% (up 0.46% unadjusted) in March. Seasonally-adjusted, the annualized rate of CPI-W inflation for the three months ended April (April versus January) was a contraction of 0.03%, versus a gain of 1.62% in March. As with the CPI-U, the lack of inflation in the latest three months again was due to seasonal adjustments. Unadjusted, the CPI-W annualized rate of inflation for the three months ended April 2010 (April versus January) was 2.64%, against March’s 3.49%.
Unadjusted year-to-year CPI-W inflation rose by 2.90% in April, following a 3.04% March increase.
C-CPI-U. The Chain-Weighted CPI-U — the fully substitution-based series that gets touted by CPI opponents and inflation apologists as the replacement for the CPI-U — is reported only on an unadjusted basis. Year-to-year or annual inflation was 2.33% in March 2010, versus 2.45% in March. Unadjusted, the C-CPI-U annualized rate of inflation for the three months ended April 2010 (April versus January) was 2.40%, against March’s 3.19%.
Where C-CPI-U inflation continues being reported somewhat higher than CPI-U inflation, and where the C-CPI-U in theory should be showing lower inflation, the inconsistencies suggest some ongoing reporting difficulties with the CPI series.
Alternative Consumer Inflation Measures. Adjusted to pre-Clinton (1990) methodology, annual CPI rose to roughly 5.6% growth in April 2010, the same level as in March, while the SGS-Alternate Consumer Inflation Measure, which reverses gimmicked changes to official CPI reporting methodologies back to 1980, rose to about 9.5% (9.46% for those using the extra digit) in April, versus 9.5% in March.
The SGS-Alternate Consumer Inflation Measure adjusts on an additive basis for the cumulative impact on the annual inflation rate of various methodological changes made by the BLS. Over the decades, the BLS has altered the meaning of the CPI from being a measure of the cost of living needed to maintain a constant standard of living, to something that no longer reflects the constant-standard-of-living concept. Roughly five percentage points of the additive SGS adjustment reflect the BLS’s formal estimate of the impact of methodological changes; roughly two percentage points reflect changes by the BLS, where SGS has estimated the impact not otherwise published by the BLS.
Gold and Silver Highs Adjusted for CPI-U/SGS Inflation. Despite recent all-time highs in the price of gold, in the current cycle, gold and silver prices have yet to approach their historic high prices, adjusted for inflation. Even with the week-ago (May 12th) historic high gold price of $1,237.50 per troy ounce, the prior all-time high of $850.00 (London afternoon fix, per Kitco.com) of January 21, 1980 was not breached in terms of inflation-adjusted dollars. Based on inflation through April 2010, the 1980 gold price peak would be $2,382 per troy ounce, based on not-seasonally-adjusted-CPI-U-adjusted dollars, and would be $7,576 per troy ounce in terms of SGS-Alternate-CPI-adjusted dollars.
In like manner, the all-time high price for silver in January 1980 of $49.45 per troy ounce (London afternoon fix, per silverinstitute.org) has not been hit since, including in terms of inflation-adjusted dollars. Based on inflation through April 2010, the 1980 silver price peak would be $139 per troy ounce, based on not-seasonally-adjusted-CPI-U-adjusted dollars, and would be $441 per troy ounce in terms of SGS-Alternate-CPI-adjusted dollars.
As shown on page 22 in the Hyperinflation report, over the decades, the price of gold has more than compensated for the loss of the purchasing power of the U.S. dollar as reflected by CPI-U inflation, while it has effectively fully compensated for the loss of purchasing power of the U.S. dollar based on the SGS-Alternate CPI.
Real Money Supply M3. The signal of pending intensification of the economic downturn, based on the annual contraction in the inflation-adjusted broad money supply (M3), was discussed in the prior Commentary No. 296. The annual real contraction in April M3 (SGS-Ongoing) estimated for that Commentary was 6.9%. Based on today’s CPI-U report, that annual contraction was 7.0%, deepened from March’s 6.0% contraction.
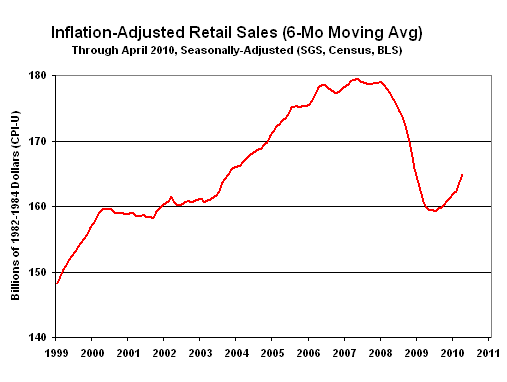
Real Retail Sales. Based on April 2010 CPI-U reporting, inflation- and seasonally-adjusted monthly April retail sales rose by 0.5%, where before inflation adjustment the current number was up by 0.4%, versus a 2.1% monthly real retail sales gain in March, the same as before inflation adjustment. April real retail sales rose by 6.41% year-to-year, versus an 8.8% gain before inflation adjustment. Real March sales were up 6.0% year-to-year, versus an 8.5% gain before inflation adjustment.
Since November 2008, monthly real retail sales (CPI-U deflated) have been fluctuating around an average of $161.7 billion (the deflated March number was $168.4). Smoothed for monthly volatility on a six-month moving-average basis, as shown in the accompanying graph, the pattern of activity here has been one of bottom-bouncing in terms of the level of inflation-adjusted sales. The recent bounce from short-lived factors and warped-seasonals remains likely to turn much lower in the months ahead. There has been no change in underlying fundamentals that would support a sustainable turnaround in economic activity — no recovery — just general bottom-bouncing, as should be confirmed anew in subsequent reportingv
Unadjusted and year-to-year, April’s annual PPI inflation rate eased to 5.5% from the 6.0% annual gain reported for March.
On a monthly basis, seasonally-adjusted April intermediate goods rose by 0.8% (up by 0.6% in March), with crude goods falling by 1.2% (up by 3.2% in March). Year-to-year inflation in April intermediate goods was up by 8.6% (up by 7.7% in March), with April annual inflation in crude goods up by 28.8% (up by 33.4% in March).
Year-to-year change in April was a gain of 40.9% +/- 23.1% (95% confidence interval), following a revised annual gain of 22.1% (previously 20.2%) in March. The extreme variation in annual growth patterns is due to the collapsing and troughing (April 2009 was the trough) of data a year ago combined with the extreme volatility seen in these data in the current contraction.
Since December 2008, housing starts have been bottom-bouncing at an historically low level, averaging a seasonally-adjusted annual rate of 572,650. In the past 17 months, all monthly readings have been within the normal range of monthly volatility for the series around that average, including April 2010’s reading of 672,000.
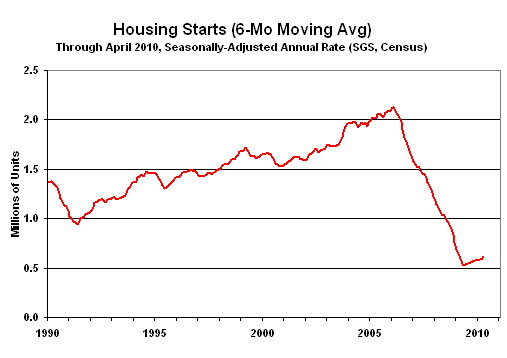
The "recovery" in housing is shown in the above graph. The data are smoothed using a six-month moving average to remove the extreme month-to-month volatility seen in this series. Regardless of any level of smoothing, though, in the current cycle, housing starts remain at least 25% below any levels seen since before the end of World War II. Along with the activity in the broad economy, a renewed downturn in housing remains in the offing.
New Orders for Durable Goods (April 2010). April new orders for durable goods are scheduled for release on Wednesday, May 26th. As usual, the monthly change in this randomly volatile series is not likely to be meaningful, with a broad pattern of bottom-bouncing likely to continue.
Gross Domestic Product — GDP (First-Quarter 2010, Second Estimate). Due for release on Thursday, May 27th, the first revision to first-quarter GDP is expected to show slightly stronger annualized real (inflation-adjusted) growth, 3.3% versus the initial reporting of 3.2%, per Briefing.com. Such is no more than statistical noise. If anything, the widening of the March trade deficit and the benchmark revision to retail sales would suggest a small downside revision, but the retail sales revisions likely will not surface until the annual GDP revision, due in July.
Of interest, though, will be the initial reporting of first-quarter Gross National Product (GNP), which is GDP net of the trade balance in transfer (interest and dividend) payments, and Gross Domestic Income (GDI) which is the theoretical income-side equivalent to the consumption-side GDP. The GDI tends to be less politicized.
__________