JWSGS - JULY 2005 EDITION
JOHN WILLIAMS' SHADOW GOVERNMENT STATISTICS
Issue Number Nine
July 13, 2005
_____
Inflationary Recession Takes Increasing Hold
July Payrolls Face Outright Contraction
Markets Face Data Shocks During Next Two Months
The 2005-2007 inflationary recession continues to unfold and appears ready to offer up its first real data shocks of the cycle: an outright contraction in July payrolls combined with a meaningful jump in the unemployment rate. Further, upcoming trade deficits should widen sharply, and industrial production is due for monthly contractions, soon, with the onset of a contraction trend not currently anticipated by the financial markets.
Augmenting SGS recession warning signals already in place (money supply, purchasing managers new orders index, real average weekly earnings), help-wanted advertising and housing starts had their three-month moving averages turn negative on a year-to-year basis in last month's reporting.
On the inflation front, however, the CPI and PPI contracted in the most recent reporting, and the latest purchasing managers prices paid indices were not looking too inflationary. Nonetheless, oil prices hit an all-time high and much higher prices at the consumer level lie ahead. The Bureau of Labor Statistics likes to play games with energy prices, making sure any price declines get reported right away, while higher prices only get to trickle into the CPI and PPI reporting. These BLS price actions tend to run counter to the common business practices the BLS supposedly mirrors in its reporting. Most businesses pass price increases along as soon as they are aware of them, but they tend to be slow in passing along price declines.
With similar intent at obfuscation, Wall Street shills tout the inflation rate net of food and energy, as though two major necessities of life do not count in the cost of living. Despite all the hoopla and reporting games, energy prices eventually do work their way into CPI inflation, and consumer prices will rise very meaningfully in the months ahead.
Compounding oil's impact on the inflation is the U.S. dollar. The greenback's recent strength will falter as the recession unfolds, as the trade deficit widens and as the politicians in Washington get themselves in ever-deeper fiscal trouble. Record lows for the U.S. currency are likely in the months ahead. As an aside, we offer in this month's Reporting Focus a new measure of the dollar's value, the Shadow Government Statistics Financial-Weighted Dollar Index, weighted by currency trading volume. The new index shows the dollar has lost nearly 50% of its value, in the last 20 years, against the world's other major currencies.
Recession, inflation and dollar woes do not offer a happy environment for the financial markets. Given the current circumstance, here is a recapitulation of recent points as to the broad picture of what lies ahead:
The Shadow Government Statistics' Early Warning System was activated in May and continues to signal the onset of a formal recession early in third-quarter 2005.
The system looks at historical growth patterns of key leading economic indicators in advance of major economic booms and busts and sets growth trigger points that generate warnings of major upturns or downturns when predetermined growth limits are breached. Since the beginning of 2005 a number of key indicators have been nearing or at their fail-safe points. In the last several months, three indicators moved below those levels, signaling an imminent recession. Once beyond their fail-safe points, these indicators have not sent out false alarms, either for an economic boom or bust.
While sporadic, negative GDP growth likely will not surface in government reporting until later in 2005 or 2006. The National Bureau of Economic Research (NBER) should time the downturn to mid-2005 and announce same sometime in early-to-mid 2006. The popular financial media will begin to debate whether there is a recession underway by late 2005, but those Wall Street economists who act as shills for the market will keep up their "strong growth is just around the corner" hype regardless of any and all evidence to the contrary.
From the standpoint of common experience, this downturn will be considered the second leg of a double-dip recession, not an independent contraction as will be claimed officially.
The softening seen recently in most economic data already has started to accelerate sharply, with monthly contractions beginning or continuing for payroll employment and industrial production in the immediate future. Significant deterioration also will be seen in federal tax receipts (a widening budget deficit) and corporate profits. This outlook is predicated on economic activity that already has taken place and does not consider any risks from exogenous factors such as renewed terrorist activity in the United States. The tragic events of last week in London showed how sensitive the global markets and economies still are to such madness.
Market perceptions will be slow to adjust to the renewed downturn in business activity. When expectations finally begin to anticipate weak data, expectations also will be lowered for inflation. As a result, consensus forecasts generally will tend to continue to be surprised on the downside for economic reports, and on the upside for inflation reports, for some time to come.
The roots of the current difficulties are structural in nature. A consumer starved of income growth and overburdened with debt cannot sustain the real (inflation-adjusted) growth in consumption needed to keep GDP growth in positive territory. The income weakness is a direct result of the loss of a significant manufacturing base to offshore locations and the ensuing explosive, perpetual growth of the U.S. trade deficit.
Exacerbating economic and financial woes will be unusually high inflation during this contraction. Inflation, fueled by high oil prices and weakness in the U.S. dollar, will not be brought under control simply by weakness in economic demand. Instead, persistently high prices only will serve to intensify the 2005-2007 recession, making it unusually long and protracted. Ongoing inflation woes and dollar problems will maintain upside pressure on long-term interest rates, inhibiting the traditional flattening of the yield curve expected with a recession.
An inflationary recession remains a nightmare for the financial markets. Particularly hard hit will be the U.S. dollar, with downside implications for both equity and bond prices.
THE BIG THREE MARKET MOVERS
(Each of these series is explored in the background article "A Primer On Government Economic Reports," available on the home page.)
Employment/Unemployment -- June's weak payroll numbers reflected a combination of slowing business activity and revisions. Separately, despite the softer-than-expected results, poor quality seasonal adjustments still tended to inflate the number of jobs reported. Seasonal-factor distortions are common in June -- with the end of the school year -- and such appears to have been the primary force behind the drop in the unemployment rate. Nevertheless, look for a contraction in July payrolls and unhealthy spikes the in upcoming unemployment rates, as the 2005 recession digs in its heels.
The popularly followed unemployment rate U-3 for June 2005 was 5.02% against 5.13% in May, seasonally adjusted. That decline in unemployment was well within the +/- 0.22% published 90% confidence interval.
Hinting at some of the school-year distortions in the seasonals, unadjusted U-3 unemployment rose to 5.2% in June from 4.9% in May. The broader U-6 unemployment measure soared from 8.6% in May to 9.3% in June, with the seasonally-adjusted rate notching higher from 8.9% to 9.0%. Including the long-term "discouraged workers" defined away during the Clinton administration, total unemployment remained roughly 12.0%.
The household survey showed a seasonally-adjusted 163,000 gain in June employment after May's 376,000 increase in the number of people who were gainfully employed.
Moving in tandem with household employment, the June payroll survey showed a seasonally-adjusted gain of 146,000 (190,000 net of revisions) +/- 108,000, after May's initial reporting of 78,000 new jobs was revised upward to 104,000.
Of course, roughly 184,000 of the 146,000 new jobs gained were accounted for by the monthly bias factors. In July, however, the fudge factor turns negative; it was a subtraction of 80,000 last year, and the relative negative swing in the unadjusted bias factors by 220,000 to 230,000 largely will flow through to impact the monthly change in the seasonally-adjusted payroll numbers.
Recent patterns of year-to-year growth in the payroll series are irregular and highlight unconscionable games being played with the month-to-month seasonal factors. On an unadjusted basis (which is the statistically better way to view the annual changes), annual growth of 1.70% in April eased to 1.54% in May and rose to 1.65% in June. Seasonally adjusted, April through June annual growth rates were 1.65%, 1.54% and 1.57%, respectively. Properly adjusted for seasonal factors, the annual growth rates should be within a point or two, each month, to the second decimal point. The difference of 0.08% growth seen in the June data is enough to distort the reported monthly change by 107,000 jobs.
June's employment/unemployment data were against a background of weakening help-wanted advertising, declining employment as reported in the manufacturing purchasing managers surveys, and deteriorating new claims for unemployment insurance (see the respective sections).
Next Release (August 5): Chances are good for an outright contraction in July payrolls. This would result from a combination of the unfolding recession, a negative swing in bias factors and a likely reversal of screwy seasonal factors that inflated June reporting. The combination of recession and seasonal-factor reversal also should spike July's unemployment rate.
Gross Domestic Product (GDP) -- Once again, the GDP has shown itself to be the most worthless and overrated of the major economic reports. The revision known as the "final" estimate took first-quarter 2005 annualized real GDP growth to 3.76% +/- 3.1% from 3.48%. Not only is the revision far from final, the revised growth still is hardly statistically distinguishable from zero growth. Even with final sales (GDP net of inventory change) revising from 2.71% to 3.05%, that growth still was statistically indistinguishable from a contraction. Fourth-quarter 2004 GDP and final sales growth rates were 3.85% and 3.39% respectively.
Revisions to GDP inflation accounted for virtually all the "final" revisions to growth. The GDP implicit price deflator for the quarter was revised downward from 3.16% to 2.89% (a drop of 0.27%). By reducing the rate of inflation, the Bureau of Economic Analysis spiked real GDP growth by the same amount, and total GDP growth revised upward from 3.48% to 3.76%, and increase of 0.28%.
While an upward revision to housing growth was touted as part of the improving GDP outlook, it all was in inflation. The housing deflator revised downward from an annualized 3.3% to 1.1%, a drop of 2.2%, and real housing growth revised from 8.8% to 11.5%, an increase of 2.7%. Year-to-year housing inflation in the GDP is reported at just 5.2%, an unbelievably low inflation rate for anyone who has been looking at new home prices.
Revised estimates of two alternate GDP measures were published with this release. First-quarter 2005 annualized real growth in Gross National Product (GNP) revised to 3.85% from 3.65%, up from 3.47% in the fourth quarter. The GNP is a broader measure than GDP, including international flows in factor income such as dividends and interest payments, and usually shows weaker growth than the GDP.
Among the incredible (as in unbelievable) features of the latest report, annualized growth in Gross Domestic Income (GDI) revised to 5.22% from 4.06% in last month's reporting, but it still was down from 7.85% in the fourth quarter. In theory, the GDI equals the GDP, since it is the income-side measure to the GDP's consumption side, but something very strange is happening to the "statistical discrepancy."
The difference between the two series is made up by a "statistical discrepancy" account that swung from +$60.4 billion in third-quarter 2004 to -$52.1 billion in the fourth quarter and to -$70.1 billion in preliminary first quarter reporting (all not adjusted for inflation). Now, the statistical discrepancy has deteriorated to -$95.8 billion in revision. As reporting advances and better data become available, one expects the discrepancy to narrow, not to get worse. The unusual shifts show the GDP's income side is growing much faster than the consumption side, which again, in theory, cannot happen. Something unusual is afoot in BEA data gathering, particularly with the benchmark revision due next month.
Our best estimate remains that GDP reporting is overstated by about three percent, which would place actual annualized real growth still a tad above zero, plus or minus about three percent, given 90% confidence intervals. Actual GDP is about to turn negative, although reporting of same may take some time to show up.
Next Release (July 29): The next report includes not only the "advance" estimate of second-quarter 2005 GDP, but also the annual revision of GDP data, ranging from first-quarter 2002 to the just "finalized" first-quarter 2005. Look for second-quarter growth to be down from the first quarter and below market expectations. Growth should have slowed coming into the recession. Also, as has consistently been the pattern in recent years, look for historic GDP growth rates generally to revise downward.
Consumer Price Index (CPI) -- The seasonally-adjusted May CPI-U offered the markets a brief respite from inflation concerns with a 0.1% monthly decline (0.1% decline unadjusted), after a 0.5% increase in April. Going against strong inflation last year, unadjusted May year-to-year inflation fell from 3.5% to 2.8%. Beyond the usual distortions, this month's CPI appears to have been reduced artificially by an overzealous accounting of reduced energy prices.
For example, the May CPI reflects a seasonally-adjusted, month-to-month contraction of 4.4% in gasoline prices. Yet, May retail sales show gas station sales (a surrogate for gasoline prices) down just 1.6%. That difference in gasoline alone is worth 0.1% in CPI growth. Anyone who buys gasoline knows the dip in gasoline prices did not last very long. Such energy accounting is a common feature of CPI reporting, though, where energy price reductions flow through almost immediately, but energy price increases always are slow to get reported.
Using the CPI's original (pre-Clinton Era) methodological approach of a fixed basket of goods (vs. substitution of hamburgers for steak as estimated by geometric weighting) would leave year-to-year inflation at about 5.6% instead of the official 2.8%.
The "experimental" Chained Consumer Price Index (C-CPI-U) for May, the fully substitution based CPI that presumably is the eventual replacement for current CPI reporting, showed annual inflation at 2.5%, which backed off from April's all time high of 2.9%.
Next Release (July 14): Inflation pressures continue, despite wishes of the Bureau of Labor Statistics to the contrary, and an upside reporting surprise for the June CPI is likely against consensus forecasts of about 0.2%. High oil prices assure an eventual rebound in reported CPI inflation to levels above those seen in April. Any seasonally-adjusted monthly change above or below roughly 0.3% in June should add directly to or subtract from the currently reported annual growth of 2.8%.
OTHER TROUBLED KEY SERIES
To varying degrees, the following series have significant reporting problems. All series (including the more trouble free) will be addressed in a monthly "Reporting Focus," with Financial- and Trade-Weighted U.S. Dollar Indices covered this month. In addition to the big three, other series that have been detailed are The Federal Deficit (an original background article and an update in the Alert of July 7, 2005), Consumer Confidence (November 2004 SGS), the Trade Balance (December 2004 SGS), Industrial Production (January 2005 SGS), Initial Claims for Unemployment Insurance (February 2005 SGS), Retail Sales (March 2005 SGS), Alternate Payroll Employment Measures (April 2005 SGS), Money Supply - Part I / SGS Early Warning System (May 2005 SGS), Money Supply - Part II (June 2005 SGS).
Federal Deficit -- The official deficit for the fiscal year ended September 30, 2004 was $412.3 billion, up from $374.8 billion the year before. For the twelve months ended May 2005, the rolling deficit was $338.8 billion versus $427.5 billion in May 2004.
Gross federal debt as of the end of September (U.S. fiscal year-end 2004) was $7.379 trillion, up $596 billion from a year earlier; at month-end June 2005, gross federal debt was $7.837 trillion, up $552 billion from June 2004, which, in turn, was up by $599 billion from June 2003.
The deficit outlook will turn quickly and sharply to deterioration as recession sets in. Since the government's borrowing needs will tend to exceed expectations, there remains a good chance that the Treasury will confirm the resurrection of the 30-year Treasury bond come August 3rd. (See "Federal Deficit Reality: An Update" for a more complete perspective.)
Initial Claims for Unemployment Insurance -- The annual change for new claims on a smoothed basis, for the 17 weeks ended July 2nd was a decline of 3.9% versus a 5.6% decline as of May 28th. The continual deterioration in recent months remains on track for growth to turn positive (a negative economic development) within the next month or so, supporting signals of a recession onset.
The volatility of the seasonally-adjusted weekly numbers is due partially to the seasonal-adjustment process. When the series is viewed in terms of the year-to-year change in the 17-week (three-month) moving average, however, such is a fair indicator of current economic activity.
Real Average Weekly Earnings -- May's seasonally-adjusted real average weekly earnings gained 0.3% from April, after April's change was revised from a gain of 0.2% to a 0.1% contraction. May's gain was distorted by an artificial decline in the May CPI (see CPI section). May's real earnings still were down 0.3% from the year before, although such narrowed from April's revised 0.6% contraction.
Allowing for the biases built into the CPI-W series used to deflate the weekly earnings, annual change in this series continues to signal a recession warning.
Retail Sales -- Partially reversing the effects of bad seasonal factors the month before, seasonally-adjusted May retail sales fell 0.5% (a decline of 0.4% net of revisions) +/- 0.7%, following April's 1.5% gain (originally 1.4%). On a year-to-year basis, May retail sales were up 6.8% versus an 8.9% increase in April (previously 8.6%).
Inflation-adjusted growth in retail sales below 1.8% (using the official CPI-U for deflation) signals recession, and annual growth remained comfortably above that level in May reporting.
Next Release (July 14): June retail sales likely will come in below strong expectations, mirroring impaired economic activity.
Industrial Production -- May's seasonally-adjusted industrial production jumped by 0.4% (0.3% net of revisions) for the month, following April's 0.3% decline (previously reported as a 0.2% contraction). May's rebound included a further decline in utilities output, although anecdotal evidence suggests unseasonably warm weather still inflated production measures measured by electricity consumption. May's year-to-year growth, however, continued to slow, down to 2.7% from April's 3.0% (was 3.1%).
Next Release (July 15): With the economy entering a contraction, overall industrial production should enter a period of protracted decline within the next month or so. Look for downside surprises in production reporting.
New Orders for Durable Goods -- Seasonally-adjusted new orders for durable goods in May soared 5.5% (5.2% net of revisions) following April's 1.4% increase (was 1.9%), thanks largely to the booking of commercial airplane orders. May year-to-year change rose to 10.5% from April's 3.7%. The widely followed nondefense capital goods orders gained 14.5% in May after a 4.0% increase in April.
Monthly volatility is high for this series. Durable goods orders used to be one of the better leading indicators of broad economic activity, when smoothed using a three-month moving average. After the semi-conductor industry stopped reporting new orders, the series' predictive ability fell apart. A benchmark revision is due for release on August 19th.
Trade Balance -- The seasonally-adjusted April trade deficit in goods and services rose to $57.0 billion from $53.6 billion in March, as the whole series was reset as to level in a benchmark revision going back to 1992. In any event, the pattern of the trade deficit widening on a regular basis should continue, with new record deficits in the months ahead.
In a related matter, the U.S. Current Account Deficit widened to a record, annualized $780.4 billion in first-quarter 2005 up from $753.6 billion in fourth-quarter 2004. These numbers also incorporated the benchmark trade revisions.
Next Release (Today, July 13): Look for a sharp widening in the May deficit, and for further significant deterioration at least for the next six-to-nine months. Today's reporting highlights will be available on the Gillespie Research Associates website after the data are released, with a more detailed analysis to follow.
Consumer Confidence -- June 2005 confidence had strong monthly gains, but with failing annual rates of growth. Month-to-month, the Conference Board's consumer confidence rose 2.6%, and the University of Michigan's consumer sentiment jumped by 10.5%.
On a three-month moving average basis, year-to-year change in confidence slowed from 10.4% in May to 5.6% in June, and the annual decline in sentiment narrowed from a contraction of 4.6% in May to a 3.4% drop in June. The lack of pick-up in annual growth suggests the monthly gains for June were largely seasonal in nature. As lagging, not leading, indicators, these numbers continue to confirm the economy was slowing throughout fourth-quarter 2004, then stagnating and slowing again into second-quarter 2005.
Producer Price Index (PPI) -- The seasonally-adjusted May finished goods PPI fell by 0.6% (a decline of 0.2% unadjusted) for the month, after April's 0.6% gain. May's annual gain backed off to 3.5% from April's 4.8% level, as the same overstatement of declining energy costs that underestimated CPI growth also played into PPI reporting.
Next Release (July 15): Despite a large component of random volatility in monthly price variations, PPI inflation reporting over the next three-to-six months should continue averaging above market expectations. April consensus forecasts for the monthly gain appear to be around 0.4%.
Purchasing Managers Survey (Non-Manufacturing) -- Published by the Institute for Supply Management (ISM), there is nothing unusually wrong with this survey of the service industry, except it does not have much meaning. Unlike its older counterpart, the manufacturing survey, if service companies such as law firms, hospitals or fast-food restaurants have "increased orders," that does not necessarily mean that economic activity is increasing.
Such considered, the overall index rose from 58.5 in May to 62.2 in June. The index is a diffusion index, where a reading above 50.0 indicates a growing service economy, in theory. Both the employment and prices paid components, however, have some meaning.
The June employment component rose to 57.4 from 53.4 in May, suggesting some employment pick-up for the month in the service sector.
The prices paid component diffusion index is a general indicator of inflationary pressures. The June index rose to 58.5 from 57.5 in May. This was the first increase in the level of the prices paid index in eight months. The level is consistent with increasing inflation. On a three-month moving average basis, though, the annual change in June was down 16.4% from the year before, following an annual 9.0% decline in May.
BETTER-QUALITY NUMBERS
The following numbers are generally good-quality leading indicators of economic activity and inflation that offer an alternative to the politically hyped numbers when the economy really is not so perfect. In some instances, using a three-month moving average improves the quality of the economic signal and is so noted in the text.
Economic Indicators
Purchasing Managers Survey (Manufacturing) - New Orders -- Although, rebounding in June, the new orders index still has minimally breached its fail-safe point, generating an SGS early warning indicator of pending recession.
The June index rose 10.6% to 57.2 from 51.7 in May. The Commerce Department provides the seasonal factors for this series, and the adjusted monthly numbers often can be misleading in the reporting of month-to-month change. This problem is overcome by using year-to-year change on a three-month moving average basis. On that basis, June's index was down 15.1% from June of 2004, against May's annual decline of 16.7%, having continually notched lower from its 36.6% peak annual gain in April of 2004.
Published by the Institute for Supply Management (ISM), the new orders component of the purchasing managers survey is a particularly valuable indicator of economic activity. The index is a diffusion index, where a reading above 50.0 indicates rising new orders. The overall June ISM edged higher to 53.8 from May's reading of 51.4. An index level of 50.0 divides a growing versus contracting manufacturing sector.
Also of some note, the June employment component remained below 50.0 for a second month, signaling an outright contraction in manufacturing jobs. The June employment index rose to 49.9 from May's 48.8.
Help Wanted Advertising Index (HWA) -- The May index fell 5.1% to 37 from April's 39 reading, just one point off the low of the 2001 recession and current cycle. This series is best viewed on a year-to-year basis with a three-month moving average.
For May, that annual change in the three-month moving average turned negative, declining by 0.9%, down from a 1.7% increase in April. HWA is a series that never recovered from the 2001 recession, having been at its cyclical nadir of 36 as recently as November 2004. Accordingly, current movement still is bottom bouncing but worthy of close attention.
Published by the Conference Board, the HWA is a reliable leading indicator of employment activity.
Housing Starts -- Seasonally-adjusted May housing starts inched higher by just 0.2%, after a 9.4% increase in April. The unusual volatility in this usually volatile series likely remains due to seasonal adjustment problems. On a three-month moving average basis, March year-to-year change turned negative, showing a decline of 1.7%, down from April's gain of 4.1%. Housing starts is a series at the brink of generating a recession warning signal.
Money Supply -- With revisions, annual money supply growth has flattened out, still generating a solid recession signal. Before inflation adjustment, the year-to-year rates of change in seasonally-adjusted June (four weeks) and May M1, M2 and M3 were 1.9%, 3.5% and 4.7%, and 2.7%, 3.2% and 4.4%, respectively.
Adjusted for CPI inflation, June's M1, M2 and M3 annual year-to-year rates of change were down 1.0%, up 0.6% and up 1.8%, respectively, versus down 0.1%, up 0.4% and up 1.5% in May. On a three-month moving average basis, these annual rates of change were down 0.8%, up 0.6% and up 1.6%, levels that are well underwater using the old-style CPI.
Inflation Indicators
Purchasing Managers Survey (Manufacturing) - Prices Paid -- The May prices paid diffusion index continued declining, falling to 50.5 in June from 58.0 in May. The 50.5 level suggests neutral inflation pressure. On a three-month moving average basis, June's year-to-year change was down 29.6% after May's 22.3% decline.
Published by the Institute for Supply Management (ISM), the prices paid component of the purchasing managers survey is a reliable leading indicator of inflation activity. The measure is a diffusion index, where a reading above 50.0 indicates rising inflation.
Oil Prices -- West Texas Intermediate Spot (St. Louis Fed) soared to a new monthly record average in June, at $56.26 per barrel. That was up 12.9% from May and a highly inflationary 48.0% above June of 2004. Despite any near-term sell-offs and ongoing price volatility, high oil prices will be a major feature of 2005's inflationary recession.
Oil price changes permeate costs throughout the economy, ranging from transportation and energy costs, to material costs in the plastics, pharmaceutical, fertilizer, chemical industries, etc. Where effects of continued oil price volatility will affect CPI reporting, downside oil price movements tend to be picked up more quickly and fully than are upside movements. Even as currently understated, CPI inflation will be stronger than commonly predicted for the next six-to-nine months, partially as a result of continued high oil prices.
U.S. Dollar -- The Shadow Government Statistics' Financial-Weighted U.S. Dollar Index is introduced in this month's Reporting Focus, along with a discussion on trade-weighted dollar measures. Based on dollar exchange rates weighted for respective global currency trading volumes, June's monthly dollar average gained 2.4% from May, following May's 1.4% increase over April. Year-to-year decline slowed to 2.1% in June after May's 5.7% drop.
Showing little meaningful difference with this month's financial-weighted index, June's monthly average of the Federal Reserve's Major Currency Trade-Weighted U.S. Dollar Index rose 1.9% after May's 1.3% increase. June's annual change eased to a contraction of 2.9% following May's 6.3% decline.
Despite the near-term dollar rally, underlying fundamentals remain extraordinarily negative for the greenback. With serious shocks looming in U.S. economic data, heavy selling pressure against the U.S. currency could unfold at any time, with little warning. New record lows for the dollar remain likely in the months ahead, despite near-term bouncing and any official or unofficial supportive intervention by any central bank(s).
Generally, the weaker the dollar, the greater will be the ultimate inflation pressure and the eventual liquidity squeeze in the U.S. capital markets.
TRADE-WEIGHTED U.S. DOLLAR INDICIES
This month, Shadow Government Statistics introduces a new concept in measuring the U.S. dollar's value against the rest of the world. The Shadow Government Statistics' Financial-Weighted U.S. Dollar Index provides a dollar measure that is weighted for global currency trading patterns, in contrast to the popular trade-weighted index that is weighted for trading volume in goods and services. While the financial-weighted and trade-weighted indices have similar components, but different weightings, they still are highly correlated, as would be expected. Nonetheless, the differences between the series have implications for financial market activity.
The general concept behind a trade-weighted currency index is to provide an overall measure of nation's relative currency performance, based on component currencies weighted for respective trade volume between the involved countries. While a number of official and private dollar indices arepublished, the Federal Reserve Board's (FRB) series are examined here.
The most broadly followed trade-weighted index of the U.S. dollar is the FRB's Major Currency Index, which evolved from the FRB's trade-weighted indices developed in the 1970s and is a subset of the FRB's Broad Index.
The current Fed series were introduced at the end of 1998 to handle two circumstances. First was the looming introduction of the euro, the components of which did not coincide with the components of existing indices. Second, the trade weightings used in the earlier indices reflected trading patterns of 1973 and had not been updated in 25 years.
The FRB's Broad Index consists of 26 currencies, where the trade weightings are revised each year, based on the latest trade data. The Fed estimates that the countries of the component currencies account for about 90% percent of total U.S. trade volume. The trade weightings also are geometric as opposed to linear (a concept now used in CPI reporting), where a currency that the goes up in value against the dollar (dollar weakening) automatically receives a lower weighting, while a currency that falls against the dollar (dollar strengthening) gets a higher weighting.
The FRB's Major Currency Index is a seven-currency subset of the Broad Index that includes (with 2003 weighting): euro (34.3%), Canadian dollar (30.0%), Japanese yen (19.3%), British pound (9.4%), Swiss franc (2.6%), Australian dollar (2.3%), Swedish krona (2.1%). The six countries and euro area reflect about 55% of the Broad Index's trade volume.
While trade-weighted indices are reflective of currency exchange rates balanced by trade patterns, the proportionate volume of trade in goods in services does not necessarily reflect capital market and financial flows and foreign exchange trading volume surrounding a particular currency.
The SGS Financial-Weighted U.S. Dollar Index uses currency weightings based on global dollar trading as reported by the Bank for International Settlements(BIS) in its triennial central bank surveys of foreign exchange. The SGS index reflects a financial market participant's view of the dollar, rather than an exporter or importer's view.
The April 2004 BIS survey showed that 88.7% of all global currency transactions involve the U.S. dollar on one side of the exchange. The SGS Index is constructed using the six largest currencies, by volume, that are on the other side of the U.S. dollar transactions. Accounting for 81.4% of all dollar transactions (100.0% of the index), here are the six SGS Index components and their respective weightings: euro (39.1%), Japanese yen (23.1%), British pound (19.1%), Australian dollar (7.0%), Swiss franc (6.1%), Canadian dollar (5.6%).
In terms of components, the difference between the SGS Index and the FRB Major Currency Index is that the SGS Index does not include the Swedish krona.
In terms of weightings, the biggest difference is seen in the Canadian dollar with an SGS weighting of 5.6% versus the FRB weighting of 30.0%. The Canadian weighting differential is spread among the other currencies, with the biggest portion going to the pound.
The SGS Index weightings are linear and are updated every three years with the release of the BIS surveys. The last change of weightings from 2001 to 2004 showed declining weights for the euro, dropping from 41.0% to 39.1%, and the yen, falling from 26.7% to 23.1%, with offsetting gains seen primarily in the pound, rising from 14.5% to 19.1%, and the Australian dollar, increasing from 5.4% to 7.0%.
The accompanying graphs show the comparative SGS Financial-Weighted and the FRB Major Currency Trade-Weighted Indices on a monthly basis. The plot of the index levels is set with both series equal to 100.0 as of January 1985 (the FRB series formally is published using March 1973 equal to 100.0). With current readings of 53.38 (SGS) and 61.13 (FRB), the financial-weighted index stands 12.7% lower than the trade-weighted measure, after 20 years. Since the dollar's relative high in February 1985, the financial-weighted index has lost 48.6% of its value against the trade-weighted index's 40.8% drop.

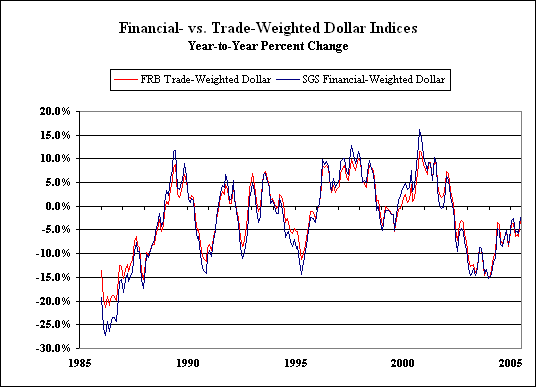
While the correlations are high both in terms of the index levels and year-to-year growth rates, some new information comes from comparing the relative annual changes. An examination of the year-to-year growth chart shows that the financial index tends to overshoot the trade index on both the upside and the downside.
To the extent the growth differences reflect speculative currency flows, the speculative extremes help to mark U.S. dollar turning points. Also, the financial index tends to indicate downside pressure on long-term interest rates when its growth is relatively stronger than the trade index, and tends to indicate upside pressure on interest when the financial growth is relatively slower than the trade growth. Though far from a perfect predictor, when used in conjunction with overall dollar index change, the relative growth differential in the indices improves the accuracy of U.S. dollar measures as financial market indicators.
Full detail of the Federal Reserve's dollar indices is available at the Fed's website www.federalreserve.gov, under statistical releases. Details of the BIS triennial central bank surveys are available from the BIS website at www.bis.org, underpublications and statistics.
-- CONSUMER AND COMMERCIAL CREDIT
Consumer credit, commercial paper and commercial and industrial loans are three series that will be added to regular reporting, starting next month, per subscriber request. As indicators of consumer and business activity, all three series will be highlighted and examined.
August's Shadow Government Statistics is scheduled for release on Wednesday, August 10, 2005. The monthly newsletter regularly is posted the Wednesday following the Friday release of the employment statistics. The posting of the August SGS on the website, as well as any interim alerts, will be advised immediately by e-mail.