February 2006 Edition
JOHN WILLIAMS' SHADOW GOVERNMENT STATISTICS
Issue Number 16
February 9, 2006
_____
Surprising GDP Report Hints At Inflationary Recession
Benchmark Revisions and Seasonal Distortions Keep Other Numbers in Line
Gold and Oil Foreshadow Darker Days for Inflation
The 2005 to 2007 recession almost broke to the surface in the "advance" estimate of fourth-quarter 2005 GDP. In fact the inflation-adjusted annualized growth rate of 1.1% turned to an outright contraction of 0.3% net of a build-up in inventories. Allowing for the built-in biases that inflate GDP reporting by roughly 3.0%, the report was about as honest as the Bureau of Economic Analysis (BEA) has published in a number of years (see Doug Gillespie's "Bravo, Commerce Department...").
If the GDP estimate reflects a return to almost-honest reporting, then the first revision to these data is at high risk of showing even weaker growth. In its advance estimate (primarily a guesstimate) of quarterly GDP growth, the BEA tends to target the consensus forecast, which was around 2.8%. The BEA goes so far as to take its final raw estimate and move it towards the consensus. Accordingly, the first-cut GDP estimate likely was less than 1.1%. Under this circumstance, the first revision tends to move back towards the first-cut, not towards the consensus.
Somehow, though, given the increasing shenanigans last month in reporting at the Bureau of Labor Statistics (BLS), the chances of the dawning of a new era of straight-forward economic reports at this time are nil. Whatever is afoot in the numbers game, whether it is setting up strong GDP growth reports just before the mid-term election, or simply quelling mounting criticism on reporting credibility, the administration's reporting strategy -- assuming there is one -- will become more transparent over the next several months. It is beyond common sense that the current political hacks will allow recession reporting to surface prior to the November election. What almost broke to the surface in the recent GDP reporting most certainly will be beaten back with a club in the months ahead.
In an area of more normal political manipulation of data, the annual benchmark revision to payroll employment turned out to be quite bizarre.

As supposedly finalized last month, the BLS expected to revise unadjusted payroll levels for March 2005 downward by 203,000. The amount ended up to be a downward revision of 158,000, but as shown in the accompanying graph, its application was far from uniform.
The amount of revision was the amount the BLS overstated payroll employment by as of its March 2005 benchmark. Typically, the BLS would assume the error began to build after the last benchmark in March 2004, hit the benchmark number in March 2005 and then continued increasingly to overstate growth, or minimally to have held constant, coming forward to present reporting. Instead, the pattern of actual revisions shows a bowl shape that results from the pattern of applying the revisions to the unadjusted data combined with shifts in seasonal adjustment patterns. Somehow, the BLS's reporting problem largely corrected itself over time.
As a result, the effects of the benchmark were to minimize the impact on current reporting, leaving intact the already reported two million jobs "creation" of the last year that has been so heavily touted by the administration.
Changing population assumptions, as was done in January, is a normal part of estimating unemployment as measured in the household survey. Yet, January's improved unemployment rate cannot be compared to December's reading, because the data were inconsistent. There was a time when the BLS published data both ways so comparisons could be made, but the lack of same, now, does not seem to bother anyone in the financial media.
On the inflation front, the usual, politically-delayed BLS response to a renewed increase in energy prices resulted in December's CPI declining by 0.1%. For example, seasonally adjusted gasoline prices in the CPI declined 2.7% in December, while gasoline station sales rose 0.9% as reported in seasonally-adjusted December retail sales. In contrast, the PPI for the month jumped sharply, rising 0.9% and more than offsetting November's aberrant decline.
With gold and oil prices at historical highs that would cause the knees of most central bankers to knock, and with annual 2005 inflation now official, it is worth a look at where consumer prices are now in historical perspective.
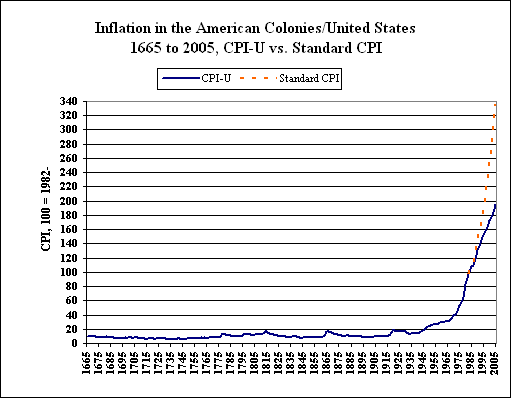
The above graph plots the level of consumer prices during the last 340 years, where Robert Sahr of Oregon State University, using the research of John J. McCusker of Trinity University, San Antonio, Texas, estimated the data for the period 1665 to 1913. The continuing solid line from 1913 to 2005 is the official reporting of CPI-U by the Bureau of Labor Statistics. The dotted line from 1982 to date represents official CPI-U reporting net of methodological changes used during the last two decades to suppress inflation reporting. This "Standard CPI" is as estimated by the BLS in its Consumer Price Index Research Series Using Current Methods (CPI-U-RS) and as applied to the official CPI reporting by Shadow Government Statistics (see the discussion in October 2005 SGS).
The scale of the current inflation problem can overwhelm visually the price volatility of the earlier years. Indeed, the price history up through the founding of the Federal Reserve in 1913 encompasses periods of severe inflation and deflation, with the big price swings tending to offset each other over time. The periods of historical inflation were most intense around wars, including the French-Indian, the American Revolution, the War of 1812, the Civil War and World War I. Then the United States abandoned the gold standard in 1933.
The late-1970s and early-1980s were the timeframe in which the federal government began addressing the inflation problem by monkeying with the reporting methodology. The dotted red line shows what the CPI would have shown through year-end 2005, without the methodological changes. The difference is based on the impact of the methodological shifts as estimated by the BLS.
In general, the broad economic outlook has not changed. The 2005 to 2007 inflationary recession continues to deepen. Recession, inflation and risks of heavy dollar selling are upon us and continue to offer a nightmarish environment for the still Pollyannaish financial markets.
The Shadow Government Statistics' Early Warning System (EWS) was activated in May 2005 and signaled the onset of a formal recession in July 2005. The EWS looks at historical growth patterns of key leading economic indicators in advance of major economic booms and busts and sets growth trigger points that generate warnings of major upturns or downturns when predetermined growth limits are breached. Since the beginning of 2005 a number of key indicators have been nearing or at their fail-safe points, with four indicators moving beyond those levels, signaling a recession. Once beyond their fail-safe points, these indicators have never sent out false alarms, either for an economic boom or bust.
Despite unusually low growth reported for fourth-quarter 2005 GDP, negative GDP growth is not likely to surface in regular government reporting until after the November 2006 election, given the rampant political manipulation of most key government numbers. The National Bureau of Economic Research (NBER) should time the downturn to mid-2005 and announce same also sometime after the election, so as not to be deemed politically motivated in its timing.
Whether or not there is a recession will be a hot topic in the popular financial media early in 2006, with politics helping to fuel the debate as the year progresses. Those Wall Street economists who act as shills for the market will keep up their "strong growth is just around the corner" hype regardless of any and all evidence to the contrary.
From the standpoint of common experience, this downturn will be considered the second leg of a double-dip recession, not an independent contraction as will be claimed officially.
Most economic data have softened, and the trend will accelerate sharply, with regular monthly contractions seen for both payroll employment and industrial production, although political manipulation can keep the payroll data afloat for a while longer. Significant deterioration also will be seen in corporate profits and federal tax receipts. Lower tax receipts will combine with disaster recovery spending and the ongoing war in Iraq to accelerate deterioration in the federal deficit.
This outlook is predicated on economic activity that already has taken place and does not consider any risks from exogenous factors such as renewed terrorist activity in the United States, major natural disasters or a financial panic.
Market perceptions of the downturn in business activity are mixed. When expectations begin to anticipate weak data, expectations also will be lowered for inflation, although stagflation still seems to have gained a foothold in some consensus thinking. Consensus forecasts generally will tend to be surprised on the downside for economic reports and on the upside for inflation reports, for some time to come.
The roots of the current difficulties are structural in nature. A consumer starved of income growth and overburdened with debt cannot sustain the real (inflation-adjusted) growth in consumption needed to keep GDP growth in positive territory. The income weakness is a direct result of the loss of a significant manufacturing base to offshore locations and the ensuing explosive, perpetual growth of the U.S. trade deficit.
Exacerbating economic and financial woes will be unusually high inflation during this contraction. Inflation, fueled by high oil prices, weakness in the U.S. dollar and accelerating Fed monetization of federal debt, will not be brought under control simply by weakness in economic demand. Instead, persistently high prices only will serve to intensify the 2005 to 2007 recession, making it exceptionally long and protracted. Ongoing inflation woes and dollar problems will maintain upside pressure on long-term interest rates, inhibiting the traditional flattening of the yield curve expected with a recession.
Risks of the current circumstance evolving into a hyperinflationary depression remain extraordinarily high.
The unfolding inflationary recession is the worst of all worlds for the financial markets. Particularly hard hit will be the U.S. dollar, with downside implications for both equity and bond prices.
(Each of these series is explored in the background article "A Primer On Government Economic Reports," available on the home page.)
As discussed in this month's opening comments, unusual GDP reporting, heavy manipulation of the benchmark revisions to payroll employment and politics as usual with the CPI offered interesting twists to the latest results of the big three market movers. Despite the soft GDP report, boom-time talk should continue flowing from the administration. The ongoing propaganda blitz has helped to bottom-bounce the President's approval rating coming into the mid-term election year. Accordingly, reported economic results will have less than usual relevance to actual underlying activity, and upcoming reporting still should be determined more by political need than by the economic factors that should drive the results.
Employment/Unemployment -- Thanks to some unusual benchmark revision patterns discussed in the opening comments, January payrolls rose by more than 100,000, but remained shy of market expectations. As usual, the BLS was unable to seasonally adjust successfully the unemployment data as the workforce transitioned from the holiday to the post-holiday season, and the reported unemployment rate fell. Separately, the household data included updated "population controls," which makes the comparisons of inconsistent December and January data meaningless.
The labor data remain largely worthless, as the payroll revisions skewed reporting and did nothing to resolve the obvious reporting problems still surrounding the effects of Hurricane Katrina. The household revisions made the data incomparable, again, while showing that the seasonal adjustments remain consistent distorting factors for the reported data.
The popularly followed seasonally-adjusted unemployment rate U-3 for January fell to 4.69%, down from December's 4.91%, a change just outside the published +/- 0.2% error margin, but the data are inconsistent and properly should not be compared. Unadjusted U-3 unemployment rose to 5.1% in January, from December's 4.6%, while the broader U-6 unemployment measure jumped to 9.2% in January from December's 8.4%. January's seasonally-adjusted U-6 rate, however, eased to 8.4% against December's 8.6%. Including the long-term "discouraged workers" defined away during the Clinton administration, total unemployment remains roughly 12-percent.
Because of the break in the series between December and January, the BLS did not even try to report the monthly change in household employment.
For January, the household survey showed a seasonally-adjusted gain of 193,000 (96,000 net of revisions) +/- 108,000, following December's 140,000 gain (was 108,000). Annual growth in unadjusted January payrolls was 1.57%, up from December's 1.48%.
January's payroll gain of 193,000 included a negative bias of 193,000 jobs from the "net birth/death" adjustment to potential reporting entities, a level reduced from the prior year's downside bias of 280,000.
The latest report was against a background of flat December help-wanted advertising, negative employment trends as reported in the various January purchasing managers surveys, and improved new claims for unemployment insurance (see the respective sections).
Next Release (March 10): Offsetting the impact of sharply slowing economic activity will be the political needs of the administration. While underlying reality would suggest downside surprises to February reporting, favorable seasonals and any needed number massaging should keep jobs growth at or above consensus expectations of 200,000-plus jobs growth in February and beyond. This remains part of an attempted statistical economic "miracle" for the Bush II administration, coming into the mid-term election.
Gross Domestic Product (GDP) -- The "advance" estimate of annualized inflation-adjusted growth for fourth-quarter GDP plunged to 1.12% -- the weakest reading in three years -- from the fourth quarter's robust 4.14%. Year-to-year growth slowed to 3.09% from 3.64%, the softest reading since second-quarter 2003. Final sales -- GDP net of inventory changes -- contracted at an annualized pace of 0.28%, down from 4.56% growth in the third quarter. The GDP inflation rate (deflator) was reported at an annualized 3.02% in the fourth quarter, down from 3.31% in the third. Instead of the typical nonsense, the fourth-quarter GDP report generally was in line with reality, allowing for the extensive upside reporting bias structure built in to the reporting methodology over the last several decades.
Despite this brush with near-standard reporting, these numbers generally are used as political propaganda and usually have little or no relationship to underlying economic reality. Given the long-term upside methodological biases built into the GDP, an actual quarterly contraction of roughly two-percent in fourth-quarter GDP would have been closer to reality.
Next Release (February 28): The "preliminary" estimate revision for fourth-quarter GDP is likely to be a downward revision, as discussed in the opening comments, subject to any major surprises in the December trade deficit. Politics, which still cannot be ignored -- despite the surprisingly "honest" advance report -- would favor an upside revision.
Consumer Price Index (CPI) -- Despite rising energy prices in December, the BLS's tendency to over-report near-term declines in energy prices carried into the month, with the seasonally-adjusted December CPI-U dropping by 0.05% (down 0.40% unadjusted), following November's 0.55% decline (0.80% unadjusted decline). December's annual inflation eased further to 3.42%, down from November's 3.46%.
The "experimental" Chained Consumer Price Index (C-CPI-U), the fully substitution based CPI that presumably is the eventual replacement for current CPI reporting, showed annual inflation holding at 2.79% in December, the same as November's reading.
Adjusted to pre-Clinton methodology, annual CPI growth would be about 6.3% as of December, while the SGS Standard CPI, net of all the methodology changes of the last 30 years that were designed to suppress inflation reporting, stood at 7.2%.
Contrasted with December's 2.2% annual Core CPI-U inflation rate that excludes the necessities of food and energy, the SGS Base CPI-U that includes only the necessities was up 3.7% in December. The SGS rate, however, still suffers the standard CPI-U methodological understatement.
Next Release(February 22): The January CPI and other inflation reports generally should surprise soft consensus forecasts on the upside, with "core" inflation increasingly reflecting the effects of higher energy prices.
Despite occasional one-month swings, annual inflation will remain high and should begin to accelerate to the upside in January and as 2006 progresses. With seasonally-adjusted monthly inflation reported at 0.1% for January 2005, monthly January 2006 inflation above or below that will move the reported annual inflation rate in tandem.
Also pending in the next release are benchmark revisions to historical seasonal-adjustment factors and to weightings of the CPI components.
To varying degrees, most of the following series have significant reporting problems. All series (including the more trouble free) will be addressed in a monthly "Reporting Focus," with this month's analysis exploring the purchasing managers surveys.
In addition to the big three, other series that have been detailed are:
* The Federal Deficit (an original background article, update in the Alert of July 7, 2005, update in Supplement to December 2005 SGS);
* Consumer Confidence (November 2004 SGS);
* The Trade Balance (December 2004 SGS);
* Industrial Production (January 2005 SGS);
* Initial Claims for Unemployment Insurance (February 2005 SGS);
* Retail Sales (March 2005 SGS);
* Alternate Payroll Employment Measures (April 2005 SGS);
* Money Supply (Part I / SGS Early Warning System - May 2005 SGS, Part II - June 2005 SGS, M3 update November 2005 Supplement);
* Financial- and Trade-Weighted U.S. Dollar Indices (July 2005 SGS);
* Short-Term Credit Measures (August 2005 SGS);
* Income Variance/Dispersion (September 2005 SGS);
* CPI (an original background article and October 2005 SGS);
* Help Wanted Advertising (January 2006 SGS).
Federal Deficit -- The official, accounting-gimmicked 2005 deficit (fiscal year ended September 30th) was $318.5 billion, but it was eleven times higher -- at $3.5 trillion -- on a GAAP basis, per the U.S. Treasury (see the December 2005 SGS Supplement). The official, accounting-gimmicked deficit for 2004 was $412.8 billion.
As of December 2005, the third month in fiscal 2006, the twelve-month rolling accounting-gimmicked deficit eased to $319.4 billion from $333.6 billion in November, against $400.7 billion in December 2004.
Separate from the GAAP-based numbers and official deficit reporting, the change in gross federal debt is a fair indicator of actual net cash outlays by the government. As of September 30, 2005, the gross federal debt was $7.933 trillion, up $554 billion from September 2004, which, in turn, was up by $596 billion from September 2003.
The gross federal debt as of January 31, 2006 was $8.196 trillion, up $568 billion from January 2005, which, in turn, was up $619 billion from January 2004.
Going forward, the official federal deficit will inflate quickly, as government finances suffer tax revenue losses from the intensifying recession. While GDP growth estimates can be gimmicked, incoming tax receipts will remain an independent estimate of underlying economic reality.
Initial Claims for Unemployment Insurance -- Annual growth in initial claims swung into negative territory (an economic positive), although the improvement was tied to the expiration of certain extended benefits. On a smoothed basis for the 17 weeks ended January 28th, annual change fell to a 4.5% contraction following December 31st's annual growth rate of 2.9%.
The volatility of the seasonally-adjusted weekly numbers is due partially to the seasonal-adjustment process. When the series is viewed in terms of the year-to-year change in the 17-week (three-month) moving average, however, such is a fair indicator of current economic activity.
Real Average Weekly Earnings -- December's real earnings rose by 0.1% following November's gain of 0.8% (was 0.6%). December's real earnings still fell 0.4% from the year before, after November's 0.2% (was 0.4%) decline.
Volatility in this series comes primarily from variations in reported CPI growth, and positive monthly growth in the last three months has been due to declining inflation, a situation that is about to reverse. Allowing for the biases built into the CPI-W series used in deflating the average weekly earnings, annual change in this series signals continuing recession.
Retail Sales -- December's seasonally-adjusted monthly retail sales rose by 0.7% +/- 0.7% (1.1% net of revisions), following November's 0.8% gain (was 0.3%). The 0.9% gain in gasoline station sales was despite a seasonally adjusted 2.7% decline in gasoline prices per the CPI.
Inflation-adjusted year-to-year growth in retail sales below 1.8% (using the official CPI-U for deflation) signals recession. December's annual growth on that basis was 2.9%, down from November's 3.3% and up from October's 1.7%. As CPI reporting resumes its upward cycle, real annual retail sales will fall gain below its recession threshold, signaling recession.
Next Release (February 14): January retail sales should come in below expectations, reflecting declining economic activity.
Industrial Production -- Seasonally-adjusted December production rose by 0.6% (0.7% net of revisions), after November's 0.8% gain, which had been reported previously at 0.7%. The December gain was attributable largely to continued Gulf Coast recovery in energy-related facilities and an unseasonable surge in utility usage, while manufacturing was up just 0.2%. Year-to-year growth generally has slowed since the December 2004 near-term peak of 4.4%, with December 2005 annual growth at 2.8% versus 2.9% (was 2.8%) in November.
Next Release (February 15): Industrial production increasingly should mirror the recession, entering a series of regular monthly contractions, once the Gulf Coast distortions have run their course. Upcoming reports will tend to surprise market expectations on the downside.
New Orders for Durable Goods -- Seasonally-adjusted new orders for durable goods rose by 1.3% (2.3% net of revisions) in December, following November's 5.4% increase (was 4.4%). Year-to-year growth in December orders was 13.7% versus November's 12.9%. The widely followed nondefense capital goods orders eased 0.6% in December, following November's 22.2%% surge, which had been spiked by aircraft orders.
Durable goods orders once was one of the better leading indicators of broad economic activity, when smoothed using a three-month moving average. After the semi-conductor industry stopped reporting new orders, however, the series' predictive ability suffered a serious setback.
Trade Balance -- The seasonally-adjusted November deficit in goods and services eased back to $64.2 billion, after having set successive monthly records of $66.0 billion in September and $68.1 billion in October. Any data-flow disruptions or trade disruptions related to the hurricanes should be through the system by now.
Next Release (February 10): The December trade deficit should show some deterioration relative to November. Any significant deterioration will add downside pressure to the first revision of fourth-quarter GDP growth. Irrespective of the December number, upcoming deficits will continue to surge beyond consensus forecasts, with new record monthly deficits following in the months ahead.
Consumer Confidence -- January Consumer confidence was mixed, with annual growth still lingering in recession territory. The Conference Board's consumer confidence index gained 2.4% after December's 5.6% jump, while the University of Michigan's consumer sentiment measure eased 0.3% following December's 12.1% gain.
On a three-month moving-average basis, the Conference Board and University of Michigan January readings showed a respective annual gain of 2.7% and contraction of 7.4%, against December's contractions of 0.3% and 12.5%. These lagging, not leading, indicators are signaling that the economy has remained in recession.
Short-Term Credit Measures -- Annual growth in short-term credit measures for businesses remained strong, holding in double digits, while annual growth in consumer credit continued to slow markedly, with annual growth at three percent.
Seasonally-adjusted consumer credit has shown a serious slowdown, with December consumer credit up just 0.2% from November and still shy of September's high. Annual growth slowed from September's 4.3% to 3.0% in October, 3.1% in November and 3.0% in December. Without growth in income, growth in personal consumption can be supported short-term only by debt expansion or savings liquidation, and debt expansion is faltering.
Annual growth in commercial paper outstanding rose to 19.8% in January, up from 18.6% in December. Annual growth in commercial and industrial loans was 13.0% in December, following a 12.9% annual gain in November. Rising sales can fuel short-credit needs, but so too can slowing sales, slowing collections and rising inventories.
Producer Price Index (PPI) -- The seasonally-adjusted December finished goods PPI jumped by 0.9% (0.3% unadjusted), following November's 0.7% decline. Annual PPI inflation rebounded to 5.4% in December, up from November's 4.4%.
Next Release (February 17): Despite a large component of random volatility in monthly price variations, PPI inflation reporting over the next several months should, in tandem with the CPI, top market expectations. Inflation should be stronger than consensus forecasts increasingly in the "core" inflation measures. Also pending are benchmark revisions to PPI seasonal adjustments of the last five years.
Purchasing Managers Survey (Non-Manufacturing) -- As discussed in this month's "Reporting Focus," there is nothing unusually wrong with this survey of the service industry, except it does not have much meaning. Unlike its older counterpart, the manufacturing survey, if service companies such as law firms, hospitals or fast-food restaurants have "increased orders," that does not necessarily mean that economic activity is increasing.
The overall January index fell by 6.9% to 56.8, from an upwardly revised reading of 61.0 in December, thanks to the Commerce Department revising its seasonal factors for the purchasing managers surveys. The index is a diffusion index, where a reading above 50.0 indicates a growing service economy, in theory. Both the employment and prices paid components, however, have some meaning.
The January employment component tumbled to 51.1 from 56.9 in December, suggesting an employment downturn in the service sector.
The prices paid component diffusion index is a general indicator of inflationary pressures. The January reading was unchanged at 67.2, a level that remains highly inflationary. On a three-month moving average basis, the annual change in January was a decline of 1.6%.
The following numbers are generally good-quality leading indicators of economic activity and inflation that offer an alternative to the politically-hyped numbers when the economy really is not so perfect. In some instances, using a three-month moving average improves the quality of the economic signal and is so noted in the text.
Economic Indicators
Purchasing Managers Survey (Manufacturing) - New Orders -- The January new orders index declined for the third consecutive month, easing 0.9% from 58.5 to 58.0. The measure breached its fail-safe point a number of months back, generating an SGS early warning indicator of pending recession.
The Commerce Department just revised its suspect seasonal factors for the series, and the resulting adjusted monthly numbers can be misleading in the reporting of month-to-month change. This problem is overcome by using year-to-year change on a three-month moving average basis. On that basis, the January index fell by 4.1%. The index gradually has notched lower from its peak annual growth of 36.6% in April of 2004, but then showed something of an uptrend that lasted several months.
Published by the Institute for Supply Management (ISM), the new orders component of the purchasing managers survey is a particularly valuable indicator of economic activity. The index is a diffusion index, where a reading above 50.0 indicates rising new orders. The overall January ISM index softened again, falling to 54.8 from December's 55.6. An index level of 50.0 divides a growing versus contracting manufacturing sector. The January employment component fell to 51.3 from 53.6.
See this month's "Reporting Focus" for further background on the series.
Help Wanted Advertising Index (HWA) -- The December help-wanted advertising index held constant at 39.0 versus November. Annual growth on a three-month moving-average basis slowed from 5.5% in November to 1.8% in December. At best, the series has continued to bottom bounce since the onset of the last recession.
Housing Starts -- December housing starts tumbled 8.9% after November's 3.4% gain. Year-to-year, December starts were down 5.7%. On a three-month moving average basis annual growth slowed to 3.7% from November's 10.0%, once again at the brink of generating a recession warning signal.
Money Supply -- Annual money supply growth has shown solid indications of recession for months, but the acceleration in both real and nominal M3 growth has moved that indicator into neutral-to-positive territory. Nonetheless, the recession signal was generated, and it always has been followed by a major downturn. Movement into neutral territory does not signal an economic upturn, as positive real growth in M3 does not regularly translate into positive economic growth. It often, however, is a harbinger of rising inflation.
In the realm of the soon-to-disappear M3, annual growth rose to 8.0% in January (four-week average) from 7.8% in December. In contrast, the surviving M2 number showed January annual growth picking up to 4.7% from 4.0% in December, still showing recession pressures net of inflation adjustment. These numbers reflect the recent benchmark revisions to the money supply series.
Before inflation adjustment, M1, M2 and M3 monthly changes for January (preliminary estimate based on four weeks of data) versus December were up 0.3%, 0.8% and 0.8%, versus down 0.1%, up 0.4% and 0.8% respectively. Year-to-year rates of change in seasonally-adjusted January and December M1, M2 and M3, respectively, were up 0.4%, 4.7% and 8.0% versus down 0.2%, up 4.0% and 7.8%.
Adjusted for CPI inflation, January's M1, M2 and M3 annual year-to-year rates of change were down 3.1%, up 1.0% and 4.2%, respectively, versus down 3.5%, up 0.6% and 4.2% in December. On a three-month moving-average basis, the January annual rates of change were down 3.4%, up 0.7% and up 4.1%, levels, except for M3, that remain well underwater using the old-style CPI.
Inflation Indicators
Purchasing Managers Survey (Manufacturing) - Prices Paid -- The January prices paid diffusion index rose to 65.0 from 63.0 in December, remaining in strong inflation territory. On a three-month moving average basis, January's year-to-year change was down 6.0%.
Published by the Institute for Supply Management (ISM), the prices paid component of the purchasing managers survey is a reliable leading indicator of inflation activity. The measure is a diffusion index, where a reading above 50.0 indicates rising inflation, as discussed in this month's "Reporting Focus."
Oil Prices -- West Texas Intermediate Spot (St. Louis Fed) continued its rise in January, averaging $65.51, an all time high. The January average was up 10.2% from December's $59.43. Oil prices persist at highly inflationary levels, with January's average price up 39.9% from January 2005, versus December's 37.2% annual gain. These increased prices will be reflected shortly in the purchasing managers surveys and eventually in the CPI and PPI inflation series.
Spot prices have and will continue to gyrate. Despite ongoing near-term price volatility, high oil prices will continue as a major contributing factor to the inflation side of the current inflationary recession. Oil price changes permeate costs throughout the economy, ranging from transportation and energy costs, to material costs in the plastics, pharmaceutical, fertilizer, chemical industries, etc. Anecdotal evidence remains strong that cost pressures have already passed into the so-called "core" inflation sectors.
Oil price volatility affects CPI reporting. Downside oil price movements tend to be picked up more quickly and fully by the BLS in its inflation measures than are upside movements, as was seen in both the November and December CPI. Even as currently understated, CPI and PPI inflation should be much stronger than commonly predicted for the next six-to-nine months, partially as a result of continued high oil prices.
U.S. Dollar -- The Shadow Government Statistics' Financial-Weighted U.S. Dollar Index is based on dollar exchange rates weighted for respective global currency trading volumes. January's monthly dollar average declined by 1.8% following December's 0.6% drop. January's year-to-year gain softened to 6.3% from December's 9.7%.
In like manner, January's monthly average of the Federal Reserve's Major Currency Trade-Weighted U.S. Dollar Index fell by 1.6% following December's 0.9% decline. January's rate of annual change also slowed from a gain of 7.1% in December to 4.2% in January.
Dollar trading in early February has been slightly to the upside of the January average. The relative strength in the financial- versus trade-weighted dollar, however, still remains at a level that usually precedes a major dollar sell-off.
Underlying fundamentals remain extraordinarily negative for the greenback. With serious shocks still looming in U.S. economic and fiscal data, heavy selling pressure against the U.S. currency could break at any time, with little warning. New record lows for the dollar still remain likely in the months ahead, despite any overt or covert supportive intervention by any central bank(s).
Generally, the weaker the dollar, the greater will be the ultimate inflation pressure and the eventual liquidity squeeze in the U.S. capital markets.
Once known as the Purchasing Managers Association, the now Institute for Supply Management (ISM) has been publishing a survey of its members' business conditions on a monthly basis since 1948. What still is commonly known as "the purchasing managers survey" has been a reliable and independent measure of activity in the manufacturing sector for nearly sixty years.
In the late-1990s, a similar survey was started of purchasing managers in the service industry, but aside from indications of inflation and employment pressures, the results appear to have little predictive value against the broad economy. Accordingly, this focus is on the manufacturing survey, though much of what is covered also applies to the non-manufacturing survey.
The purchasing managers survey is constructed from member responses to simple up/down questions on individual business conditions. Each participant gets an equal weighting in the construction of ISM's diffusion index.
A diffusion index measures the responses to a question of whether orders, for example, are "up," "down" or the "same." The index is constructed taking the percentage of responses that are "up" plus one-half the percentage of the responses that are the "same." Correspondingly, a reading of 50.0% or higher is a positive reading, below 50.0% is taken as a negative.
The traditional components, which are included in the overall index, and for which separate diffusion indices are calculated are: New Orders, Production, Employment, Supplier Deliveries, Inventories, Prices, Backlog of Orders.
Strong new orders, production, employment and prices are all taken as indicators of positive economic activity. Slowing supplier deliveries, falling inventories and a rising backlog of orders, also are taken as positive economic indicators, and the answers are categorized accordingly.
The overall index is a composite of the sub-indices, which, except for prices, get seasonally adjusted by factors determined by the Commerce Department. The seasonals are updated and revised annually.
The purchasing managers survey has been published for as long as the GNP/GDP series, but it has a much longer history of consistent reporting than any government series.
A purchasing managers survey reading below 50.0 used to mean the broad economy was in recession. As methodology changes altered GNP and GDP so as to inhibit the reporting of negative growth, a reading in the purchasing managers survey below 50.0 was redefined to mean the manufacturing sector was in contraction. It is rare for the manufacturing sector to be in recession, without the broad economy moving in tandem or closely behind.
Accordingly, SGS uses the New Orders component of the index, in particular, as a reliable leading indicator of broad economic activity, on both the upside and downside as discussed in the May 2005 SGS.
Money Supply M2 As A Leading Economic Indicator
With M3 abandoned by the Federal Reserve, M2 will be the broadest money measure available for standard economic analysis. While it is not as strong an indicator as M3, particularly as to indicating monetary inflation pressures, it does generate reliable signals of pending recessions. It also is the money measure used in the traditional leading economic indicators. M2 will replace M3 as a key leading SGS indicator of economic activity.
This still-pending supplement continues to take much longer than had been planned. Its publication should follow in the next month or so. Once published, it will complete the introduction of SGS's alternative CPI measure, the SGS Standard CPI, including the formal reporting methodology, first reporting results and a reconstructed historical data base that will link back to pre-Jimmy Carter official CPI reporting. The release date will be announced as soon as possible.
March's Shadow Government Statistics is scheduled for release on Wednesday, March 15, 2006. The monthly newsletter regularly is scheduled for posting on the Wednesday following the Friday release of the employment statistics. The posting of the next SGS on the website, as well as any supplements or interim alerts, will be advised immediately by e-mail.