October 2006 Newsletter
Issue Number 24
October 30, 2006
__________
Collapsing Economic Activity Shows Accelerating Recession
Twisted Inflation Plunge Will Reverse Post-Election
Is Fed Controlling Manipulations?
U.S. Productivity Has Been Falling Since NAFTA
Stock Market Euphoria Should Falter as Gold and Oil Prices Rebound
Major Dollar Selling and Higher Interest Rates Still in Offing
The broad outlook for a deepening inflationary recession remains in place. The drop-off in economic activity indicated by recent reporting is nothing short of extraordinary. Recession speculation should increase markedly. Also, the plunge in CPI inflation was to be expected, given the recent drop in energy prices and year-ago comparisons with hurricane effects. While the inflation downturn will be very short-lived, economic activity is going to get a great deal worse.
With the completion of the election cycle next Tuesday, pressures for immediate political gratification from economic reporting will abate and financial-market concerns will move to center stage in economic reporting. Financial-market issues may have been more of a recent driving force behind the reporting of key data than I expected, as discussed below. Keep in mind that for the parts of the electorate, financial-market stability also is an important issue. Consider recent historic highs in the Dow Jones Industrial Average, for example.
Nevertheless, despite any gimmicked reporting and happy propaganda out of Washington, the economy is weakening and in enough trouble to give political incumbents trouble. That should be bad news for Republican hopes of maintaining control of Congress.
Collapsing Economic Activity. The reported weakness in retail sales, industrial production, housing, help-wanted advertising, the purchasing managers survey and GDP, and the record level of the monthly trade deficit, were near catastrophic in some instances.
Economic series such as employment, industrial production and retail sales, which took hits last year from Hurricane Katrina, should have shown sharp increases in annual growth. Instead these series showed slowing annual growth or minimal gains, while the monthly changes were much weaker than consensus forecasts: production and retail sales had sharp monthly declines; employment was well below expectations. These September reports look like they had taken a hit greater than that seen in the impact of last year's devastating hurricanes, only there were no natural catastrophes to account for the devastation.
Also taking new plunges in terms of level or annual growth were the various housing series and help-wanted advertising. As shown in the following graph, help-wanted advertising now has hit a low that has not been broken since Sputnik opened the Space Age.
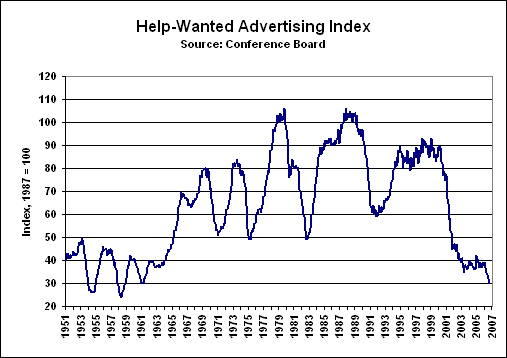
The series is suggestive of the official 2000 recession and the current circumstance as being two downlegs in a double-dip recession.
Also moving lower -- with employment already at a recession level -- the purchasing managers manufacturing index looks like it finally is about to break below 50.0, confirming a contracting manufacturing sector.
The August trade deficit exploded anew, and it did some damage to GDP reporting. The government's advance estimate of third-quarter real (inflation-adjusted) growth slipped to 1.6% from 2.6% in the second quarter, the weakest annualized growth reported since first-quarter 2003. As discussed later, both the second and third quarters now have growth rates that are statistically indistinguishable from contraction. Eventually, revisions should take those quarters negative, providing a clear recessionary pattern even as reported by the Bureau of Economic Analysis (BEA).
The current sharp decline in underlying economic activity is enough to have a number of consensus economists starting to look for a real GDP contraction.
Inflation Twists and Turns. On the inflation front, the CPI reporting was unusually twisted, showing flaws in methodological gimmicks introduced during the Clinton Administration, in addition to some of the more-regular games playing.
While the sharp monthly and annual declines in September CPI were due to declining energy prices and year-ago comparisons with hurricane-induced price spikes, those patterns will reverse before year-end.
The Bush II Administration also showed its hand in these data, once again picking up declining energy prices in CPI reporting much more rapidly than it has when energy prices were rising.
The strangest reporting, though, involved the CPI-U and C-CPI-U. The first measure is the widely followed CPI number, which has its components aggregated using a geometric weighting. With a geometric weighting, a lower price automatically increases a components weight. The CPI no longer is a fixed market basket of goods with an arithmetic weighting, as it had been when the CPI became popular as a cost-of-living adjustment measure in early labor union contracts.
The second measure is the chain-weighted CPI that eventually is going to replace the CPI. As discussed in the SGS background article on inflation (see home page www.shadowstats.com), the weightings in this index are based on actual purchase patterns of consumers, and weightings shift as consumers substitute hamburger for more expensive steak.
In theory, the C-CPI inflation always should be weaker than the original CPI, and also supposedly the current CPI. Yet, in September's reporting, the C-CPI showed annual inflation of 2.17%, which was higher than the CPI's 2.06%. This was the first such occurrence. What went awry? The difference is in the weighting. The CPI's geometric weighting, which never had a good basis in theory, appears to be working somewhat better than anticipated in artificially reducing inflation.
Rumblings on Fed Data Manipulation. It is not just the March 2006 elimination of M3 reporting, or the extraordinary revisions to the Fed's Flow of Funds Data discussed in this month's Reporting/Market Focus, or the unusual reporting patterns that surfaced earlier this year in industrial production. There are stories surfacing of Federal Reserve phone calls to the Census Bureau directing how certain economic series should be reported.
Up front, we cannot confirm the accuracy of these stories, yet. They are mentioned as a heads-up to subscribers that some of what has been going on in recent economic reporting may be more closely tied to Fed efforts to manipulate the financial markets -- to prevent a financial panic -- than they were to aiding Republican election prospects. Such manipulations may fall under the purview of the much-maligned Plunge Protection Team (PPT). The PPT, which was created by President Reagan after the 1987 crash, has been receiving a fair amount of press recently. It is controlled primarily by the Treasury Secretary (recent head of Goldman Sachs) and the Fed Chairman. We hope to have more detail next month, or in an intervening Alert.
Alternate Realities. In general, if a government economic measure does match common public experience, it has little use outside of academia or the spin-doctoring rooms of the Fed and Wall Street. This section regularly will cover the Shadow Government Statistics (SGS) alternate measures of official CPI and GDP reporting. The methodologies for the series are discussed in the August 2006 SGS. Effects of gimmicked methodological changes have been removed from the official series so as to reflect more accurately the common public experience, as embodied by the post-World War II CPI and the pre-Reagan-Era GDP.
The alternate third-quarter GDP growth reflects the "advance" estimate with many of the methodological gimmicks of recent decades removed. The alternate third-quarter inflation-adjusted annual (year-to-year) GDP growth rate is a decline of roughly 1.5% versus the official 2.9% gain.
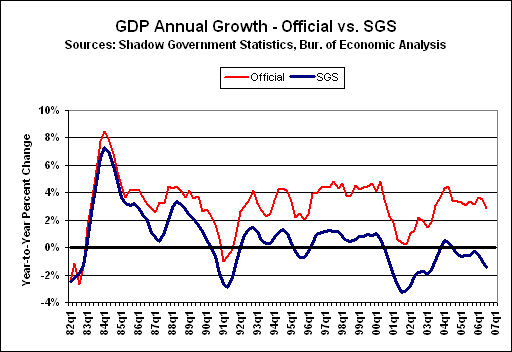
[Note: Historical data on both the official and SGS-Alternate GDP series are available for download on the Alternate Data page of www.shadowstats.com.]
Of continued discomfort to the low-inflation hypesters -- those continually touting "core" inflation -- the gimmicked annual core inflation rates keep notching higher, month after month, as oil prices continue to permeate broad economic activity.
                          Eight Levels of Inflation
                   Annual Inflation for June to August 2006


          Measure                                 Jul    Aug    Sep
          I-1 Core PCE Deflator                   2.3%r  2.5%   n.a.
          I-2 Core C-CPI                          2.5%   2.7%   2.7%
          I-3 Core CPI-U                          2.7%   2.8%   2.9%
          I-4 PCE Deflator                        3.4%   3.2%   n.a
          I-5 C-CPI                               3.5%   3.4%   2.2%
          I-6 CPI-U                               4.1%   3.8%   2.1%
          I-7 Pre-Clinton CPI-U                   7.3%   7.0%   5.2%
          I-8 SGS Alternate Consumer Inflation   10.9%  10.1%r  9.4%


          (r) Revised.
          Notes: I-1 to I-3 reflect the core inflation rates, respectively,
          of the substitution-based personal consumption expenditure (PCE)
          deflator, the Chained-CPI-U and the geometrically-weighted CPI-U.
          I-4 to I-6 are the same measures with energy and food inflation
          included. The CPI-U (I-6) is the measure popularly followed by
          the financial press, when the media are not hyping core inflation.
          I-7 is the CPI-U with the effects of geometric weighting (Pre-
          Clinton Era as estimated by SGS) reversed. This is the top series
          in the CPI graph on the SGS home page www.shadowstats.com.
          I-8 reflects the SGS Alternate Consumer Inflation measure, which
          reverses the methodological gimmicks of the last 25 years or so,
          plus an adjustment for the Clinton-Era geometric weighting that is
          not otherwise accounted for in BLS historic bookkeeping.
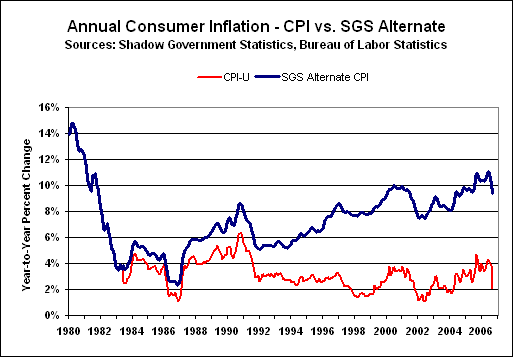
[Note: Historical data on both the official and SGS-Alternate CPI series are available for download on the Alternate Data page of www.shadowstats.com.]
In general, the broad economic outlook has not changed, but the financial markets -- particularly equities -- are increasingly irrational. As a result, a deepening recession with uncontained inflation will threaten financial-market stability. Underlying economic reality should gain broader recognition quickly as the accelerating deepening of the 2005 to 2007 (likely 2008) inflationary recession continues to surface in reporting of the next several months.
A contracting economy, inflation and risks of intensifying dollar selling are upon us and continue to offer the worst of all environments for the equity and credit markets. On the bright side, of course, is the gold market, where the traditional inflation-hedge and flight-to-safety/quality vehicle will continue earning its keep -- shy of irregular volatility -- as the dollar weakens, inflation accelerates and the global political situation continues to deteriorate.
The Shadow Government Statistics' Early Warning System (EWS) was activated in May 2005 and signaled the onset of a formal recession in July 2005. The EWS looks at historical growth patterns of key leading economic indicators in advance of major economic booms and busts and sets growth trigger points that generate warnings of major upturns or downturns when predetermined growth limits are breached. Since the beginning of 2005, when a number of key indicators had been holding near or at their fail-safe points, seven of those indicators have moved beyond those levels, signaling a recession.
Retail sales, help-wanted advertising and housing starts generated such signals in the last several months. Once beyond their fail-safe points, these indicators never have sent out false alarms, either for an economic boom or bust.
The false economic boom massaged into first-quarter GDP reporting was a precursor to the overstatement of, albeit slowing, second- and third-quarter GDP growth. The reported annualized real growth rates of 2.6% and 1.6% for the second and third quarters both should have been contractions. Irrespective of underlying reality, negative GDP did not surface in regular government reporting before the November election. Negative reporting still could be seen in the next couple of quarters, and there remains the possibility that the recent quarters could turn negative after benchmark revisions. The National Bureau of Economic Research (NBER) eventually should time the downturn to mid- or late-2005. Stories of discussions of a possible Recession Dating Committee meeting already have surfaced.
Whether or not there is a recession increasingly is a hot topic in the popular financial media. Those Wall Street economists who act as shills for the market will keep up their "strong growth is just around the corner" hype regardless of any and all evidence to the contrary.
>From the standpoint of common experience, this downturn will be considered the second leg of a double-dip recession, not an independent contraction as will be claimed officially.
Most economic data have softened, with the trend accelerating. Regular monthly contractions are near for both payroll employment and industrial production, although political manipulation can keep the official payroll and production data afloat for a while longer. Significant deterioration also will be seen in corporate profits and federal tax receipts, despite any near-term volatility to the contrary. Depressed tax receipts will combine with negligible fiscal discipline and ongoing war spending to accelerate deterioration in the federal finances.
This general outlook is predicated on economic activity that already has taken place and does not consider any risks from exogenous factors such as renewed terrorist activity in the United States, world war, major natural disasters or a financial panic.
Market perceptions of the downturn in business activity are increasing sharply. As expectations begin to anticipate weak data, traditional expectations also are being lowered for inflation, despite the obvious ongoing oil problem. Worsening stagflation, however, seems to have gained a good foothold in some consensus thinking. Still, consensus forecasts generally will tend to be surprised on the downside for economic reports and on the upside for inflation reports, for some time to come.
The roots of the current difficulties are structural in nature. A consumer starved of income growth and overburdened with debt cannot sustain the real growth in consumption needed to keep GDP growth in positive territory. The income weakness is a direct result of the loss of a significant manufacturing base to offshore locations and the ensuing explosive, perpetual growth of the U.S. trade deficit.
Exacerbating economic and financial woes will be unusually high inflation during this contraction. Gold prices already have signaled inflation and other difficulties. Fueled by high oil prices, weakness in the U.S. dollar and accelerating Fed monetization of federal debt, inflation will not be brought under control simply by weakness in economic demand. Instead, persistently high prices only will serve to intensify the recession, making it exceptionally long and protracted. Ongoing inflation woes and dollar problems will maintain upside pressure on long-term interest rates, reversing what still is an inverted yield curve that some view as a recession signal.
Faltering economic activity and mounting inflation have created a nightmarish conundrum for the political operatives at the Federal Reserve. Soft economic numbers and high inflation had been spun as "conflicting data," but an inflationary recession is in play, and there is little the Fed can do about it. The recent one-month lull in inflation was due to factors well outside the domain of Federal Reserve activity.
The hype given to the investing public -- that a weak economy means low inflation and interest rates -- cannot work in the current environment. Any conflicts that arise are not in the economic data but in simplistic views on economic activity espoused by Wall Street, or in the statistical manipulation goals of the politicians. Those latter issues explain Fed Chairman Bernanke's continued tap dancing on the inflation outlook. Such is anchored in putting a positive spin on an impossible situation and avoiding a financial-market meltdown for as long as possible. The markets have been reasonably cooperative, so far.
In the present circumstance, inflation driven by robust economic demand would be a happy event, but such is not to be. Rather, the purchasing power of the U.S. dollar is being lost to wasting diseases, eroded by foreign exchange weakness in the trade-deficit plagued greenback, malfeasance in domestic fiscal and monetary policies, and external disruptions such as cartel-orchestrated price surges in oil. All the latter factors are in play.
>From the Federal Reserve's perspective, at present, mixed signals are the best that can be offered to the markets. Allowing for the possibility of renewing the faux "tightening" signals Mr. Bernanke's devotion to keeping inflation under control. The Fed's soon to be short-lived "pause" in hiking interest rates signals Mr. Bernanke's devotion to maintaining solid economic growth. While the games playing may keep market sentiment gyrating for a while, the Fed is in an untenable position. Raising rates will do little to contain a non-demand driven inflation, while holding or lowering rates will do little to stimulate the structurally-impaired economy. The current "pause" in the Fed's raising short-term interest rates likely will not survive the end of 2006 or early 2007.
>From the standpoint of the federal government, traditional economic stimuli in the form of tax cuts or increased federal spending have reached their practical limits with the current budget-deficit excesses.
Due to the inability of the government or central bank to stabilize this environment, risks of the current situation evolving into a hyperinflationary depression are extraordinarily high. Such a development involving the world's reserve currency would lead to a collapse of the current global currency system. In order to regain public confidence, monetary authorities likely would structure gold into the base of any new international currency system.
The unfolding inflationary recession is the worst of all worlds for the financial markets. Particularly hard hit will be the U.S. dollar, with significant downside moves looming for both equity and bond prices. Despite recent extreme volatility, the price of gold is headed much higher. At such time as the system re-stabilizes, post-crisis, there will be exceptional investment opportunities for those who have been able to preserve their wealth, capital and liquidity.
The Federal Reserve keeps playing its games, trying to be non-disruptive to the financial markets. Matching market expectations, the FOMC held rates steady, again, last week, but the "pause" will prove to have a very limited life span in the months ahead. Renewed inflation pressures and intensifying dollar weakness could have the markets looking for rate hikes as early as the December 12th FOMC meeting, and very likely at the meeting or two that follow.
The drop in inflation largely will reverse by year-end, just given catch-up on the year-ago distortions. With the economy tumbling, ongoing hype of a cleverly orchestrated soft landing should vanish quickly. The economy has crashed, and there is not much the Federal Reserve can or could have done about it. The deepening recession should show up in generally weaker-than-expected corporate profits. Post-election Middle Eastern tensions are likely to mount, along with renewed upside pressure on the price of oil. If this happens, gold would rebound at the same time.
In terms of the broad financial market picture through year-end, the U.S. dollar should sell off sharply on a trade-weighted basis and particularly against the Swiss franc. As a partial result of the mounting dollar and inflation difficulties, the domestic yield curve will turn positive and steepen sharply, due primarily to rising long-term interest rates. This is a trend that will flow through into the new year.
The combination of softer profits, a weak dollar and higher interest rates likely will not play out happily for equities. Renewed concerns tied to the dollar, inflation and global instabilities suggest an upbeat year-end for the precious metals, despite recent mixed pressures.
Equities -- The stock market generally has done well recently, with the Dow Jones Industrial Average making historical highs. That said, most other indices, though gaining sharply, still are shy of their all-time highs. In particular, the Dow Jones Wilshire 5000 -- the broadest index available on U.S. stocks -- is still more than 6% shy of the mark.
Nonetheless, the market hype is extraordinary, with expectations of a passive-to-accommodative Fed, contained inflation, a soft economic landing and a relatively tranquil global and domestic political circumstance. None of these props underlying equities will be long-lived.
News on the hard economic landing already is breaking, and the election still looks like a losing proposition for the market-favored Republicans. The timing on the reversal of other factors should follow the election, but they could break sooner.
Particularly damaging to current market irrationality will be the terrible dollar tumble ahead. Liquidity problems resulting from that will tend to push long-term yields higher and equity prices much lower. The dollar's sell-off could begin at any time with little warning.
Credit Markets -- Contrary to all the hoopla over lower oil and gasoline prices, inflation is far from peaking, although the CPI took a heavy hit in September. Inflation concerns will return after the election. By early 2007, the Fed will be looking at further interest rate hikes in defense of the U.S. dollar and ostensibly to fight inflation. Barring a stock-market crash, the U.S. central bank will not be shifting to an easing stance to stimulate the stock market or the economy.
For those who think otherwise, consider that the FOMC had in hand the September inflation data and knew of the pending unusually weak GDP growth at the time of last week's meeting. Still, the inflation cautions remained in the press release.
Underlying fundamentals continue to indicate that long-term interest rates are headed sharply higher by the end of the year and into 2007. This move in rates will be dominated by rising inflation, by a weakening dollar and by foreign investors increasingly moving their assets out of dollar-denominated instruments. Long rates are being driven by the dollar, not inflation, at the moment, but both the dollar and inflation will key in the rate spike ahead.
A number of factors drive interest rate movements, including economic activity, inflation, credit demand, political stability and relative dollar strength and accompanying cash inflows and outflows from abroad. The recession will offer major downside pressure on rates, but inflation and the dollar will provide the dominant upside pressures on rates.
The yield curve on Treasuries has turned slightly more negative, with higher yields since the last newsletter. The constant maturity 10-year yield is at 4.70%, with the 3-month bill yield at 5.12%, levels that overall are about 5 to 20 basis points higher than one month ago. An added couple of hundred basis points at the long end still will do a great deal towards flipping the yield curve to a fairly normal positive slope. The inverted yield curve is tied more to the heavy foreign purchases of U.S. Treasuries than it is to recessionary expectations.
U.S. Dollar -- On average, the U.S. dollar strengthened in September and early October, but appears to be on the brink of faltering anew, as the U.S. recession and inflation problems gain broader recognition outside the United States. Circumstances have not been helped by the ongoing "pause" in Fed policy, and the election still likely to threaten Republican control of Congress is not a dollar plus. Then you have Mr. Greenspan in the wings talking up the euro as an alternate reserve currency to the U.S. dollar.
The dollar's potential tumble keeps getting pushed back, but very negative and disorderly markets await the greenback. As the downturn in the value of the U.S. currency begins in earnest and then accelerates, fallout in the credit and equity markets should not be pleasant.
Underlying fundamentals remain so bad, they only could be marginally worse. Driving relative currency values are relative conditions in domestic economic activity, inflation, interest rates, government financial conditions and political stability. Though not fully recognized, all these factors for the United States -- relative to its major trading partners -- are negative. The U.S. economy is in a recession that is gaining recognition; inflation is spiking, despite the near-term September gyration; and interest rates are rising abroad, while the Fed -- at least temporarily -- has stopped raising rates at home. The actual U.S. federal deficit is beyond containment, promising an eventual hyperinflationary environment. Further, the bounce in the President's approval rating was short-lived, and it is at a level that has crashed the greenback in the past.
Timing is uncertain, but the break in the dollar should come quickly, with little if any advance warning. Serious shocks loom in U.S. economic and fiscal data (December GAAP statement) and deteriorating domestic politics. New record lows for the dollar still are likely before the end of the year, if not early in 2007, despite any overt or covert supportive intervention by any central bank(s). At some point, certain Asian central banks even could be encouraging the dollar selling.
Generally, the weaker the dollar, the greater will be the ultimate inflation pressure and liquidity squeeze in the U.S. equity and capital markets. As shown in the following graph, the U.S. dollar still is trending lower in terms of year-to-year change.
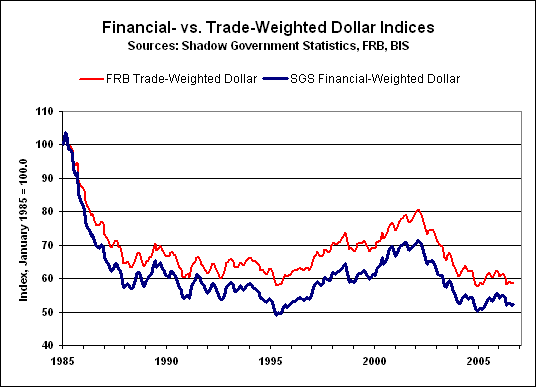
[Note: Historical data on both dollar series are available for download on the Alternate Data page of www.shadowstats.com. See the July 2005 SGS for methodology.]
U.S. Dollar Indices. The Shadow Government Statistics' Financial-Weighted U.S. Dollar Index is based on dollar exchange rates weighted for respective global currency trading volumes. For September, the monthly dollar average rebounded by 0.74% following a 1.15% decline in August. September's year-to-year change was a decline of 2.02%, narrowed from August's 2.85% drop.
In the same directions, September's monthly average of the Federal Reserve's Major Currency Trade-Weighted U.S. Dollar Index gained 0.52% after falling by 0.93% in August. September's year-to-year decline of 2.55% moderated further from August's 3.48%.
As we go to press, the dollar indices in October generally have been stronger than the September averages. Nonetheless, some selling pressure has developed in the last several days.
Gold -- After averaging around $630 per troy ounce in July and August, the gold price tumbled in September, averaging just below $600 per troy ounce. October trading has averaged below September's level, but the precious metal has rebounded recently, trading just shy of $600 as we go to press. The long-term outlook for gold remains highly positive.
As a hedge against currency problems and inflation, and as the preferred safe-haven vehicle, the price of gold generally should move higher and set new historical highs in the months ahead, despite any near-term volatility. The currency and inflation issues are chronic and will deteriorate sharply in the next several months and before an ultimate collapse in the global currency system. Such does not prevent interim wild price gyrations, however, particularly if central banks think they see an opportunity to slam the price of gold.
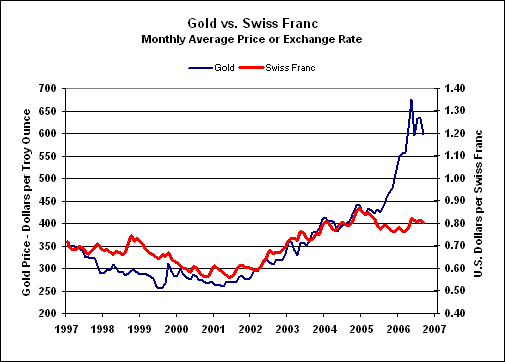
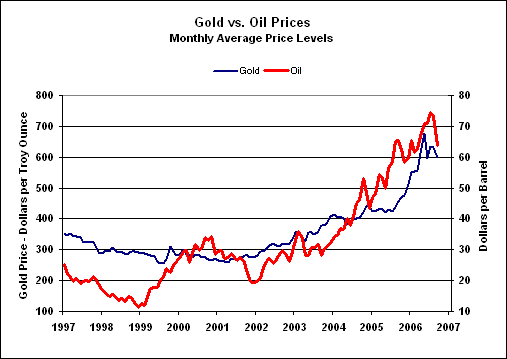
The updated gold versus oil and Swiss franc graphs show softer September averages. As we go to press, gold is trading just shy of $600, oil is around $60 and the Swiss franc is about $0.80.
As the election passes, so too will some of the political pressures that have contributed to distortions of near-term reporting. Upcoming releases of the major series still will be subject to massaging for the perceived needs of the financial markets. Separately, most of the heavy annual and seasonally-adjusted monthly distortions from last year's hurricanes effects should pass with the September data, but some effects will linger through the publication of the October numbers. Distortions to initial claims for unemployment insurance will linger for another several months.
Employment/Unemployment -- September's 51,000 payroll gain surprised the markets on the downside, while the magnitude of increase was marginal for the sixth straight month. The "improved" unemployment rate, however, remained a political positive, as the labor numbers once again sent mixed signals intended to please both the credit markets and the electorate.
As reported by the Bureau of Labor Statistics (BLS), the popularly followed seasonally-adjusted U-3 unemployment rate eased insignificantly in September to 4.58% +/- 0.2% from 4.69% in August. Unadjusted September U-3 dropped to 4.4% from 4.6%, while the broader unadjusted U-6 moved from 8.3% to 7.6%, and the adjusted U-6 eased from 8.4% to 8.0%.
Including the long-term "discouraged workers" defined away during the Clinton administration, total unemployment remains roughly 12%. The household survey also showed seasonally-adjusted September employment (those people with at least one job) up by 271,000, following a 250,000 gain in August.
For September, the payroll survey's seasonally-adjusted gain of 51,000 (113,000 net of revisions) remained well within the published reporting error of +/-108,000. This followed an upwardly revised August gain of 188,000 (was 128,000). Annual growth in unadjusted September employment was 1.27%, down from 1.34% in August, and down from the near-term peak of 1.71% in August 2005.
A year ago September, Hurricane Katrina devastated the Gulf Coast. While the BLS now shows monthly payroll growth slowing from 175,000 in August 2005 to 48,000 in September 2005, the BLS never reported the bulk of lost jobs. Even so, looking at August 2006 and September 2006 against that year ago period, one would expect that a growing economy would spike the relative annual jobs growth for September. With September 2006 being compared to an artificially-depressed period, however, growth did not increase; it softened instead.
The unusual numbers did not end there. When data are seasonally adjusted properly, year-to-year growth in the adjusted and unadjusted monthly data should be virtually identical. In September, they were not. The unadjusted annual growth rates detailed above, when applied to the seasonally-adjusted numbers, indicate that monthly payrolls should not have risen by 51,000 in September, but rather they should have fallen by 40,000.
September's payroll gain of 51,000 included a positive bias of 28,000 jobs in the "net birth/death" adjustment, a fudge factor that was little changed down the 50,000 used for September 2005. The fudge factor should be little changed in October (it was a 57,000 gain in October 2005).
The latest report was against a background of an ongoing collapse of growth in help-wanted advertising, Katrina-improved growth in new claims for unemployment insurance and weak purchasing managers employment indices (see the respective sections).
Adding to the extraordinary features of the September jobs report, the BLS announced that its annual benchmark revision for March 2006, to be revised and reported with the January 2007 jobs data, would be an addition of roughly 810,000 payroll jobs. Although historical revisions have been worse, the BLS announced that it "currently is researching possible sources for this larger-than-normal expected benchmark revision."
The benchmarking process has been seriously flawed for years, and this change is not credible. Consider that the involved period encompasses the missing of several hundred thousand jobs lost along the Gulf Coast. If a cause for the "undercount" cannot be found, the solution will be to add roughly 67,000 to 100,000 extra jobs a month to the birth-death bias factors, so as to overstate jobs growth even further, on a regular basis. Remember, the only political sin for a government statistical agency is to underestimate economic growth or to overestimate inflation.
Next Release (November 3): The political needs of the Administration remain great in this last major economic release before the election, and risk remains high of political massaging. Happy news remains a fair bet, regardless of any miserable underlying reality and other indications that would suggest a possible jobs loss.
Gross Domestic Product (GDP) -- The "advance" estimate of annualized real growth for third-quarter 2006 GDP fell to 1.58% +/- 3%, down from the "final" estimate of 2.56% for the second quarter, and down from 5.58% in the first quarter. The third-quarter growth estimate was indistinguishable from a contraction, as was the reported growth in the second quarter. Such allows, with possible revisions, for eventual formal recession reporting with numbers already in place from the Bureau of Economic Analysis.
The latest growth estimate did not fully account for the deterioration in trade or for the proper level of inflation. Yet, relative to second-quarter growth, the deterioration was realistic. Where ultimately the second-quarter should revise to a quarterly contraction, the third quarter would revise to a relatively deeper contraction.
In terms of annual growth, the third-quarter's pace slowed to 2.86% from 3.51% in the second quarter. Adjusting for methodological distortions built into GDP reporting over time, the SGS Alternate GDP measure suggests economic reality is much weaker, with a year-to-year annual contraction of roughly 1.5% for the third-quarter GDP, deepening from a 1.0% drop in the second quarter (see the graph in the Alternate Reality section of the Opening Comments).
The GDP inflation rate (deflator) in the third quarter remained understated at 1.83% versus 3.30% in the prior quarter, despite annualized seasonally-adjusted CPI in the second-quarter of 2.94% and of 4.97% in the second quarter.
Alternate measures of GDP growth, in terms of the broader Gross National Product (GNP) and the theoretically-equivalent Gross Domestic Income, will not be available until the next report, at the earliest.
Next Release (November 29): The "preliminary" estimate revision for third-quarter 2006 GDP should tend toward an even weaker report, barring major revisions to underlying data.
Consumer Price Index (CPI) -- The BLS reported the seasonally-adjusted September CPI-U fell by 0.49% (down by 0.49% unadjusted), following August's 0.25% (0.20% unadjusted) increase. On a not-seasonally-adjusted basis, September's annual inflation rate (I-6) was 2.06%, down from 3.82% in August. The eight levels of annual inflation, I-1 to I-8, are shown in the table in the Alternate Reality section, as is the plot of the SGS Alternate Consumer Inflation number.
The "experimental" Chained Consumer Price Index (C-CPI-U), the fully substitution based CPI that presumably is the eventual replacement for current CPI reporting, showed annual inflation (I-5) of 2.17% in September, down from 3.42% in August. What is extraordinary and exceptional here is that annual C-CPI-U inflation has topped the CPI-U for the first time ever. There is a problem in the gimmicked CPI-U weightings (see the Opening Comments).
Adjusted to pre-Clinton methodology (I-7), annual CPI growth was about 5.2% as of September, against 7.0% in August. The SGS Alternate Consumer Inflation measure (I-8), which reverses gimmicked changes to official CPI reporting methodologies of recent decades, shows annual inflation at 9.4% in September versus 10.1% (revised from 10.8%) in August.
As discussed in the Opening Comments, September inflation rates took a double hit from the year-ago effects of Katrina, as well as the recent drop in gasoline prices. As usual, the CPI picked more than the actual drop in energy related prices, while the pick-up usually is quite lagged when the movement is to the upside in energy costs. With seasonally-adjusted CPI-U down 0.7% and 0.1% in monthly November and December 2005 CPI reporting, those same months in 2006 will be inclined to show sharp increases in annual CPI inflation.
Next Release (November 16): Inflation has not peaked, but it will take several month's to regain its recent high annual rates. Nonetheless, surprises still should come in on the upside of weak expectations, tied particularly to core numbers, which continue to firm. They increasingly are reflecting the slow process of oil prices permeating nearly all levels of business activity.
Despite short-term volatility, annual inflation will remain high and should continue to accelerate to the upside, particularly in November. Pressures will continue not only from the ongoing and lagged effects of oil prices, but also from a weak U.S. dollar. Seasonally-adjusted monthly inflation was up 0.25% for October 2005, which means that monthly October 2006 inflation above or below that level will move the reported annual inflation rate in tandem.
Federal Deficit -- As discussed in the Flash Update, the official 2006 federal budget deficit (fiscal year ended September 30th) was reported at $247.7 billion, down $71.0 billion from 2005's $318.7 billion. Despite the gimmicked reporting, the amount of debt taken on by the federal government showed worsening annual fiscal deterioration. Further, reporting based on generally accepted accounting principles (GAAP) -- due for release in mid-December -- also should show deterioration, with the actual 2006 deficit in excess of $3.5 trillion.
The improvement in the accounting-gimmicked number was due to corporate tax relief on repatriated profits, which, in turn triggered heavy activity and a resulting short-lived surge in corporate tax revenues. The tax surge had nothing to do with strong economic activity.
Separate from the GAAP-based numbers and official deficit reporting, the change in gross federal debt is a fair indicator of actual net cash outlays by the government. As of fiscal year-end 2006, the gross federal debt stood at $8.507 trillion, up by $574 billion from 2005, which in turn was up $554 billion from 2004.
Going forward, the official federal deficit will inflate, as government finances suffer tax revenue losses from the intensifying recession and relative tax receipt declines after the expiration of the tax incentives. While GDP growth estimates can be gimmicked, incoming tax receipts (based on consistently applied tax policies) remain an independent estimate of underlying economic reality and eventually will reflect the economy's mounting difficulties.
Initial Claims for Unemployment Insurance -- Annual change in initial claims moved into more-negative territory (an economic positive) due to year-ago comparisons with the effects of Hurricane Katrina. On a smoothed basis for the 17 weeks ended October 21st, annual change widened to an 8.3% decline, from a 6.2% drop as of the September 16th week.
Usually, the volatility of the seasonally-adjusted weekly numbers is due partially to the seasonal-adjustment process. When the series is viewed in terms of the year-to-year change in the 17-week (four-month) moving average, however, such generally is a fair indicator of current economic activity.
It is worth noting that the annual changes on a weekly basis are near zero, and the year-ago impacts from the hurricanes are working their way through the 17-week moving average. By the end of November, the year-ago growth patterns should resume annual deterioration in unemployment claims, once again.
Real Average Weekly Earnings -- September's seasonally-adjusted real earnings soared by 1.0% for the month, after a 0.4% drop (revised from a 0.5% decline). September's real earnings also jumped by 2.2% from the year before, following August's 0.3% gain. The "improvement" all was tied to year-ago CPI comparisons that were distorted by the effects of Hurricane Katrina. Those effects and distortions will reverse in the months ahead.
Volatility in this series comes primarily from variations in reported CPI growth. Allowing for the biases built into the CPI-W series used in deflating the average weekly earnings, annual change in this series still signals ongoing severe financial strain on U.S. households and continuing recession.
Retail Sales -- As discussed in the Flash Update, September's seasonally-adjusted retail sales fell by 0.4% +/- 0.7% (down 0.5% net of revisions) for the month, well below market expectations. Retail sales in August gained 0.1% (previously 0.2%) from July. Net of heavily understated CPI inflation, September's sales were up by a tepid 0.1%
When inflation-adjusted year-to-year growth in retail sales falls below 1.8% (using the official CPI-U for deflation), such signals recession. The signal was generated in June. Before inflation adjustment, September's annual growth was 5.5%, down from August's 6.4%. Net of Katrina-dampened annual inflation, September's annual growth was 3.4% against 2.6% in August.
Next Release (November 14): October retail sales also should come in below expectations, reflecting declining economic activity. Inflation-adjusted growth should remain negative on a monthly basis, with annual growth generally continuing to slow.
Industrial Production -- Surprising market expectations on the downside, seasonally-adjusted September production plunged by 0.6%, following an unchanged August that previously had shown a 0.1% decline versus July. Year-to-year growth in September was 5.6%, up from 4.8% (previously 4.7%) in August.
Next Release (November 16): Look for industrial production to contract again in October, increasingly mirroring the recession. Such would surprise market expectations, once again, on the downside.
New Orders for Durable Goods -- The highly volatile durable goods orders jumped by a seasonally-adjusted 7.8% (8.1% net of revisions), after declining by a revised 0.1% (previously down 0.5%) in August. As sometimes happens, virtually all the gain came from a spike in irregular aircraft orders, with new orders for the month, ex-transportation, were up just 0.1%. September's orders were up 11.4% from the year before, against August's 4.2% gain.
Also spiked by aircraft orders, the widely followed nondefense capital goods orders exploded by 21.9% for the month, after a revised 2.2% decline in August (previously down by 3.5%). September's annual growth rate was up 31.3%.
At one time, durable goods orders was a solid leading indicator of broad economic activity, when smoothed using a six-month moving average. After the semi-conductor industry stopped reporting new orders, however, the series' predictive ability suffered a serious setback.
Trade Balance -- Surprising the markets, and dampening the advance estimate of third-quarter GDP growth, the seasonally-adjusted August 2006 trade deficit surged to a new monthly record of $69.9 billion, from the prior record set in July of $68.0 billion. As noted in the recent Flash Update, the excuse proffered by Wall Street's spinmeisters was that the deteriorating deficit was just due to rising oil prices. As with similar claims for July deficit, the hype was terribly misleading. In July, a reduction in dollar oil imports actually dampened the exploding deficit.
For August, the $1.9 billion deficit increase could be attributed fully to oil, but not to oil prices. Higher oil prices accounted for $0.4 billion of imports, while the increase in the physical volume of oil imports accounted for $1.5 billion of imports.
August oil imports (both physical and dollar volume) rose to the highest level, ever. As Middle Eastern tensions rise anew, post-election, the U.S. economy will be more vulnerable to disruptions in foreign oil supply than at any time in the past.
The spike in the August deficit may have suffered some seasonal-factor distortions due the year-ago impact of Katrina on traffic through the Port of New Orleans, but those factors do not apply to the current reported oil imports, which are based on the not-seasonally-adjusted daily rate of activity.
Next Release (November 9): The September trade deficit should continue the widening trend, and upcoming deficit reports will surge beyond consensus forecasts, regularly setting new records. Any unusually large swing in the September data should impact the preliminary-estimate revision of third-quarter GDP, where unexpected trade deterioration would soften the reported GDP growth rate and vice versa.
Consumer Confidence -- September confidence measures rose somewhat, thanks to lower gasoline prices, and annual growth soared against the Katrina-dampened sentiments of a year ago. The Conference Board's September consumer confidence rose by 4.3%, which did not offset August's 6.4% drop. The September number is subject to suspect seasonal adjustment. The unadjusted University of Michigan's consumer sentiment increased by 4.2%, which followed August's 3.2% decline.
On a three-month moving-average basis for September, annual growth in the Conference Board's measure turned positive, up 5.1%, against a 0.9% decline in the prior month, while the University of Michigan number was down 4.0%, following August's 10.7% decline. These lagging, not leading, indicators are signaling that the economy remains in recession.
The just-reported October University of Michigan consumer sentiment measure increased by 9.6% for the month. The positive trend in the monthly confidence numbers should reverse with November's reporting.
Short-Term Credit Measures -- Annual growth in short-term commercial credit measures remained strong, with mixed growth patterns, holding double-digit percentage annual growth, while annual growth in consumer credit remained below average and softened again.
Growth in seasonally-adjusted consumer credit remained sub-par in August, with annual growth easing to 3.4%, down from a revised 4.3% (was 3.7%) in July. Without inflation-adjusted growth in income, growth in personal consumption can be supported over the short-term only by debt expansion or savings liquidation. Consumer debt expansion -- though moving -- is soft enough to act as an increasing constraint on economic growth.
Annual growth in commercial paper outstanding in September jumped to 19.6%, versus 17.4% in August. Annual growth in commercial and industrial loans eased slightly to 14.9% in September from 15.2% in August. Rising sales can fuel short-term credit needs, but so too can slowing sales, slowing collections and rising inventories.
Producer Price Index (PPI) -- The seasonally-adjusted September finished goods PPI fell by 1.3% (down by 1.1% unadjusted), after August's 0.1% (0.1% unadjusted) increase. September's annual PPI inflation dropped to 0.9 from 3.7% in August. Seasonally-adjusted September intermediate goods fell by 1.4% for the month, while crude goods were down by 3.4%. Beyond the sharp drop in oil prices, the monthly inflation numbers again were depressed partially by irregular seasonal adjustment factors that were suggestive of some political tampering.
Next Release (November 14): Despite the large component of random volatility in monthly price variations, PPI inflation reporting over the next six-to-nine months, including October, should top depressed expectations. "Core" inflation, in particular, should continue offering upside surprises to consensus forecasts, despite reporting games played by the BLS.
The following numbers are generally good-quality leading indicators of economic activity and inflation that offer an alternative to the politically-hyped numbers when the economy really is not so perfect. In some instances, using a three-month moving average improves the quality of the economic signal and is so noted in the text.
Economic Indicators
Purchasing Managers Survey: Manufacturing New Orders -- The September new orders held even with August at 54.2, after August's decline of 3.4%. As an SGS early warning indicator of a pending major economic shift, this measure breached its fail-safe point in mid-2005, generating a signal of pending recession.
The Commerce Department provides suspect seasonal factors for the series, and the resulting adjusted monthly numbers can be misleading in the reporting of month-to-month change. This problem is overcome by using year-to-year change on a three-month moving average basis. On that basis, the September index fell by 6.8%, following August's 2.8% contraction. The index gradually has notched lower from its peak annual growth of 42.6% in April of 2004.
Published by the Institute for Supply Management (ISM), the new orders component of the purchasing managers survey is a particularly valuable indicator of economic activity. The index is a diffusion index, where a reading above 50.0 indicates rising new orders.
The overall September ISM manufacturing index dropped to 52.9 from 54.5 in August. An index level of 50.0 divides a growing versus contracting manufacturing sector. The September employment component plunged into contraction territory at 49.4, down from August's 54.0.
The service-sector ISM index does not have much meaning related to broad economic activity. Unlike its older counterpart, the manufacturing survey, if service companies such as law firms, hospitals or fast-food restaurants have "increased orders," that does not necessarily mean that economic activity is increasing. That said, the overall services index also dropped sharply, to 52.8 from 57.0.
Both the services employment and prices paid components, however, have some meaning. The September employment component rose to 53.6 from 51.4 in August. The prices paid component is covered under the Inflation Indicators.
Help-Wanted Advertising Index (HWA) -- Signaling a rapidly intensifying economic downturn, the September help-wanted advertising index held at 30, the same as the revised August reading. August initially had dropped to 31, down from 32 in July, which in turn was down from 34 in June. September's reading was down from 37 in September 2005.
The September and August readings are the lowest seen since early 1961. The index was last lower than this during in Eisenhower Administration in October 1958, as shown in the graph in the Opening Comments. While the series never recovered from the 2000 recession, its recent plunge -- annual change is down 18.6% on a three-month moving average basis -- is signaling a renewed and rapid contraction in economic activity.
Housing Starts -- Annual change remains deeply negative, despite the high volatility in monthly reporting. Seasonally-adjusted September housing starts rose by 5.9% in the month, following a revised 4.9% decline in August. With September's year-to-year change down by 17.9%, following August's 15.4% contraction, the annual change on a three-month moving-average basis now stands at a year-to-year drop of 17.4%, which is generating an intensifying recession signal.
Further, in related data, with respective rates of annual contraction for September new- and existing-home sales both at 14.2%, activity remains consistent with a sharp economic downturn.
Money Supply -- Despite revisions to the historical series, real annual growth rates for September M1 and M2 remain consistent with the ongoing recession, while the nominal (not-inflation-adjusted) annual growth in M3 -- as estimated by the SGS Continuing M3 Series -- not only remains strong enough to fuel inflation concerns, but also is showing signs of accelerating.
Annual growth in September for monthly M1 fell by 1.1%, versus a 0.5% contraction in August, while annual M2 growth eased to 4.4% from 4.6%. The SGS Continuing M3 Series for September gained 9.2% from the year before, up slightly from 9.1% in August and matching the recent peak growth seen in July. If the trends for the first three weeks reported for October continue, annual growth would rise to about 9.4% for the month, setting a new four-year high.
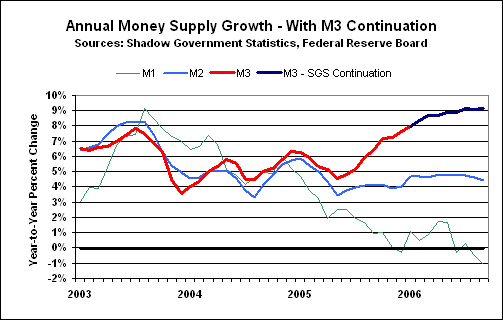
[Note: Historical annual growth data for the money supply series, including the ongoing SGS estimates of M3, are available for download on the Alternate Data page of www.shadowstats.com. See the August 2006 SGS for methodology.]
Before inflation adjustment, monthly seasonally-adjusted M1 and M2 fell by 0.9% and rose by 0.2%, respectively, in September, following a 0.2% decline and 0.3% increases in August. The seasonally-adjusted monthly gain for M3 in September was roughly 0.9%.
Adjusted for CPI inflation, September's M1 and M2 year-to-year rates of change were down 3.1% and up 2.2%, respectively. On a three-month moving-average basis, the September inflation-adjusted annual rates of change were down 3.7% and up 1.2%, levels that remain well underwater using the old-style CPI.
Inflation Indicators
Purchasing Managers Surveys: Prices Paid Indices -- Declining oil prices showed up in the purchasing managers surveys. On the manufacturing side, the September prices paid diffusion index dropped to 61.0 from August's 73.0, a reading still indicative of strong inflationary pressure. On a three-month moving average basis, September's annual growth was up by 12.4%, against August's 40.9%.
On the non-manufacturing side, the September prices paid diffusion index dropped to 56.6 from August's 72.4, a level signaling minor inflationary pressure. On a three-month moving average basis, September's annual change was down 5.2%, against August's 11.5% gain.
Published by the Institute for Supply Management (ISM), the prices paid components of the purchasing managers surveys are reliable leading indicators of inflation activity. The measures are diffusion indices, where a reading above 50.0 indicates rising inflation.
Oil Prices -- West Texas Intermediate Spot (St. Louis Fed) dropped to $63.87 per barrel in September, down 13.7% from August's $73.05 per barrel. Nonetheless, oil prices persist at extraordinarily inflationary levels, despite September's average being down 2.6% from the year before, after August having been up 12.4% on the same basis.
Annual price comparisons for September are against the oil-price spike seen last year from hurricane impact. Recent oil prices have been relatively soft due efforts by the Administration to dampen Middle Eastern tensions before the November 7th election. Even so, OPEC has moved to cut production in an effort to firm oil prices. Trading so far in October has been just under $60, about the same level as seen in October of last year, but prices have pushed higher in recent days.
Spot prices will continue to gyrate and can be expected to be on the rise again shortly after the November election, if not before. Middle Eastern political tensions are likely to intensify once again from the standpoint of U.S. policy, following the election. Further production action by OPEC is a good bet, if existing market forces do not maintain prices well above the $60 per barrel mark.
Despite recent extreme near-term price volatility, high oil prices will remain a major contributing factor to the inflation side of the current inflationary recession. Oil prices remain extremely high, and still are working there way through the system. Oil price changes permeate costs throughout the economy, ranging from transportation and energy costs, to material costs in the plastics, pharmaceutical, fertilizer, chemical industries, etc. Cost pressures already have passed significantly into the so-called "core" inflation sectors. Reporting of same should pick up despite any near-term easing of oil prices.
Oil price volatility affects CPI and PPI reporting. Downside oil price movements tend to be picked up more quickly and fully by the BLS in its inflation measures than are upside movements. This was particularly evident in the September CPI and PPI. Even as currently understated, though, CPI and PPI inflation will rebound sharply in the post-election months, tending to be stronger than commonly predicted for the next several quarters, partially as a result of the persistency of the high oil prices.
The coverage and available prior material are detailed below for various series. Data reported with a less-than-monthly frequency also are updated here or in the Reporting/Market Focus.
Quarterly/Annual Reporting -- Most series analyzed are published on a monthly or weekly basis. Followed economic/market series that are published with less-than-monthly frequency include:
Annual:
* Financial Statements of the United States Government (most recent analysis was a Supplement to December 2005 SGS; next analysis is due as a Supplement to the December 2006 SGS). * Income Variance/Dispersion (most recent analysis was is in the September 2006 SGS; next analysis is due September 2007).
Quarterly:
* Flow of Funds Accounts of the United States (the most recent analysis is in this month's Reporting/Market Focus; the next analysis is due January 2007 SGS).
Reporting/Market Foci -- The various economic and financial-market series are being addressed in a monthly "Reporting/Market Focus," with this month's analysis examining Quarterly Flow of Funds Accounts and Productivity. Employment, GDP, CPI and the Federal Deficit separately are explored in the background article "A Primer on Government Economic Reports," available on the Home page of www.shadowstats.com.
The series detailed so far in the Reporting Foci or background articles are listed below. The referenced SGS publications are available on the Archives page of www.shadowstats.com.
* Consumer Confidence (November 2004 SGS).
* Consumer Price Index (an original background article [updated October 2006], October 2005 SGS, alternate numbers introduced August 2006 SGS).
* Credit Measures, Short-Term (August 2005 SGS).
* Durable Goods, New Orders for (May 2006 SGS).
* Employment/Unemployment (an original background article, alternate measures (April 2005 SGS).
* Federal Deficit (an original background article, update in the Alert of July 7, 2005, update in Supplement to December 2005 SGS).
* Gross Domestic Product (an original background article, alternate numbers introduced August 2006).
* Help Wanted Advertising (January 2006 SGS).
* Housing Starts and related housing statistics (June 2006 SGS).
* Income Variance/Dispersion (September 2005 SGS, September 2006 SGS).
* Industrial Production (January 2005 SGS).
* Money Supply (Part I / SGS Early Warning System - May 2005 SGS, Part II - June 2005 SGS, M3 update November 2005 Supplement, M2 update March 2006 SGS, M3 continuing series introduced August 2006).
* Producer Price Index (April 2006 SGS).
* Productivity (October 2006 SGS).
* Purchasing Managers Survey (February 2006 SGS).
* Retail Sales (March 2005 SGS).
* SGS Early Warning System (May 2005 SGS, June 2005 SGS).
* Trade Balance (December 2004 SGS).
* Unemployment Insurance, Initial Claims for (February 2005 SGS).
* U.S. Dollar Indices, Financial- and Trade-Weighted (July 2005 SGS).
Quarterly Update: Federal Reserve Flow of Funds Accounts. If you have an intractable economic problem, you can try to make it go away by altering or eliminating key data series. If the economy is damaged by a "free trade" agreement, just redefine GDP methodology and spike productivity growth. If the government wants to reduce cost-of-living adjustments for Social Security recipients, without going public on the effort, just reduce reported CPI. If the central bank is going to be spiking the broad money supply, just eliminate M3 reporting. If there is a problem with foreign investors holding too much Treasury debt, just define them away.
We noted when first publishing the Federal Reserve's Flow of Funds Data three months ago that it was subject to the foibles of the national income (NIPA) accounts, including GDP. So long as the GDP methodology stays constant, the relative flow changes should have some significance. The GDP methodology, however, has been altered and so has the reported flow of funds.
From those same people who took away M3, now comes a revision in the flow of funds that helps make another problem start to fall of the financial markets' radar screen. The methodological issues will be addressed in November's Reporting/Market Focus.
In recent methodological revisions to the services sector of the trade data, the Bureau of Economic Analysis made the balance of payments problem appear less significant than it had been. If the net flow of cash to the rest of the world is reduced on an historical basis, however, that means the rest of the world does not hold as many dollars as previously thought. If that is the case, then the flow of funds data have to be adjusted.
Correcting for the "improved" trade data, the Federal Reserve adjusted its flow-of-funds numbers. As a result, the Rest of World category's total assets at the end of 2005 was revised from $11,106.9 billion to $11,029.4 billion, a drop of $77.5 billion.
Somehow, that translated to Rest of World holdings of U.S. Treasury securities dropping from $2,196.8 billion to $1,993.8 billion, a decline of $203.0 billion. Fortunately, however, U.S. Treasury debt issuance is not vulnerable yet to creative revisions. So, if the total level of Treasury issuance stayed the same, who bought the Treasuries the that Rest of World no longer owns?
Thank goodness for U.S. households! Their holdings of U.S. Treasuries as of year-end 2005 revised from $368.8 billion to $551.5 billion, increasing by an incredible 50%, or $182.7, which is exactly 90.0% of the reduction in the Rest of World category.
Personally, I get nervous when I see too many exact numbers in government data that have zeros in them, although that does happens at random. It almost looks like someone said, "Let's allocate 90% of the Treasuries lost by the Rest of World to the Household category."
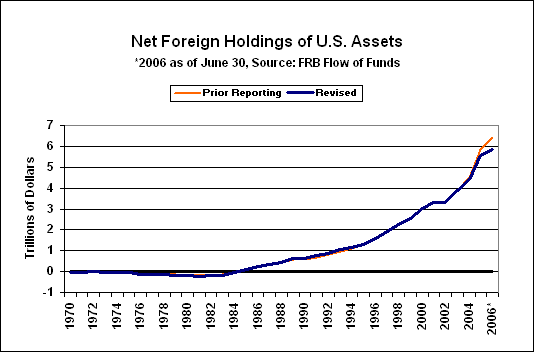
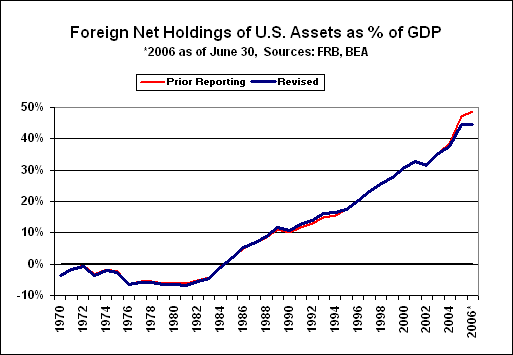
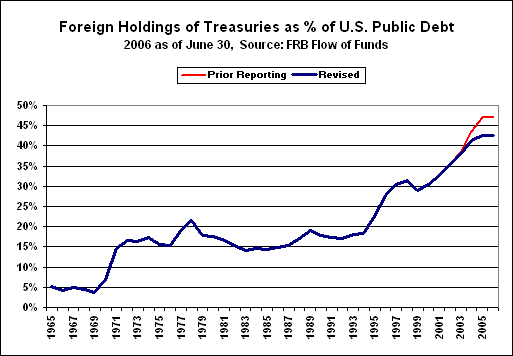
The graphs shown above reflect the revisions and a pattern of dampening growth in U.S. dependence on foreign capital. While the series still shows a serious problem that will trigger an eventual collapse in the financial system, the reliability of the data has been seriously compromised by the latest revisions, and the numbers simply are not credible.
The new data imply reductions in the recent net foreign acquisition of U.S. Treasuries as a percent of Treasury issuance. Previous numbers showed foreign investors acquiring enough net Treasuries to account for 101.1%, 96.5% and 84.5%, respectively, of net Treasury debt issuance in 2004, 2005 and the 12 months ended June 2006. The new proportions are, respectively, 80.0%, 61.9% and 37.4%.
If the Fed's new numbers were accurate, the dollar would be much weaker, and long-term Treasury yields would be much higher. The data are not accurate.
Productivity. When the Fed Chairman touts an economic miracle, it almost certainly means that officials have been playing with their numbers, not that the Deity has intervened in the economy.
Subscribers occasionally ask why SGS does not cover the quarterly U.S. productivity numbers. The answer is that those numbers are of such poor quality that they hardly are worth wasting computer memory storage on them. Where the Federal Reserve and recent administrations have patted each other on the back tied to the heavily touted productivity "miracle," SGS looks at current and historical productivity adjusted for some of the same methodological gimmicks that have been built into GDP and inflation reporting over the decades.
Contrary to one of Wall Street's favorite myths, productivity is not improving economic and business conditions year after year. While productivity gains are obvious in many areas of business, productivity for the broad economy has been in decline since the miracle of NAFTA.
Productivity broadly is measured as output per hour of all persons. The series is published quarterly and updated monthly by the Bureau of Labor Statistics. Generally, productivity is a measure of production, divided by a measure of labor. The production measure used is a stripped down version of the GDP. It excludes government, non-profit institutions and private households, which leaves about 78% of the GDP intact. The labor measures are based on the sampling done for the household survey of employment, adjusted for the same eliminations as production. Neither of the two series is of good quality, so it is difficult to expect a ratio of the two data sets to have much meaning.
The graph below plots the officially reported level of productivity per year, with 1980 set at 100, along with an SGS alternate version.
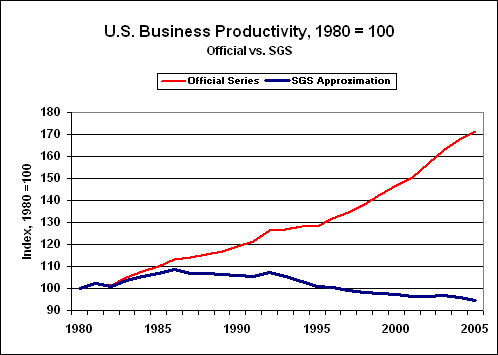
The top line reflects the reported productivity miracle; the bottom is the rough SGS estimate, adjusted for removing methodological gimmicks that were added over time. Of some interest, the SGS line turns down after the signing of the North American Free Trade Agreement (NAFTA) late in 1992. NAFTA went into effect the first of 1994.
Why would this or any such treaty purportedly designed to stimulate the U.S. economy drive productivity lower? Simply put, the academic imbeciles, who sold the concept, forgot to emphasize to those who bought the concept, that both parties entering into such an agreement had to be at full employment in order to realize mutual benefit.
The end result has been an explosive growth in new trade deficits with Mexico and Canada. As to productivity, consider eliminating the jobs of highly skilled production workers and machinists and turning them into hamburger flippers. It is hard to imagine how that translates into a productivity miracle.
With the Board of Governors of the Federal Reserve System and Bureau of Economic Analysis monkeying with reporting of the broad trade data, increasing obfuscation in the numbers has become evident. Historical economic growth patterns are being altered, as is current reporting.
Separately, GDP reporting is heavily dependent on personal income data. The Bureau of Economic Analysis massages the data almost beyond recognition. Not surprisingly, the government's reporting fantasies do not tie into hard data published by the Internal Revenue Service.
The games playing with these numbers will be examined against alternate, more-reliable statistics.
November's "Shadow Government Statistics" is targeted for release on Monday, November 27, 2006, following the Thanksgiving holiday. The monthly newsletter usually is scheduled each month for the Wednesday following the release of the CPI report, but the schedule is subject to change. Final publication date will be noted on the home page of shadowstats.com at the top of the "Latest Monthly Commentary" column. The posting of the next SGS newsletter on the Web site, as well as all Flash Updates and any Alerts, will be advised immediately by e-mail.