March 2007 Edition
Issue Number 29
April 9, 2007
__________
Inflationary Recession Deepens as Markets Sense a Problem
No Risk of U.S. Economy Being at Full Employment
March Annual M3 Growth Jumps to 11.6%
Foreign Investors Shunning Treasuries?
Handling Hyperinflation in a Near-Cashless Society
Dollar Sell-Off and Gold Boom Still Lie in Offing
__________
Introduced this month is the use of "General background notes," which provides a general background paragraph on certain series or concepts, but where the language used in past and subsequent newsletters usually has been or will be identical, month after month. Any text changes in these sections, going forward, will be highlighted in bold italics upon first usage. This is designed so that regular readers may avoid re-reading material they have seen before, but where they will have the material available for reference, if so desired. Best wishes to all -- John Williams
Despite continued rapid deterioration in the current inflationary recession, and despite growing market recognition of the intractable difficulties with both inflation and business activity, there are those on Wall Street who just seem unable to accept the concept of inflation without a strong economy. Give the markets a stronger-than-expected employment report, and rumblings start of "full employment" triggering a round of wage inflation and Fed tightenings.
Inflation is a problem -- due to oil, dollar and monetary issues -- but not due to strong economic demand. With consumer liquidity squeezed dry, there is no risk of the economy overheating. With actual unemployment around 12%, there is no risk of inflation pressures from the economy being at full employment. Within various skill sets and/or regions, there may be high demand for certain employees, but nationally, labor market conditions appears to be bleak.
A first cut on monthly average M3 for March indicates annual growth jumped to 11.6% for the month, up from 10.9% in February. The hard estimate will published in the Alternate Data section this coming weekend.
The Federal Reserve's recent signals have been pretty clear that it is not about to change policy, unless forced to by outside circumstances. With the U.S. central bank impotent in terms of its ability to contain inflation or to stimulate the economy, the next likely move by the Fed remains a tightening designed to counter a still-looming massive sell-off of the U.S. dollar.
Indeed, the basic elements for a dollar collapse and an eventual hyperinflationary environment in the United States remain locked in place. Discussed in this month's Reporting/Market Focus is the latest status of foreign holdings of U.S. Treasury securities. Based on questionable data, foreign funding of net U.S. Treasury issuance appears to have slowed, but holdings nonetheless remain at extraordinarily dangerous levels. Separately, the United States increasingly has been moving to a cashless society. Living with and surviving hyperinflation in such a system is discussed in this month's third installment on the pending hyperinflation crisis.
The Economy. On the business front, retail sales, housing starts, industrial production, new orders, the purchasing managers survey and consumer confidence all have signaled a deepening economic contraction in recent reporting.
Of the above series, housing starts is the one with the longest lead time to broad economic activity. For those touting the housing downturn as being over and as not having impact on the rest of the economy, consider the following. If a new house is not built, the requisite lumber, wiring, other building materials and labor will not be used. The carpeting, appliances and other furnishings that would have been bought for the new house will not be bought, etc. The affected areas of production, retail sales and employment already are in trouble and will be getting worse as a result of the housing downturn.
Although March's employment report topped market expectations, the jobs outlook remains bleak, as confirmed in supporting series such as new claims for unemployment, help-wanted advertising and the employment components of the purchasing managers surveys.
Fourth-quarter GDP growth, initially reported at an annualized quarterly real (inflation-adjusted) rate of 3.5%, slowed to 2.2% in its first revision and held close to that (2.5%) in its second revision, despite the intervening publication of major downward revisions to recent historical growth in industrial production, new home sales and retail sales (see next section). The annual GDP benchmark revisions later this year will be adjusted for those factors. There is some risk of recent quarters of GDP growth -- particularly the fourth quarter of 2006 -- being reported as having contracted in revision, on an inflation-adjusted basis.
In terms of consumer and systemic liquidity, the rapidly spreading and deepening crisis with subprime and unconventional mortgages and loans promises intensified strangulation of consumer liquidity, as well as potential systemic liquidity crises for the broad financial system. A systemic liquidity crisis is the most likely scenario for triggering an otherwise unlikely easing by the Fed.
General background note: The U.S. economy is in a protracted and deepening structural recession that will prove to be the second leg of a double-dip recession, which began in 2000/2001. The current downleg was signaled in mid-2005 by a series of leading indicators used for that purpose by SGS. With neither traditional fiscal nor monetary stimulus available to help turn economic activity, the current circumstance is likely to evolve into a hyperinflationary depression (see December 2006 SGS).
Retail Sales Show Unfolding Recession. Retail sales accounted for one-third of GDP in 2006. Specifically, retail sales represented 47% of personal consumption expenditure, which, in turn, was 70% of GDP. When retail sales falter, the rest of the economy follows.
With household incomes not keeping up with inflation, the only factors keeping the personal-consumption end of the economy afloat have been short-term fixes: debt expansion and/or liquidation of savings. The intensifying credit/liquidity crisis for consumers is just beginning and will hit retail sales hard. The saving rate already is negative and likely at historic lows.
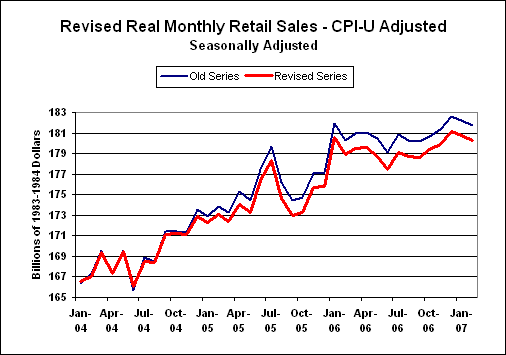
Even so, the accompanying graphs of current activity do not tell a happy story for the U.S. economy. The first graph reflects the monthly level of retail sales, adjusted for CPI-U inflation by the St. Louis Fed. The plot shows the series both before and after the March 29th benchmark revision. The benchmark showed weaker sales than previously had been reported, with 2006 retail sales down 0.8% from where they had been before. Allowing for variations tied to the severe hurricane season of 2005, the level of real retail sales -- one-third of the GDP -- has been broadly stagnant since mid-2005.
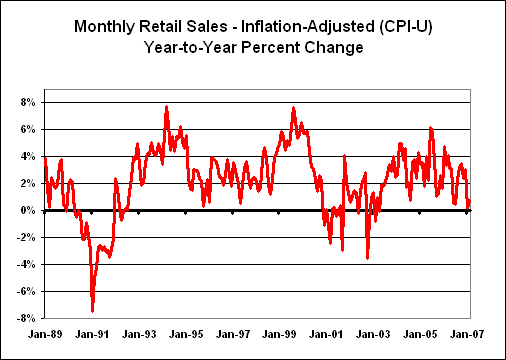
The second graph shows year-to-year change in the revised, real retail series. Aside from monthly (and related year-later) gyrations surrounding the 2001 terrorist attacks, current annual growth remains at levels, and is following patterns, that always have been accompanied by recession.
Inflation. On the inflation front, both the straight and "core" CPI and PPI measures recently have been topping market expectations. Also tickling financial-market inflation concerns have been rising oil and food prices, overly strong M3 growth and nascent dollar weakness. Even the FOMC pronounced in its March 21st statement that its "predominant policy concern remains the risk that inflation will fail to moderate as expected."
With the Middle East remaining the proverbial powder keg amidst other global political tensions, risks to oil prices -- and correspondingly to inflation -- remain on the upside. U.S. dollar selling risks have been heightened somewhat by expanding U.S. trade confrontations with Communist China.
Financial Markets. The unfortunate combination of a weak economy and rising inflation began taking its toll on the financial markets in first-quarter 2007. For the last 12 months, investors who held precious metals, or who just kept British pounds as cash in their wallets, did better than they would have done investing in the Dow Jones Industrial Average. It is not that the holders of pounds or gold really made money in terms of dollars, but rather that they maintained the purchasing power otherwise lost by the dollar.
The ultimate driver for the markets remains the fate of the U.S. currency. At such time as the dollar sell-off commences, U.S. interest rates should spike, equity prices should tumble and precious metals should soar anew. The big question is in the uncertain timing.
General background note: Current inflation pressures result largely from commodity supply distortions, not from strong economic demand. Accordingly, current inflation is not particularly responsive to any Fed efforts to slow economic activity. With the GAAP-based U.S. federal budget deficit increasing at an uncontainable $4.6 trillion per year and federal net obligations in excess of $50 trillion, the U.S. government faces eventual bankruptcy (see December 2006 SGS). With the U.S. financial markets so heavily dependent on foreign capital for liquidity, this leaves the U.S. financial markets vulnerable to extreme volatility, as the system approaches a period of hyperinflationary depression.
Alternate Realities. General background note: This section updates the Shadow Government Statistics (SGS) alternate measures of official CPI and GDP reporting. When a government economic measure does not match common public experience, it has little use outside of academia or the spin-doctoring rooms of the Federal Reserve, White House and Wall Street. Effects of gimmicked methodological changes have been removed from the official series so as to reflect more accurately the common public experience, as embodied by the post-World War II CPI and the pre-Reagan-Era GDP. The methodologies for the series are discussed in the August 2006 SGS (see Archives page at www.shadowstats.com).
GDP. The alternate fourth-quarter GDP growth reflects the "final" estimate revision, with many of the methodological gimmicks of recent decades removed. The alternate fourth-quarter inflation-adjusted annual growth rate (year-to-year, as opposed to the popularly-touted annualized quarter-to-quarter rate) for GDP was a decline of roughly 1.5% versus the official 3.1% gain.
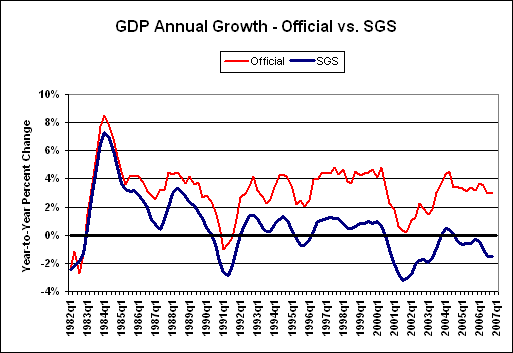
General background note: Historical data on both the official and SGS-Alternate GDP series are available for download on the Alternate Data page of www.shadowstats.com. The Alternate GDP numbers tend to show deeper and more protracted recessions than have been formally reported or reflected in related official reporting. Nonetheless, the patterns shown in the alternate data are broadly consistent with the payroll employment and industrial production series (as revised), which are major indicators used by the National Bureau of Economic Research in determining the official timing of U.S. business cycles.
CPI. The gimmicked annual core inflation in January did not show the annual dip seen in the full inflation measures, while both full and core inflation measures picked up in February. Oil prices have remained volatile, but at high levels, and related higher energy and material costs increasingly are permeating broad economic activity. Both core and regular inflation reporting annual should trend higher in the months ahead.
                             Eight Levels of Inflation
                Annual Inflation for November 2006 to February 2007


                                                  2006          2007
          Measure                                 Nov    Dec    Jan    Feb
          I.1 Core PCE Deflator                   2.1%r  2.1%r  2.2%r  2.4%
          I.2 Core Chained-CPI-U                  2.3%   2.3%   2.3%   2.4%
          I.3 Core CPI-U                          2.6%   2.6%   2.7%   2.7%
          I.4 PCE Deflator                        1.9%   2.2%r  1.9%r  2.3%
          I.5 Chained-CPI-U                       1.9%   2.4%   1.9%   2.2%
          I.6 CPI-U                               2.0%   2.5%   2.1%   2.4%
          I.7 Pre-Clinton CPI-U                   5.4%   5.8%   5.4%   5.7%
          I.8 SGS Alternate Consumer Inflation    9.4%  10.0%   9.9%  10.0%


          r - Revised.
          Notes: I.1 to I.3 reflect the core inflation rates, respectively,
          of the substitution-based personal consumption expenditure (PCE)
          deflator, the Chained-CPI-U and the geometrically-weighted CPI-U.
          I.4 to I.6 are the same measures with energy and food inflation
          included. The CPI-U (I.6) is the measure popularly followed by
          the financial press, when the media are not hyping core inflation.
          I.7 is the CPI-U with the effects of geometric weighting (Pre-
          Clinton Era as estimated by SGS) reversed. This is the top series
          in the CPI graph on the SGS home page www.shadowstats.com.
          I.8 reflects the SGS Alternate Consumer Inflation measure, which
          reverses the methodological gimmicks of the last 25 years or so,
          plus an adjustment for the portion of Clinton-Era geometric weighting
          that is not otherwise accounted for in BLS historic bookkeeping.
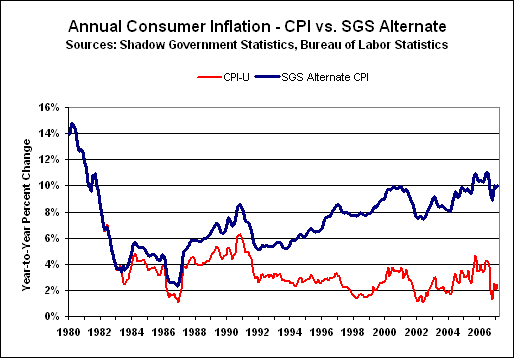
General background note: Historical data on both the official and SGS-Alternate CPI series are available for download on the Alternate Data page of www.shadowstats.com. The Alternate CPI numbers tend to show significantly higher inflation over time, generally reflecting the reversal of hedonic adjustments, geometric weighting and the use of a more traditional approach to measuring housing costs, measures all consistent with the reporting methodology in place as of 1980.
This is the final installment in a series of three articles on the greatest threat facing the U.S. economy and financial markets: hyperinflationary depression. The first article (December SGS) explored why the system faces hyperinflation instead of deflation. Last month's (January/February) SGS looked at how the crisis could break, along with approaches to preserving wealth and assets in the turbulent times ahead. The current article explores day-to-day consequences of living with hyperinflation.
The United States in a hyperinflation would experience the quick disappearance of cash as we know it. Shy of the rapid introduction of a new currency and/or the highly problematic adaptation of the current electronic commerce system to new pricing realities, a barter system is the most likely circumstance to evolve for regular commerce. Such would make much of the current electronic commerce system useless and add to what would become an ongoing economic implosion.
Where Did All the Currency Go? Some years back, I happened to be in San Francisco, having dinner with a former regional Federal Reserve Bank president and the chief economist for a large Midwestern bank. Market rumors that day had been that there was a run on a major bank in the City by the Bay. So I queried the regional Fed president as to what would be happening if the rumors were true.
He had had some personal experience with a run on banks in his region and explained how the Fed had a special team designed to handle such a crisis. The biggest problem he had had was getting adequate cash to the troubled banks to cover depositors, having to fly cash in by helicopters to meet the local cash flow needs.
The troubled bank in San Francisco, however, was much larger than the example cited, and the former Fed bank president speculated that there was not enough cash in the vaults of the regional Federal Reserve Bank, let alone the entire Federal Reserve System, to cover a true run on deposits at the major bank.
Therein lies an early problem for a system headed into hyperinflation: adequate currency. Where the Fed may hold roughly $30 billion in currency outside of $50 billion in commercial bank vault cash, the bulk of roughly $770 billion in currency outside the banks is not in the United States. Back in 2000, the Fed estimated that 50% to 70% of U.S. dollar cash was outside the system. That number probably is higher today, with perhaps as little as $150 billion in physical cash present in the United States, or roughly 0.009% of M3.
The rest of the dollars are used elsewhere in the world as a store of wealth, or as an alternate currency free of the woes of unstable domestic financial conditions. In Zimbabwe, for example, where something akin to hyperinflation is underway, U.S. dollars are used to maintain some semblance of economic activity, where wages and salaries seriously lag inflation, and goods often are available only on the black market.
My fairly crude definition of hyperinflation is a circumstance, where, due to rising prices, the largest pre-hyperinflation bank note becomes worth more as toilet paper/tissue than as currency. With limited physical cash in the system, existing currency would disappear quickly as a hyperinflation broke.
For the system to continuing functioning in anything close to a normal manner, the government would have to produce rapidly an extraordinary amount of new cash, and electronic commerce would have to be able to adjust to rapidly changing prices.
In terms of cash, new bills of much higher denominations would be needed, but production lead time is a problem. Conspiracy theories of recent years have suggested the U.S. Government already has printed a new currency of red-colored bills, intended for some dual internal and external U.S. dollar system. If such indeed were the case, then there might be a store of "new dollars" that could be released at a 1-to-1,000,000 ratio, or whatever ratio was needed to make the new currency meaningful, but such would not resolve any long-term problems, unless it were part of an overall restructuring of the domestic and global financial and currency systems.
From a practical standpoint, however, currency would disappear, at least for a period of time in the early period of a hyperinflation.
Where the vast bulk of today's money is not physical, but electronic, however, chances of the system adapting here are virtually nil. Think of the time, work and effort that went into preparing computer systems for Y2K, or even problems with the recent early shift to daylight savings time. Systems would have to be adjusted for variable, rather than fixed pricing, credit card lines would need to be expanded daily, the number of digits used in tallying dollar-denominated transactions would need to be expanded sharply.
From a practical standpoint, the electronic quasi-cashless society of today also would shut down early in a hyperinflation. Unfortunately, this circumstance rapidly would exacerbate an ongoing economic collapse.
Barter System. With standard currency and electronic payment systems non-functional, commerce quickly would devolve into black markets for goods and services and a barter system.
Unlike Zimbabwe, the United States does not have widely available, for circulation, a back-up reserve currency for use in place of a highly-inflated domestic currency. The alternative here is in the traditional monetary precious metals. Gold and silver both are likely to retain real value and would be exchangeable for goods and services. Silver would help provide smaller change for less costly transactions.
Other items that would be highly barterable would include bottles of a good scotch or wine, or canned goods, for example. Similar items that have a long shelf life can be stocked in advance of the problem, and otherwise would be consumable if the terrible inflation never came. Separately, individuals, such as doctors and carpenters, who provide broadly useable services, would have a service to barter.
A note of caution was raised once by one of my old economics professors, who had spent part of his childhood living in a barter economy. He told a story of how his father had traded a shirt for a can of sardines. The father decided to open the can and eat the sardines, but he found the sardines had gone bad. Nonetheless, the canned sardines had taken on a monetary value.
Other Issues. A hyperinflationary depression would be extremely disruptive to the lives, businesses and economic welfare of most individuals. Such severe economic pain could lead to extreme political change and/or civil unrest. What has been discussed here has not been intended as a comprehensive overview of possible issues, but rather to at least raise some questions and touch upon some likely consequences. These matters will be expanded upon over time in the SGS, as circumstances and subscriber reactions dictate. Please feel free to offer your comments or raise your questions by via our Contact Form on www.shadowstats.com.
The just-ended quarter showed stock indices flattening out, along with slowing annual growth. Gold, silver and the British pound put in the strongest showings of any of the tracked measures. Of significance, all three measures tended to preserve the purchasing power that otherwise was lost by the U.S. dollar over the last year.
                  Quarterly Financial-Market Indicators at Quarter-End


                    First-Quarter 2007          Fourth-Quarter 2006
                    Level      Q/Q     Yr/Yr    Level      Q/Q     Yr/Yr
     Equity Market
     DJIA           12,354.35  -0.87%  11.21%   12,463.15   6.71%  16.29%
     S&P 500         1,420.86   0.18%   9.73%    1,418.30   6.17%  13.62%
     Wilshire 5000  14,409.27   1.06%   9.53%   14,257.50   6.53%  13.90%
     NASDAQ Comp     2,421.64   0.26%   3.50%    2,415.29   6.81%   9.52%


     Credit Market(1)
     3-Mo T-Bill        5.04%    2 bp   41 bp       5.02%   13 bp   94 bp
     2-Yr T-Note        4.58%  -24 bp  -24 bp       4.82%   10 bp   41 bp
     5-Yr T-Note        4.54%  -16 bp  -28 bp       4.70%   11 bp   35 bp
     10-Yr T-Note       4.65%   -6 bp  -21 bp       4.71%    7 bp   32 bp
     30-Yr T-Bond       4.84%    3 bp   -6 bp       4.81%    4 bp      na


     Currencies(2)
     US$/Unit
     Pound             1.9685   0.51%  13.20%      1.9586   4.65%  13.95%
     Euro              1.3374   1.34%  10.17%      1.3197   4.02%  11.44%
     Swiss Franc       0.8247   0.57%   7.14%      0.8200   2.53%   7.81%
     Yen               0.0085   1.24%  -0.07%      0.0084  -0.87%  -0.96%


     Precious Metals(3)
     US$ per Troy Ounce
     Gold              661.75   4.71%  13.70%      632.00   5.47%  23.20%
     Silver             13.35   3.49%  13.52%       12.90  11.69%  46.09%


     bp - Basis point or 0.01%. na -- 30-Year Treasury bond was reintroduced
     in February 2006. (1) Constant maturity yield, Federal Reserve Board.
     (2) Federal Reserve Board. (3) London afternoon fix, Kitco.com.
The markets still seem to favor a Fed easing, but recognition of a stymied U.S. central bank has been growing among a number of financial analysts.
Key to what lies ahead is the timing of the likely dollar sell-off. The fundamentals stacked against the greenback have never been worse. When the dollar dumping begins, the other markets will be put in play in a manner that eventually will shake the foundations of the global financial system.
General background note: The U.S. economy remains in a severe, structural inflationary recession, saddled with an impotent Fed and a federal government that is fiscally bankrupt in all but name. In combination, these factors offer the worst of all environments to the financial markets. Ahead lie higher long-term interest rates and much lower U.S. equity prices. On the plus side is the outlook for gold, which provides a solid hedge against many of the problems that have started to surface. Key to the near-term movements of these markets remains the fate of the U.S. dollar.
U.S. Equities -- While the stock market indices remain far removed from underlying reality, they did show some temperance in the first quarter. Eventually, as the recession pummels earnings, as inflation increases beyond expectations, as dollar selling kicks in and interest rates spike, stocks should tank. Again, though, these markets have not been close to sanity for a long time.
U.S. Credit Market -- A discussed earlier, the Fed has signaled inaction for a while, due to stated minimal economic concerns and continued inflation worries. Where the economy is faltering and inflation is rising, the condition of the U.S. dollar is likely to dominate Fed considerations.
With the U.S. credit markets so heavily dependent on foreign capital for liquidity, likely heavy selling of the greenback will tend to spike long-term interest rates and could force the Fed into its next rate move: a tightening aimed at U.S. dollar defense.
While market expectations of the Fed's next action on interest rates may swing wildly with changing economic expectations, the U.S. dollar's behavior remains the primary concern. The U.S. economic and political systems are in trouble, and that will pressure the greenback to the downside.
U.S. Dollar -- Despite sporadic selling bouts, major dollar selling has yet to begin. Massive dollar dumping looms, however, and could hit at any time, with no advance warning. It could be triggered by any number of factors ranging from negative trade developments with Communist China, to increasingly negative economic reports, to political embarrassments for the Federal Reserve or Administration, to a terrorist attack or even a still-likely military action against Iran. Whatever sets off the selling, the turn in the U.S. currency still is a good bet to come within the next several months. Broad selling should be heavy enough to overcome any short-lived central bank intervention.
General background note: In terms of underlying fundamentals that tend to drive currency trading, the dollar's portfolio could not be worse. Relative to major trading partners, the U.S. economy is much weaker, interest rates are lower, inflation is higher, fiscal and trade-balance conditions are abysmal, and relative political stability is near an all time low. The President's approval rating commonly has moved currency trading in the past. Current conditions are the worst seen in the post-World War II era, compounded by the presence of a Congress to the President. Generally, the greater the magnitude of the dollar selling, the greater will be the ultimate inflation pressure and liquidity squeeze in the U.S. capital markets.
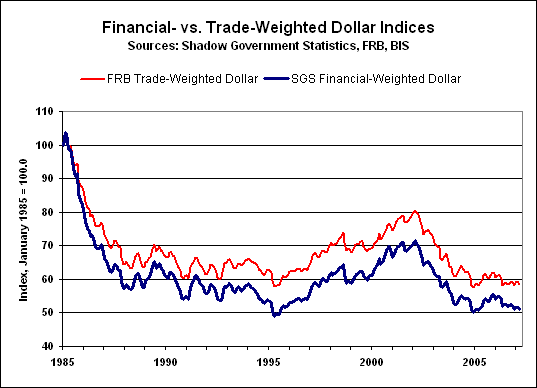
As shown in the following graph, the U.S. dollar moved lower in March.
General background note: Historical data on both dollar series are available for download on the Alternate Data page of www.shadowstats.com. See the July 2005 SGS for methodology.
U.S. Dollar Indices. The Shadow Government Statistics' Financial-Weighted U.S. Dollar Index (FWD) is based on dollar exchange rates weighted for respective global currency trading volumes. For March 2007, the monthly dollar average fell by 1.11%, after a 0.28% decline in February. The March 2007 average index level of 50.99 (base month of January 1985 = 100.00) was down 7.12% from March 2006, following an annual rate of decline of 6.04% in February.
Also tanking, March's monthly average of the Federal Reserve's Major Currency Trade-Weighted U.S. Dollar Index (TWD) fell by 1.02%, after a 0.36% decline in February.
The March 2007 index level of 58.45 (base month of January 1985 = 100.00) was down 4.44% from the year before, against February's annual decline of 3.50%.
General background note: The biggest difference between the FRB and the SGS series is the much heavier weighting of the Canadian dollar in the TWD versus the FWD.
Gold -- The price of gold has continued trending higher, but the upside potential remains explosive, particularly when heavy dollar selling begins.
The nature of gold trading is such that high volatility likely will continue, as will sporadic central-bank manipulation. Jawboning as to selling gold is a popular ploy by central bankers, but they know very well that they should be increasing their gold holdings, not liquidating them.
General background note: As discussed in the Hyperinflation Series, the eventual complete collapse of the U.S. dollar -- the world's reserve currency -- will force the creation of a new international currency system. Gold likely will be structured into any replacement system in an effort by those organizing the new currency structure to gain public acceptance.
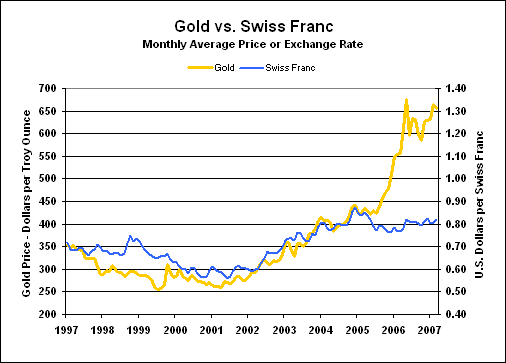
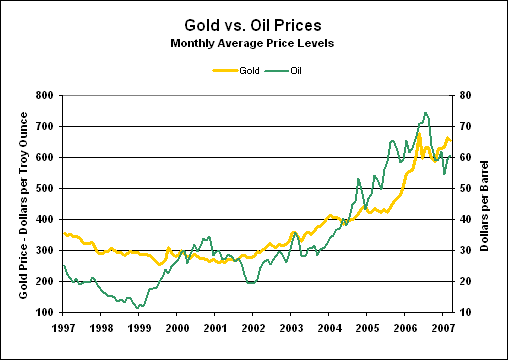
The updated gold versus oil and Swiss franc graphs show March averages. As we go to press, gold is trading around $673, oil is under $64 and the Swiss franc is trading near $0.82. Look for all three measures to trade significantly higher before mid-year.
The Big Three Market Movers
With most of the December/January weather abnormalities out of the system, market sentiment has begun shifting back towards a combination of recession and inflation. Nonetheless, beyond the short-term data distortions, recent and upcoming releases of the major series are, and likely will continue to be, subject to massaging for both the perceived political needs of the Administration and the heavy financial market needs of the Federal Reserve Board.
General background note: The reality of the deteriorating, underlying inflationary recession increasingly is surfacing in the popularly followed economic series. Against lagging and still largely distorted market expectations, most near-term economic reporting will surprise the markets on the downside, while most inflation reporting should surprise the markets on the upside.
Employment/Unemployment -- Seasonally-adjusted March payroll employment was reported up by 180,000 (212,000 net of revisions) +/- 129,000. The March increase followed a revised February gain of 113,000 that initially had been reported at 97,000. Though March payrolls were stronger than expected by the markets, annual growth in March slowed to 1.46%, its slowest pace in nearly three years, following February's 1.51% annual growth rate.
As has been the ongoing pattern for a number of months, the Bureau of Labor Statistics (BLS) continued with major upward revisions to previously published data. Nothing appeared to be extraordinarily out of whack with the March payroll seasonal factors, other than possible lingering weather effects. Underlying data reported with help-wanted advertising, new claims for unemployment insurance and the employment components of the purchasing managers series, however, all have continued signaling contractions in current payroll reporting.
The jobs number was boosted by a positive monthly fudge or bias factor (now called the birth-death adjustment, which overestimates employment growth during recessions) of 128,000. For April of last year, that factor increased to 271,000, suggesting some further upside pressure on next month's payroll reporting.
From the household survey, seasonally-adjusted March employment rose by 335,000, after contracting by 38,000 in February. This number reflects the number of people who have at least one job, versus the payroll survey that counts the number of jobs.
Also from the household survey, the seasonally-adjusted March U.3 unemployment rate purportedly narrowed to 4.40% +/- 0.23% from 4.49% in February, a change that was statistically indistinguishable from an increase in the unemployment rate. On an unadjusted basis, U.3 narrowed to 4.5% in March from February's 4.9%. The broader U.6 rate on an unadjusted basis fell to 8.3% in March from 8.7% in February, where the seasonally-adjusted U.6 rate declined to 8.0% from February's 8.1%. Net of "discouraged workers" defined away during the Clinton Administration, actual unemployment continues to run about 12%.
Next Release (March 4): The April payroll survey should be weaker than expected, despite the ongoing increase in the bias factor. Look, too, for the unemployment rate to rise anew.
Gross Domestic Product (GDP) -- The "final" estimate revision of annualized real (inflation-adjusted) growth for fourth-quarter 2006 was 2.45% +/- 3%, versus the preliminary estimate of 2.22% and the advance estimate of 3.47%. Growth still was up from the third quarter's 1.96% pace and the second-quarter's 2.56%, but it was down from the first quarter's 5.58%. Measured fourth-quarter 2006 over fourth-quarter 2005, real growth revised to 3.13% from the last estimate of 3.07%, little more than statistical noise.
The downside revisions suggested by parallel, intervening revisions in production, housing and retail sales did not materialize. Such opened the mid-year GDP annual benchmark revision to likely, major downside changes.
The official estimates for real, annualized, quarterly fourth-quarter growth in gross national product (GNP) and gross domestic income (GDI) finally were published. GNP growth was unusually strong at 3.49%, up from 1.76% in the third quarter. This suggests some unusual games playing with data on foreign holdings of U.S. financial assets (see this month's Reporting/Market Focus). GDI growth was 3.37% in the fourth quarter, following a 0.29% contraction in the third quarter. Variability in the GDI series is due to changes in the level of statistical discrepancy between the consumption-side GDP measure and the income-side GDI, which, in theory, should be equal to each other.
While the GDP report is the government's broadest estimate of U.S. economic activity, it is also the least meaningful and most heavily massaged of all major government economic series. Primarily it has become a tool for economic propaganda.
Adjusting for methodological distortions built into GDP reporting over time, the SGS Alternate GDP measure suggests economic reality is much weaker than officially reported, with a year-to-year annual contraction of roughly 1.5% for fourth-quarter 2006 GDP, the same as the third quarter's 1.5% (see the graph in the Alternate Reality section in the Opening Comments).
Next Release (April 27): Partially reflecting deteriorating underlying economic activity, the "advance" estimate of first-quarter 2007 GDP should come in below what otherwise should be relatively positive consensus forecasts.
Consumer Price Index (CPI) -- The Bureau of Labor Statistics reported the seasonally-adjusted February CPI-U (I.6) up by 0.40% (0.54% unadjusted) +/- 0.12% (95% confidence interval) for the month, following January's 0.17% gain (0.40% unadjusted). Annual inflation rose to 2.42% in February, from January's 2.08%.
Annual inflation for the Chain Weighted CPI-U (C-CPI-U) (I.5) -- the presumed eventual substitution-based replacement series for CPI-U -- was 2.2% in February, versus 1.9% in January.
Adjusted to pre-Clinton methodology (I.7), annual CPI growth was about 5.7% in February, up from 5.4% in January. The SGS Alternate Consumer Inflation Measure (I.8), which reverses gimmicked changes to official CPI reporting methodologies of recent decades, was 10.0% in February, up from January's 9.9%.
The eight levels of annual inflation, I.1 to I.8, are shown in the table in the Alternate Reality section, as is the plot of the SGS Alternate Consumer Inflation number.
Next Release (April 17): Annual inflation still is far from peaking, but it will take some months into 2007 to regain its recent high annual rates. Seasonally-adjusted, monthly CPI-U increased by 0.3% in March 2006. Any monthly reporting above or below that for the pending release of March 2007 CPI will add or subtract directly to or from the annual CPI-U inflation rate. Reporting likely is to be on the upside of market expectations. Upside movement in core rates, in particular, will tend to surprise the markets.
Federal Deficit -- As discussed in the December SGS, the federal government's fiscal 2006 (fiscal year-end September 30th) deficit, prepared based on generally accepted accounting principles (GAAP), widened to $4.6 trillion from 2005's $3.5 trillion. Those numbers dwarfed the officially-gimmicked 2006 federal budget deficit of $248.2 billion, which was down $70.8 billion from 2005's $318.5 billion.
Though still lacking the accrual accounting of the GAAP numbers, the change in gross federal debt is a better indicator of actual net cash outlays by the federal government than is the gimmicked deficit reporting. As of fiscal year-end 2006, the gross federal debt stood at $8.507 trillion, up by $574 billion from 2005, which in turn was up $554 billion from 2004.
For the rolling 12 months through February 2007, the gimmicked deficit was $192.7 billion versus $312.6 billion in February 2006, compared with rolling deficits of $191.9 billion and $307.3 billion in January of 2007 and 2006. For March 31, 2007, the gross federal debt stood at $8.850 trillion, up by $479 billion from March 2006, which in turn was up by $594 billion from March 2005. As of February 28, 2007, the gross federal debt stood at $8.778 trillion, up by $508 billion from February 2006, which in turn was up by $557 billion from February 2005. As of January 31, 2007, the gross federal debt stood at $8.708 trillion, up by $511 billion from January 2006, which in turn was up by $568 billion from January 2005.
General background note: The Administration and Congress continue playing bookkeeping games. Even so, the gimmicked deficit should widen this year, as government finances suffer increasingly from tax revenue losses due to the intensifying recession and relative tax receipt declines after the expiration of recent tax incentives. While GDP growth estimates can be gimmicked, incoming tax receipts (based on consistently applied tax policies) remain an independent estimate of underlying economic reality and eventually will reflect the economy's mounting difficulties.
Initial Claims for Unemployment Insurance -- Annual change in initial claims has continued rising into positive territory (an economic negative) in tandem with job market deterioration. On a smoothed basis for the 17 weeks ended March 31st, annual growth rose to 5.5%, compared with 3.9% for the 17 weeks ended February 10th.
General background note: More often than not, week-to-week volatility of the seasonally-adjusted weekly claims numbers is due to the Labor Department's efforts to seasonally adjust these numbers around holiday periods. The Labor Department has demonstrated an inability to do such adjusting successfully. When the new claims series is viewed in terms of the year-to-year change in the 17-week (four-month) moving average, however, such generally is a fair indicator of current economic activity.
Real Average Weekly Earnings -- February's seasonally-adjusted real earnings fell by 0.3%, following a 0.3% decline in January. Annual growth slowed to 1.5% in February, from 2.2% in January.
General background note: Gyrations in the poor quality of reported CPI growth account for most month-to-month volatility in this series. Adjusting for the major upside biases built into the CPI-W inflation measure used in deflating the average weekly earnings, annual change in this series shows the average worker to be under severe financial stress in an ongoing recession.
Retail Sales -- Still wobbling from weather distortions, February's seasonally-adjusted retail sales rose by 0.1% +/- 0.9% (95% confidence interval) (zero growth net of revisions), following zero growth in January. With CPI up by 0.4% in February and by 0.2% in January, 2007 has started off with negative inflation-adjusted retail sales growth. Net of inflation, first-quarter retail sales are on track to show a quarterly real contraction, an event rarely seen outside of recession. Net of inflation, annual growth in February retail sales was 0.8%, against 0.1% in January.
Based on the March 29th benchmark revision, seasonally-adjusted February retail sales still were up 0.1% for the month. Revised retail sales levels from the benchmark revision as well as historical detail of year-to-year change on a monthly basis are shown in the graphs in this month's Opening Comments.
General background note: Real (inflation-adjusted) year-to-year growth in retail sales below 1.8% (using the official CPI-U for deflation) signals recession, and a signal first was generated in this business cycle back in June 2006.
Next Releases (April 16): March retail sales, due for release on April 16th, should continue coming in below market expectations and below the rate of inflation. Inflation-adjusted growth likely will be negative for the first quarter versus the fourth quarter.
Industrial Production -- As noted in the Flash Update of March 18th, seasonally-adjusted industrial production rose by 1.0% in February, following a 0.3% contraction in January (previously reported as a 0.5% contraction). These monthly numbers, however, continued gyrating in the aftershocks of the unusual weather of the last three months. February utility usage surged by 6.7% in the month, for example, which should have been close to zero if the weather and seasonal adjustments were moving in tandem. With similar distortion, annual growth as of February rose to 3.4% from 2.7% in January.
Revisions to fourth-quarter industrial production left that quarter's seasonally-adjusted annualized quarterly contraction at 1.25%, a deeper tumble than the 0.78% reported last month, and suggestive of eventual downside revision to fourth-quarter GDP.
Next Release (April 14): Look for monthly industrial production to resume contraction in March. Monthly contractions in this series shortly should become regular.
New Orders for Durable Goods -- The usually volatile durable goods orders rose in February by 2.5% (1.5% net of revisions), after a 9.3% (previously 7.8%) January plunge. February's orders fell by 0.3% from the year before, following January's 3.2% annual gain. Annual growth in durable goods orders has held at or near recessionary levels for five months.
The closely followed nondefense capital goods orders rose by 9.5% in February, following January's 19.1% (previously 19.9%) fall. February's annual growth rate for nondefense capital goods orders was down 6.9%, following January's 6.2% gain.
General background note: Durable goods orders lost its status as a solid leading economic indicator when the semi-conductor industry stopped reporting new orders.
Trade Balance -- As discussed in Flash Update of March 11th, the seasonally-adjusted monthly trade deficit for January 2007 was reported at $59.2 billion, down from $61.5 billion in December (previously reported as $61.2 billion). For all of 2006, the annual deficit revised to $765.3 billion, from initial reporting of $763.6 billion, up from $716.6 billion in 2005. The handling of reported oil imports and related pricing, however, has resulted in distortions to reporting of the 2006 trade deficit, the purported January deficit and related GDP measures.
The Bureau of Economic Analysis/Census Bureau release shows seasonally-unadjusted crude oil imports up by 6.3% year-to-year in January, 5.7% attributable to physical oil import volume and 0.6% attributable to higher oil prices. Somehow, that translated to a seasonally-adjusted annual contraction of 1.9% in the aggregate trade statistics for petroleum products, before adjustment for inflation, and to a 1.3% gain after inflation adjustment. That could happen only with a 3.2% drop in prices used in the deflation process, not the 0.6% gain shown in the raw data.
The difference is that with the year-to-year oil imports handled on a consistent basis, petroleum imports would have been higher in January by about $2.1 billion, which would have taken the total monthly January deficit to $61.3 billion, virtually unchanged versus $61.5 billion in December.
The oil-pricing distortions are much more severe, however, where the full extent of the increase in oil prices during the last two years never made it into the imported-oil pricing. For example, January 2006 oil averaged $51.93 per barrel in the trade data, versus a market average of $65.10. In January 2007, the trade data oil was at $52.23, against a market average of $54.57. This circumstance suggests that the 2006 trade deficit is understated sharply and that the corresponding 2006 GDP is overstated.
Next Release (April 13): The February trade deficit should show some rebound from ongoing recent understatement, assuming oil import prices catch-up with the markets. Reporting risk remains on the upside of consensus forecasts. The months ahead should see a pattern of regularly increasing deficits that once again will be setting new records by mid-year 2007.
Consumer Confidence -- March confidence measures declined on a monthly basis, following mixed results in February. The Conference Board's March consumer confidence dropped 3.6% month-to-month, after a 0.9% (initially 2.1%) gain in February and a 0.2% increase in January. For March the University of Michigan's consumer sentiment declined by 3.2%, after February's 5.8% drop and January's 5.7% increase.
On a three-month moving-average basis for March, year-to-year change in confidence was up by 3.7%, versus 5.8% in February, while annual growth in sentiment slowed to 3.7% from 3.9% in February. The slowing annual growth in these lagging, not leading, indicators continues to show that the economy has been in trouble.
General background note: The Conference Board measure is seasonally adjusted, which can provide occasional, but significant distortion. The adjustment does not make much sense and is of suspect purpose, given that the Conference Board does not release the unadjusted number. The Michigan survey is unadjusted. How does one seasonally-adjust peoples' attitudes? Also, beware the mid-month Consumer Sentiment release from the University of Michigan. Its sampling base is so small as to be virtually valueless in terms of statistical significance.
Short-Term Credit Measures -- Annual growth in consumer and commercial borrowing continued mixed in the most recent reporting.
Seasonally-adjusted consumer credit (which does not include mortgages) grew by just 0.1% in the month of February, with annual growth at 4.5%, following 4.4% in January and 4.6% in December. In the current environment, where inflation-adjusted growth in income is not adequate to support meaningful growth in the personal consumption component of GDP, GDP growth only can come from temporary debt expansion or savings liquidation. Consumer debt expansion has stalled on a monthly basis, suggesting a major constraint on economic growth.
Commercial borrowing remains strong on a year-to-year basis. Annual growth in commercial paper outstanding was 19.3% in March, up from 18.6% in February and 18.3% in January, but still down from December's 21.5%. Annual growth in commercial and industrial loans was 13.0% in February, down from 13.4% in January, and down from 14.6% in December. Where solid growth in the commercial credit measures can signal credit needs tied either to rising sales and receivables/inventory, or to slowing sales and slowing collections and involuntarily rising inventories. Slowing growth usually is a sign of slowing economic activity.
Producer Price Index (PPI) -- Seasonally-adjusted February finished goods rose a seasonally-adjusted 1.3% (1.1% unadjusted), after a 0.6% drop (0.8% gain unadjusted) in January. Annual PPI inflation rose to 2.5% in February from 0.2% in January. Seasonally-adjusted intermediate and crude goods rose 1.1% and 8.9% respectively for the month of February.
Next Release (April 13): Despite random volatility in monthly price variations, PPI inflation reporting over the next six-to-nine months remains likely to exceed market expectations. In particular, March's core inflation rate is subject to an upside surprise.
General background note: The following numbers are generally good-quality leading indicators of economic activity and inflation that offer an alternative to the politically-hyped numbers when the economy really is not so perfect. In some instances, using a three-month moving average improves the quality of the economic signal and is so noted in the text.
Economic Indicators
Purchasing Managers Survey: Manufacturing New Orders -- The overall March ISM manufacturing index sank anew to 50.9 from 52.3 in February. The February reading had bounced above the 50.0 recession/expansion dividing line from 49.3 in January. The March employment component once again sank into recession territory at 48.7, down from 51.1 in February and lower than January's 49.5 reading. Recent seasonal factor distortions appear to be working their way out of the system.
The March new orders index rose fell back to 53.0 from February's 54.9, but still was higher than January's 50.3, where, again, bad seasonals may have been altering the reported story. Seasonal-factor distortions are overcome by viewing the series using year-to-year change on a three-month moving average basis. On that basis, the March new orders index fell by 13.0% compared with annual contractions of 11.2% in February and 13.6% in January.
General background note: Published by the Institute for Supply Management (ISM), the new orders component of the purchasing managers survey is a particularly valuable indicator of economic activity. The index is a diffusion index, where a reading below 50.0 indicates contracting new orders. The index gradually has notched lower from its peak annual growth of 42.6% in April of 2004. As an SGS early warning indicator of a major economic shift, the new orders measure breached its fail-safe point in mid-2005, generating a signal of pending recession.
Service Sector Index. The service-sector ISM index does not have much meaning related to overall business activity, since new order activity at law firms, hospitals or fast-food restaurants has little obvious relationship to broad economic activity. That said, the overall March services sector index fell to 52.4, from 54.3 in February and 59.0 in January. Both the services employment and prices paid components, however, have some meaning. The March employment component fell to 50.8 from 52.2 in February and was lower than January's 51.7 reading. The prices paid component is covered in the Inflation Indicators.
Help-Wanted Advertising Index (HWA) -- The Conference Board reported that help-wanted advertising fell to 31 in February from 32 in January, following a reading of 34 in December that initially had been reported at 33. The February number was down 20.5% from the year before. Even so, this series seems to have been distorted to the upside in December and January by recent weather abnormalities.
Viewed on a three-month moving average basis, February's year-to-year change was a contraction of 15.7%, versus January's 16.7% drop and December's 19.3% contraction. Despite short-term volatility, the series still indicates rapidly deteriorating employment conditions. Where the index never recovered from the 2000/2001 recession, its recent plunge signaled a renewed and rapid contraction in economic activity. Continued near-term deterioration remains likely in the months ahead.
Housing Starts -- For the month, seasonally-adjusted February housing starts rose 9.0% +/- 13.3% (95% confidence interval included 0), after falling by 14.3% in January. Year-to-year change was a contraction of 28.5%, compared to a 38.2% decline in January.
Due to the volatility of the data -- particularly from recent weather distortions -- the numbers for annual change best are viewed on a three-month moving-average basis. So calculated, the February year-to-year drop was 28.8%, compared with 28.2% in January, the worst reading since the depths of the 1990/1991 recession. The series continued to signal an intensifying recession.
Related data tend to confirm the housing contraction and deepening recession. In reporting as of January, fourth-quarter 2006 new home sales grew at an annualized quarterly rate of 13.5%. After the February revisions, the quarter was down at annualized pace of 2.6%, a big enough shift to add to eventual downside revision pressure to fourth-quarter GDP growth.
Seasonally-adjusted February new home sales fell 3.9% (9.5% net of revisions) for the month, and were down 18.3% year-to-year. That followed a revised 15.8% monthly contraction in January (was 16.6%) with a revised 24.8% (was 20.1%) year-to-year plunge. Seasonally-adjusted existing home sales in February rose by 3.9% for the month, after a 2.7% increase in January, but February sales still were down 3.6% for the year, compared with a 4.6% decline in January. Since new home sales data are based on contract signings, where existing home sales data are based on closings, the latter series still was working on activity from December 2006.
Money Supply -- Annual growth in the SGS Continuing M3 appears to have jumped to 11.6% in March, at first estimate, after having eased back a notch in February to 10.9%. January annual growth was 11.0%. The Continuing M3 growth rates are strong enough that they would be creating some discomfort in the credit markets, if they still were published by the Federal Reserve. The graph reflects the estimates through February. The formal March money supply numbers will be published on the Alternate Data page this coming weekend.
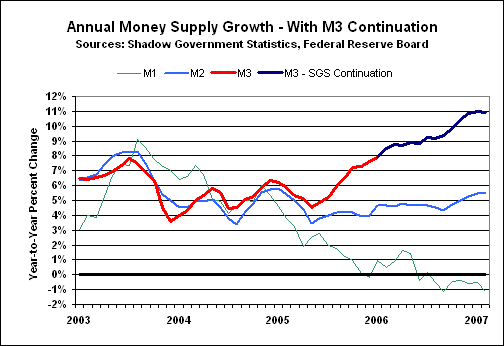
General background note: Historical annual growth data for the money supply series, including the ongoing SGS estimates of M3, are available for download on the Alternate Data page of www.shadowstats.com. See the August 2006 SGS for methodology.
Before inflation adjustment, seasonally-adjusted February M1 and M2 respectively fell by 0.9% and rose by 0.4% for the month, after monthly increases of 0.4% and 0.9% in January. On a monthly basis, seasonally-adjusted M3 was up roughly 1.0% in February, after a 0.8% increase in January.
Annual growth in February for monthly M1 fell by 1.2%, versus a 0.5% contraction in January, while annual February M2 growth was 5.6%, following 5.5% in January. Net of distorted annual CPI inflation, real annual growth rates for February M1 and M2 remained consistent with the ongoing recession, with February's M1 and M2 year-to-year rates of change down by roughly 3.5% and up 3.1%, respectively. On a three-month moving-average basis, the February inflation-adjusted annual rates of change were down 3.0% and up 3.0%, growth rates that still were underwater using the old-style CPI.
Inflation Indicators
Purchasing Managers Surveys: Prices Paid Indices -- The March prices paid indices rose sharply, penetrating more deeply into inflationary territory in both purchasing managers surveys.
In line with oil price changes, the price index movements have remained volatile. On the manufacturing side, the March price index jumped to 65.5 from 59.0 in February and from 53.0 in January. On a three-month moving average basis, March's annual change was down by 8.5% versus February's 16.8% contraction and January's 23.7% drop.
On the non-manufacturing side, the March prices diffusion index jumped to 63.3 from 53.8 in February and versus 55.2 in January. On a three-month moving average basis, March's annual change was a decline of 12.0%, following respective annual contractions of 16.8% and 18.7% in February and January.
General background note: Published by the Institute for Supply Management (ISM), the prices paid components of the purchasing managers surveys are reliable leading indicators of inflationary pressure. The measures are diffusion indices, where a reading above 50.0 indicates rising prices.
Oil Prices -- The monthly-average West Texas Intermediate Spot (Department of Energy) rose to $60.56 in March, up from $59.26 per barrel in February and $54.57 in January. Where the March average price was down 3.7% from the year before -- close to February's annual decline of 3.8% -- such was a smaller annual contraction than the 16.7% seen in January. Highly volatile prices continue, with current oil prices currently trading below $64 per barrel and likely to average above March's average level.
Middle Eastern political tensions once again are on the rise. Global political conditions still continue to favor a sharp spike in oil prices in the months ahead, irrespective of any ongoing games playing by the Administration and OPEC. Overhanging the market remains the potential for a change in the dollar-based pricing of oil. Dollar weakness has started to resurface coincidentally with the circumstances in Iran and North Korea heating up.
As noted in earlier newsletters, where dollar weakness is the equivalent of an oil price cut for oil purchasers denominated in an appreciating currency, market forces tend to push dollar-based oil prices higher, and that exacerbates inflation problems in the United States. Even worse, if oil pricing were shifted to something other than the U.S. currency, U.S. inflationary pressures would be even more intense, since any drop in the dollar would be reflected directly as an increase in the price of foreign oil for U.S. consumption.
General background note: Whether from supply and demand, geo-political or currency pressures, oil prices will remain at highly inflationary levels and will continue as a major contributing factor to U.S. inflation woes. Historically high oil prices still are working their way through all levels of U.S. economic activity, ranging from transportation and energy costs, to material costs in the plastics, pharmaceutical, fertilizer, chemical industries, etc. These broad inflationary pressures will remain intact despite any near-term oil price volatility. Although these pressures may be slow to surface in government reporting of the so-called "core" inflation measures, even the gimmicked core measures have started to show persistently high rates of price increases that should be adding to the distress of the U.S. financial markets. also, as confirmed in recent reporting, downside oil price movements are picked up more quickly and fully by the BLS in its inflation measures than are upside movements. Nonetheless, the general trend in both CPI and PPI reporting -- at both the aggregate and core levels -- will be to the upside through at least the next six months.
A key concern for the U.S. financial markets is foreign willingness to continue holding U.S. dollar-denominated assets, particularly U.S. Treasuries, in an environment where most investors and central banks recognize that the dollar broadly is overvalued against most other major Western currencies. The latest flow of funds data are murky in this area, although there is some suggestion that foreign investors consumed a smaller portion of net Treasury issuance in 2006 than was seen in 2004 and 2005.
In recent newsletters, I have raised questions as to the quality of statistical reporting at the Board of Governors of the Federal Reserve System (FRB), separate from the elimination of M3 reporting. In particular, unusual patterns and revisions have shown up in Flow of Funds (FOF) reporting -- accounts that show the sources and uses of cash and credit within the U.S. financial system and economy. Some of these anomalies are explored as they relate to foreign holdings of Treasury securities. The problems, however, are widespread in FOF accounting.
Consider the following example. The FRB's fourth-quarter 2006 FOF report (released March 8, 2007) showed the year-end 2005 level of U.S. Treasuries held by the "Rest of World," or foreign investors, at $1,993.8 billion, versus $1,803.5 billion at year-end 2004, an annual increase of $190.3 billion, using simple arithmetic.
The annual change reported in the flow tables, however, showed an increase of $287.1 billion for year-end 2005 over year-end 2004, a greater increase by $96.8 billion! Similar patterns in are seen in prior years.
In theory, the two approaches should come up with the same amount of change. Indeed with FOF showing the total level of Treasuries (public debt) outstanding increasing from $4,370.7 billion at year-end 2004 to $4,678.0 billion at year-end 2005, both the level differential and the flow number are the same at $307.3 billion. Unlike a number of other FOF accounts, there is no formal "discrepancy" category to balance out otherwise unbalanced bookkeeping. So where is the difference?
A similar analysis of Treasury holdings by U.S. Households shows the year-end 2005 level of $563.4 billion was down by $1.9 billion, but the flows showed an annual decline of $98.8 billion, a direct offset to the "Rest of World" discrepancy.
The FRB was helpful in explaining the matter. There is no error in the reporting, but rather some issues with the underlying source data, which in this case are provided by the Bureau of Economic Analysis (BEA), which also publishes the heavily politicized GDP report. Separate data are used for tracking flows and levels, and they do not agree. When the flows are balanced out, all unresolved differences fall into the "Households" account, which is not surveyed separately. As to which numbers best reflect foreign purchases of U.S. Treasuries, the Fed indicated the flows probably were better, while the levels were better in indicating the total amount held by foreign interests.
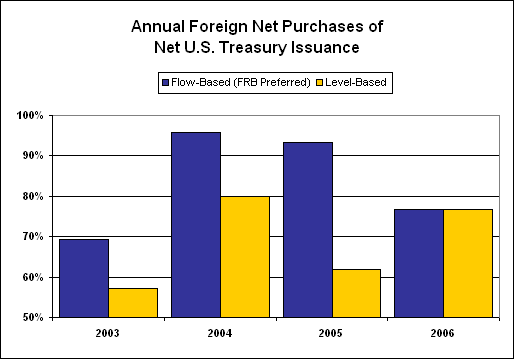
Accordingly, the two following graphs show alternate realities as reported by the FRB. In the first graph, foreign buying of U.S. Treasuries accounted for 69% of net Treasury issuance in 2003, 96% in 2004, and 93% in 2005 and then dropped back to 77% in 2006. A slowing in foreign purchases of U.S. Treasuries is evident in the "preferred" flow-based numbers. Of course, foreign purchases rose from 62% of net Treasury issuance in 2005, to 77% in 2006 using the difference-in-level approach. The current identical readings for 2006 will disappear when the BEA revises its base data later in the year.
The latest quarterly data are not any more meaningful than the annual tallies. Fourth-quarter 2006 flows, which are seasonally adjusted at an annualized rate, show the Rest of World net acquisition of Treasuries at $279.9 billion or 177.5% of net issuance of $157.7 billion. On the change-in-level basis, where the numbers are not seasonally adjusted, the Rest of World net acquisition of Treasuries was $70.0 billion ($280 billion annualized) or 119.7% of net issuance of $58.5 billion ($234 billion annualized).
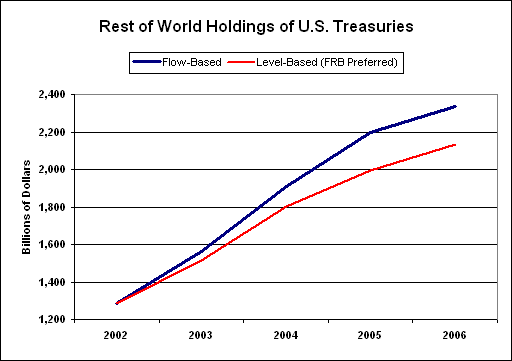
Of course, if annual foreign debt holdings really increased by the amounts indicated in the flow-based numbers, then the level data should be higher. The second graph shows the difference starting just with the level reported for year-end 2002. The lower line, which represents reported level, would be the "preferred" Fed approach. The upper line shows the levels implied by adding on the annual flows.
These problems, exacerbated with major discrepancies of a similar nature in other accounts, suggest the FOF numbers have limited meaning and usefulness. Accordingly, we will not provide regular quarterly analyses of the data, except to highlight unusual issues in government reporting or to use a very rough and broad estimate of key numbers.
No Big Deal?! A subscriber brought my attention to a March 26th Reuters story on Fed Chairman Ben Bernanke's comments on how China's accumulation of U.S. debt is not a problem. From a letter to Sen. Richard Shelby of Alabama:
(1) "Because foreign holdings of U.S. Treasury securities represent only a small part of total U.S. credit market debt outstanding, U.S. credit markets should be able to absorb without great difficulty any shift of foreign allocations ..."
(2) "And even if such a shift were to put undesired upward pressure on U.S. interest rates, the Federal Reserve has the capacity to operate in domestic money markets to maintain interest rates at a level consistent with our economic goals ..."
As to point (1), any foreign holdings of U.S. credit market instruments thrown into the U.S. market are on the margin, and represent two full years of regular credit-market borrowing, to the extent the FOF numbers can be believed. Foreign holdings also are not insignificant in the Treasuries' market. Rest of World holdings of U.S. Treasuries likely are somewhere between 44% and 55% of the total, depending on the numbers used, and Communist China purportedly holds somewhere close to half the total of those foreign holdings.
As to point (2), this where the Federal Reserve accelerates monetizing the federal debt and initiating the early phases of the hyperinflation.
Troubled economic times usually parallel mounting quality problems with consumer and commercial loans. Historical relationships and the current circumstance will be explored.
April's "Shadow Government Statistics" newsletter is targeted for release at the end of the month, so as to include the "advance" estimate of first-quarter 2007 GDP due for release on April 27th. Newsletter timing will be refined and announced in intervening Flash Updates. Postings on the Web site of monthly newsletters, interim Flash Updates and Alerts are advised immediately by e-mail. OCCASIONALLY, BRIEF UPDATES ARE COMMUNICATED BY E-MAIL. IF YOU ARE NOT RECEIVING E-MAIL COMMUNICATIONS FROM US, PLEASE LET US KNOW by using the Contact Form on www.shadowstats.com.