June / July 2007 Edition
Issue Numbers 32 & 33
July 23, 2007
__________
U.S. Dollar Woes Broaden Rapidly
Systemic Liquidity Shows Some Cracks
Bernanke Makes Case For Fudging Inflation Data as Fed Fumbles Its Figures
Oil Pushes Record Highs as Economy Continues Tanking
Stock Market Turmoil, Dollar Sell-Off and Gold Boom Move Ever Closer
__________
PLEASE NOTE: The SGS Ongoing M3 (based on full-month data and corrected for Fed reporting errors) and the SGS June Alternate CPI have been posted to the Alternate Data tab at www.shadowstats.com. Details on schedules for upcoming newsletters are noted at the end of the regular text. Best wishes to all -- John Williams
Against the backdrop of intensifying inflationary recession, the dollar has started taking some early and heavy blows. The sub-prime mortgage difficulties have gained media prominence, but they are just the beginning of difficulties for mortgage and other asset-backed securities. Meanwhile, the Fed keeps sitting on its hands, whistling a tune that inflation is not a problem so long as the public does not see it. At the same time, the U.S. central bank appears to be having trouble tracking the balance sheets of commercial banks. With ongoing annual M3 growth at 13%, alternate CPI at 10.3% and alternate GDP down about 2.2%, apparent complacency by the Fed and euphoria in the record-topping and increasingly volatile equity markets are surreal. Growing recognition of the disconnection between government numbers and economic reality should have even the Wall Street Pollyannas a little bit on edge, as heavy dollar selling and a booming gold market begin moving perhaps a little too close for comfort.
Economic Problems Resurface as One-Month Turnarounds Disappear in Revision. Reporting on business activity in the last month broadly showed slowing or contracting economic activity. Annual growth in retail sales, industrial production, new orders for durable goods, housing starts and help-wanted advertising all were consistent with an unfolding recession.
Revised, annualized first-quarter real GDP growth of 0.7% was seen in conjunction with a 0.3% annualized contraction in Gross Domestic Investment (GDI), the theoretical income-side equivalent of GDP.
The purchasing managers survey continued to be marginally positive in June, suggesting something along the lines of stagnation in manufacturing activity. Other economic data, however, indicate that further survey changes will be downhill from here.
Although the June employment data were in line with market expectations, prior-period revisions showed higher levels of employment than previously indicated. There are games being played with the employment data that suggest an agendum by the Administration for something other than accurate reporting. Looking at the finer detail in the unemployment rate, the seasonally-adjusted series showed almost a 0.1% increase, which did not surface in the summary numbers due to a fortunate rounding.
One pattern of data revision that has been seen recently in key series is a strong initial report, followed by subsequent downward revisions. Looking at housing starts, for example, as shown in the first graph, the April gain that was touted by the markets a harbinger of better times for the industry, revised away in May and June reporting. Likewise, June's small gain is likely to disappear next month.
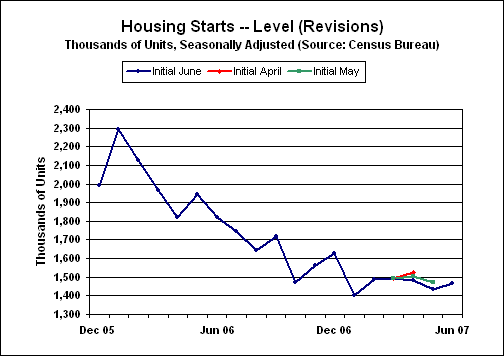
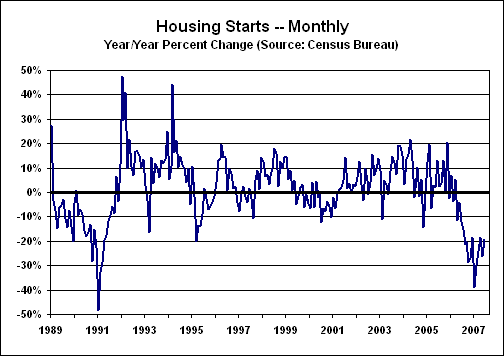
The second graph shows the monthly volatility in the annual growth patterns of the housing starts series. The swings remain well within recession range.
Fed Games and Central Banking Data Problems. Inflation will be fine, so long as the public does not catch on to there being a problem. Such was the gist of a July 10th speech given by Federal Reserve Chairman Ben Bernanke to fellow academics at a National Bureau of Economic Research (NBER) function.
Inflation expectations are key to the development of an inflation problem, he argued. If the public expects inflation, individuals are inclined to participate in inflationary actions, such as trying to get pay raises. Fortunately, noted the Fed Chairman, inflation expectations were contained at the moment.
Keep in mind that Mr. Bernanke considers himself to be an academic, and thus he does not have to deal with the real world all the time. Could Fed efforts to contain the public's inflation expectations explain the silliness of the Fed's trying to sell as the best inflation measure the concept of core inflation, based on a substitution-weighted index, such as the core personal consumption expenditure (PCE) deflator? Could the effort to obfuscate public recognition of an inflation problem have encouraged the gimmicking and underreporting of CPI inflation?
Contrary to Mr. Bernanke's wishful thinking, Main Street U.S.A. already recognizes inflation as an issue, but the Fed Chairman cannot see that in the gimmicked numbers he likes to review.
The Fed's shaky numbers, however, go well beyond the CPI. I was not kidding when noting in the July 1st Flash Update that, "The Fed seems to be having trouble counting time deposits."
Here is a special notice posted by the Federal Reserve Board on July 20th, related to its publication "H.8 Assets and Liabilities of Commercial Banks in the United States:"
Supplementary Information Regarding Balance Sheet Data for July 11, 2007
The seasonally adjusted data released on July 13, 2007 -- both the H.8 statistical release and the associated historical data -- were based inadvertently on a set of newly estimated seasonal factors. These seasonal factors did not represent our final estimates and should not have been published.
In today's H.8 statistical release and in the associated historical data, we have restored the previous set of seasonal factors... We will publish newly estimated seasonal factors when they have been finalized.
These "corrections," however, were a great deal more than restated seasonals, since all the large time deposit numbers revised downward, even further than previously. Seasonal readjustments would have had mixed impact, since in the old world of statistically seasonally-adjusted and unadjusted series, both sets of numbers had to add up to the same total over the period of a year. Of course, maybe the Fed has created an innovative generation of seasonals that create enhanced annual results.
On a more serious front, the Fed remains hamstrung -- unable to fight recession or inflation -- and worried about mounting selling pressure on the dollar and systemic liquidity problems. Possible systemic liquidity problems appear to be an increasing concern; the dollar is addressed separately.
Debt upon Debt, Leverage upon Leverage, The Subprime Problems are Symptoms of Bigger Issues. My friend Bill King (The King Report, www.mramseyking.com) has aptly described the financial statisticians, who construct investment-grade securities out of otherwise low-quality or high-risk instruments, as modern day alchemists. Medieval alchemists tried to change base metals into gold, with little success. The modern financial magicians also have their problems.
Whether mortgage-backed securities, asset-backed securities, collateralized debt obligations or related derivatives, statistical models have been used to structure a wide variety of credit instruments and other assets into investment vehicles with desired credit ratings.
Several years back, the International Monetary Fund (IMF) noted with mixed concern and enthusiasm the ability of certain financial industries -- particularly banks -- to repackage their business (credit) risks into investment packages that enabled other industries to take on banking risks they had not had before and perhaps did not fully understand.
A problem with some of the statistical models used in packaging various credit risks (see this month's Reporting/Market Focus), is that poor quality modeling or faulty underlying assumptions have left some instruments open to greater risk of default than otherwise might have been advertised. For example, the literature shows modeling of default risks on some corporate debts that takes no account of the business cycle. Yet, the historical patterns of corporate defaults are heavily correlated with business activity. Defaults rise during recessions.
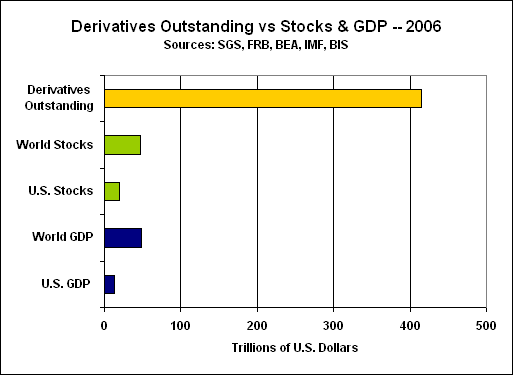
Where the total credit instruments structured into these investment vehicles may exceed $10 trillion, related derivative instruments that leverage these securities still are a small part of a much broader derivatives market that encompasses about $415 trillion -- on a notional basis per the Bank for International Settlements (BIS) -- covering risks including those tied to currencies, interest rates, equities, commodities as well as credit defaults.
Each level of statistical modeling or instrument creation may result in added leverage on the underlying assets and/or may open new risks unrecognized by the investor, due to modeling limitations. The ultimate test of the stability of the existing system and underlying models would be a severe economic downturn, accompanied by heavy dollar selling. I believe those events already are in the works. The difficulties tied to sub-prime mortgage lending suggest that some of the potential difficulties already have started to surface.
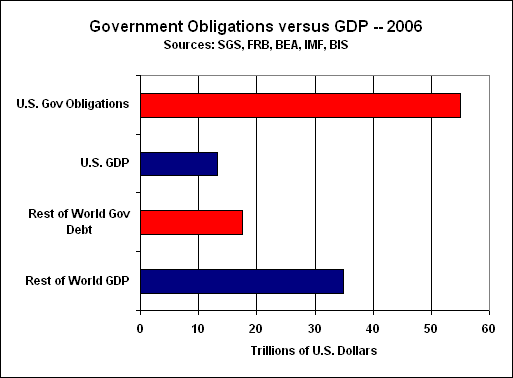
The graphs below were intended to put some big numbers into perspective. The first shows the problem (versus GDP) with current U.S. federal obligations, which have been taken on deliberately by government officials who knew there was no way to pay for them, except possibly through a hyperinflation that would fully debase the U.S. dollar. Though not directly related to the statistical financial modeling discussed here, the issues will become important as dollar selling intensifies, and as the Fed moves to liquefy the domestic financial system in response to derivatives or credit/asset-backed securities crises. The numbers also had been requested by a subscriber.
The second graph is intended to help put the notional size of the derivatives market into perspective. The potential for devastating impact from a small mistake can be quite large.
PLEASE NOTE: A "General background note" provides a broad background paragraph on certain series or concepts. Where the language used in past and subsequent newsletters usually has been or will be identical, month-after-month, any text changes in these sections will be highlighted in bold italics upon first usage. This is designed so that regular readers may avoid re-reading material they have seen before, but where they will have the material available for reference, if so desired.
General background note: The U.S. economy is in a protracted and deepening structural recession that will prove to be the second leg of a double-dip recession, which began in 2000/2001. The current downleg was signaled in mid-2005 by a series of leading indicators used for that purpose by SGS. With neither traditional fiscal nor monetary stimulus available to help turn economic activity, the current circumstance is likely to evolve into a hyperinflationary depression (see December 2006 SGS).
Inflation Precursors Turn Nasty. On the inflation front, although both CPI and PPI reporting in June were tempered by apparent games playing with food prices, underlying food and energy prices are soaring and will work there way into official reporting in the month's ahead. As with energy prices, the Bureau of Labor Statistics is slow to pick up rising prices, but quite fast -- sometimes anticipatory -- in picking up any downturn in prices.
Darkening the inflation outlook, the estimated annual growth in SGS Ongoing M3 held at 13% in June, suggesting upside monetary pressures on prices. Further, the recent accelerating downturn in the U.S. dollar also will add some upside pricing pressures on imports. Rising domestic prices otherwise make it competitively easier for importers to pass along their higher costs.
Early-July Markets Feel Some Foreshocks. Despite ongoing record highs in key stock indices, and relatively benign currency and precious metals markets in the second quarter, early-July trading has shown serious deterioration in the greenback on top of spiking oil and gold prices. Much more of the same will unfold in the months ahead.
The deteriorating inflationary recession, combined with nascent selling pressure against the U.S. dollar, foreshadows the worst of all worlds for the U.S. equity and credit markets. At some point, equity prices will fall sharply, while major currencies outside the dollar, and gold and silver prices, will benefit as well as feed into the unfolding financial turmoil.
Alternate Realities. General background note: This section updates the Shadow Government Statistics (SGS) alternate measures of official CPI and GDP reporting. When a government economic measure does not match common public experience, it has little use outside of academia or the spin-doctoring rooms of the Federal Reserve, White House and Wall Street. In these alternate measures, the effects of gimmicked methodological changes have been removed from the official series so as to reflect more accurately the common public experience, as embodied by the post-World War II CPI and the pre-Reagan-Era GDP. The methodologies for the series are discussed in the August 2006 SGS (see Archives page at www.shadowstats.com).
GDP. The alternate first-quarter GDP growth reflects the "final" estimate revision, with many of the methodological gimmicks of recent decades removed. The alternate first-quarter inflation-adjusted annual growth rate (year-to-year, as opposed to the popularly-touted annualized quarter-to-quarter rate) for GDP was a decline of roughly 2.2% versus the official year-to-year gain of 1.9%. The series is subject to annual revisions due on July 27th. Those revisions and the SGS-Alternate GDP will be reviewed in next month's Reporting/Market Focus.
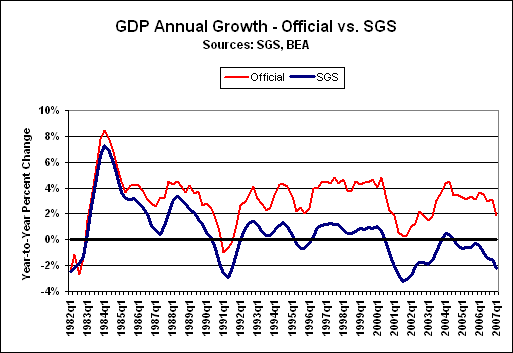
General background note: Historical data on both the official and SGS-Alternate GDP series are available for download on the Alternate Data page of www.shadowstats.com. The Alternate GDP numbers tend to show deeper and more protracted recessions than have been reported formally or reflected in related official reporting. Nonetheless, the patterns shown in the alternate data are broadly consistent with the payroll employment and industrial production series (as revised), which are major indicators used by the National Bureau of Economic Research in determining the official timing of U.S. business cycles.
CPI. The annual non-core annual inflation rates have held at May levels, and the core rates also have been unchanged or down a notch so far in June reporting. Inflation in food-related products is picking up sharply, largely due to supply distortions. Oil prices remain volatile and generally are pushing towards record levels. Beyond related higher energy and material costs increasingly permeating broad economic activity, gasoline prices remain high due to supply problems. Both core and regular annual inflation reporting should rise sharply in the months ahead.
                             Eight Levels of Inflation
                      Annual Inflation for March to June 2007


                                                 2007
          Measure                                Mar    Apr    May    Jun
          I.1 Core PCE Deflator*                  2.1%   2.0%   1.9%   n.a.
          I.2 Core Chained-CPI-U                  2.1%   2.0%   1.9%   1.8%
          I.3 Core CPI-U                          2.5%   2.3%   2.2%   2.2%
          I.4 PCE Deflator*                       2.3%   2.2%   2.3%   n.a.
          I.5 Chained-CPI-U                       2.5%   2.3%   2.3%   2.3%
          I.6 CPI-U                               2.8%   2.6%   2.7%   2.7%
          I.7 Pre-Clinton CPI-U                   6.2%   6.0%   6.1%   6.1%
          I.8 SGS Alternate Consumer Inflation   10.2%  10.2%  10.3%  10.3%


          * Historical series subject to annual revisions on July 27th.
          Notes: I.1 to I.3 reflect the core inflation rates, respectively,
          of the substitution-based personal consumption expenditure (PCE)
          deflator, the Chained-CPI-U and the geometrically-weighted CPI-U.
          I.4 to I.6 are the same measures with energy and food inflation
          included. The CPI-U (I.6) is the measure popularly followed by
          the financial press, when the media are not hyping core inflation.
          I.7 is the CPI-U with the effects of geometric weighting (Pre-
          Clinton Era as estimated by SGS) reversed. This is the top series
          in the CPI graph on the SGS home page www.shadowstats.com.
          I.8 reflects the SGS Alternate Consumer Inflation measure, which
          reverses the methodological gimmicks of the last 25 years or so,
          plus an adjustment for the portion of Clinton-Era geometric weighting
          that is not otherwise accounted for in BLS historic bookkeeping.
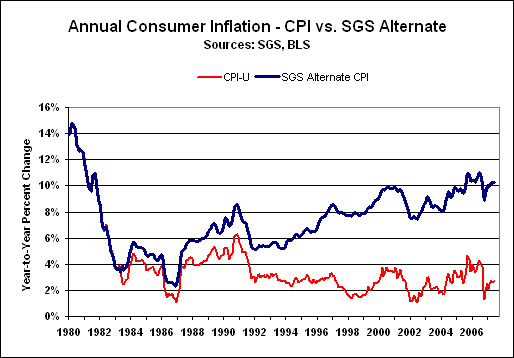
General background note: Historical data on both the official and SGS-Alternate CPI series are available for download on the Alternate Data page of www.shadowstats.com. The Alternate CPI numbers tend to show significantly higher inflation over time, generally reflecting the reversal of hedonic adjustments, geometric weighting and the use of a more traditional approach to measuring housing costs, measures all consistent with the reporting methodology in place as of 1980.
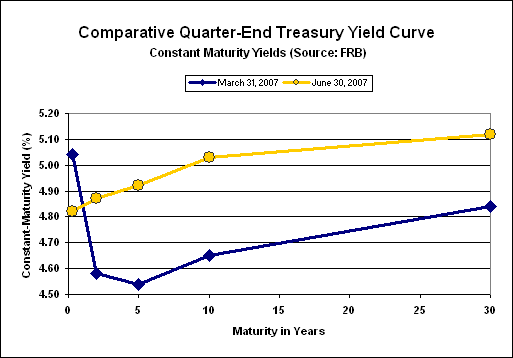
The general outlook for the financial markets remains unchanged: heavy sell-offs in U.S. equities as a major bear market unfolds, heavy selling in the U.S. dollar, rising domestic long-term interest rates (despite any short-term flight-to-quality issues), and spiking precious metals prices. The timing of these events remains uncertain, but recent activity suggests they are nearing rapidly. This is despite strong equity markets and a flat currency and gold markets in the second quarter, as detailed below. For the quarter, however, long-term interest rates did rise, pushing the yield curve to a more-normal positive slope.
              Quarterly Financial-Market Indicators at Quarter-End


                    Second-Quarter 2007         First-Quarter 2007
                    Level      Q/Q     Yr/Yr    Level      Q/Q     Yr/Yr
     Equity Market
     DJIA           13,408.62   8.53%  20.25%   12,354.35  -0.87%  11.21%
     S&P 500         1,503.35   5.81%  19.53%    1,420.86   0.18%   9.73%
     Wilshire 5000  15,210.65   5.56%  18.38%   14,409.27   1.06%   9.53%
     NASDAQ Comp     2,603.23   7.50%  19.85%    2,421.64   0.26%   3.50%


     Credit Market(1)
     3-Mo T-Bill        4.82%  -22 bp  -19 bp       5.04%    2 bp   41 bp
     2-Yr T-Note        4.87%   29 bp  -29 bp       4.58%  -24 bp  -24 bp
     5-Yr T-Note        4.92%   38 bp  -18 bp       4.54%  -16 bp  -28 bp
     10-Yr T-Note       5.03%   38 bp  -12 bp       4.65%   -6 bp  -21 bp
     30-Yr T-Bond       5.12%   28 bp   -7 bp       4.84%    3 bp   -6 bp


     Oil(2)
     US$ per Barrel
     West Texas Int.    69.57  12.21%  -5.96%       62.00   1.54%  -7.75%


     Currencies/Dollar Indices(3)
     US$/Unit
     Pound Sterling    2.0063   1.92%   8.50%      1.9685   0.51%  13.20%
     Euro              1.3520   1.22%   5.80%      1.3374   1.34%  10.17%
     Swiss Franc       0.8170  -0.93%   0.06%      0.8247   0.57%   7.14%
     Yen               0.0081  -4.72%  -7.20%      0.0085   1.24%  -0.07%
     Canadian Dollar   0.9404   8.43%   4.85%      0.8673   1.06%   1.21%
     Weighted Currency Units/US$
     Jan. 1985 = 100
     Financial (FWD)    50.03  -0.99%  -4.12%       50.53  -1.25%  -7.57%
     Trade (TWD)        56.60  -2.33%  -3.13%       57.95  -1.08%  -5.29%


     Precious Metals(4)
     US$ per Troy Ounce
     Gold              650.50  -1.70%   6.03%      661.75   4.71%  13.70%
     Silver             12.54  -6.07%  17.20%       13.35   3.49%  13.52%


     bp -- Basis point or 0.01%. (1) Constant maturity yield, Federal
     Reserve Board. (2) Department of Energy. (3) Shadow Government
     Statistics, Federal Reserve Board (See Dollar Index Section for
     definitions). (4) London afternoon fix, Kitco.com.
The U.S. dollar may have started to spiral slowly into the abyss, with the financial-weighted dollar easing by 2.3% as of July 20th, versus the end of June. At the same time, oil prices are pushing towards last year's record highs (up 8.9% since June 30th), and gold has rallied by 4.8%. At such time as dollar selling intensifies, any flight-to-quality relief in long-term rates will prove fleeting.
Add in a stymied Fed looking at a mounting inflationary recession, and the longer term outlook for U.S. stocks cannot be good, irrespective of ongoing market irrationality.
General background note: The U.S. economy remains in a severe, structural inflationary recession, saddled with an impotent Fed and a federal government that is fiscally bankrupt in all but name. In combination, these factors offer the worst of all environments to the financial markets. Ahead lie higher long-term interest rates and much lower U.S. equity prices. On the plus side is the outlook for gold, which provides a solid hedge against many of the problems that have started to surface. Key to the near-term movements of these markets remains the fate of the U.S. dollar.
U.S. Equities -- After rallying to a record 14,000, the Dow Jones Industrial average closed Friday at 13,851, up 3.3% from June 30th, slightly ahead of broad dollar weakness, but lagging the change in gold over the same time period.
At such time as the equity markets eventually catch up with the underlying economic and looming financial fundamentals, the downside adjustments to stock prices should be quite large, eventually rivaling the 90% decline in equities seen in the 1929 crash and ensuing several years. The decline might have to measured in real terms (net of inflation), as a hyperinflation eventually will kick in as the Fed moves to liquefy the system. Stocks do tend to follow inflation, since revenues and earnings get denominated in inflated dollars. Hence with a hyperinflation, a DJIA of 100,000 or 100,000,000 could be expected, but such still would be below today's levels adjusted for inflation.
General background note: The approaching financial maelstrom already has come over the horizon. When it hits, those investors who have taken shelter in cash, gold and outside the U.S. dollar will be the ones with the wealth and assets available to take advantage of the extraordinary investment opportunities that should follow.
U.S. Credit Market -- As discussed in recent months, little action can be expected from the Fed, until either a dollar panic or systemic liquidity issues force its hand. The Fed otherwise remains hamstrung, unable with its impaired monetary tools either to contain a commodity-driven inflation or to stimulate a structurally damaged economy. Unfortunately, signs of both risk cases -- dollar selling and possible systemic liquidity issues -- are starting to surface.
Rising inflation usually means upside pressure on long-term interest rates, and relative to short-term rates. The inflow of foreign liquidity to the markets had kept long-term rates flat and had inverted the yield curve (short-term yields higher than long-term yields) for some time. That changed in the last quarter, with longer term yields rising and the Treasury yield curve resuming a positive slope as shown in the accompanying graph.
As market nervousness gels over the unfolding economic and financial nightmare, there may some further flight-to-quality buying of U.S. Treasuries. That phenomenon will have a limited lifespan, as flight to quality/safety increasingly will take the form of assets held outside the United States and denominated in something other than the U.S. dollar.
U.S. Dollar -- Through June, the U.S. dollar gained against most of the major currencies, except against the Canadian dollar. U.S. dollar trading in July, however, has started to show meaningful weakness across the board with the major currencies.
Exacerbating the circumstance, perhaps, has been the move by Iran to have Japanese buyers pay for their oil purchases in yen, rather than dollars. Other oil suppliers increasingly will be under pressure to do something similar, just as a measure of financial self-preservation. Such movement not only would intensify dollar selling pressures, but also would magnify domestic U.S. oil-related inflation.
The fundamentals underlying the U.S. currency remain extraordinarily negative, as discussed below. While movement against the dollar has begun, heavy dollar selling has not hit, yet. The timing of the ultimate move against the dollar remains uncertain. The crisis still likely will come sooner (next several months), rather than later, with little or no warning.
The proximal trigger for a dollar panic likely will be a surprise and could come from a bad economic statistic, political missteps by the Administration or a central bank, negative trade or market developments in Asia, or a terrorist attack or even still-likely military action against Iran. When it hits, the broad selling pressure should be strong enough to overcome any short-lived central bank intervention.
General background note: In terms of underlying fundamentals that tend to drive currency trading, the dollar's portfolio could not be worse. Relative to major trading partners, the U.S. economy is much weaker, interest rates are lower, inflation is higher, fiscal and trade-balance conditions are abysmal, and relative political stability is at a nadir. The President's approval rating commonly has moved currency trading in the past, and it is at the lowest level seen in the post-World War II era. Relative political stability issues are compounded by the presence of a Congress hostile to the President. Generally, the greater the magnitude of the dollar selling, the greater will be the ultimate inflation pressure and liquidity squeeze in the U.S. capital markets.
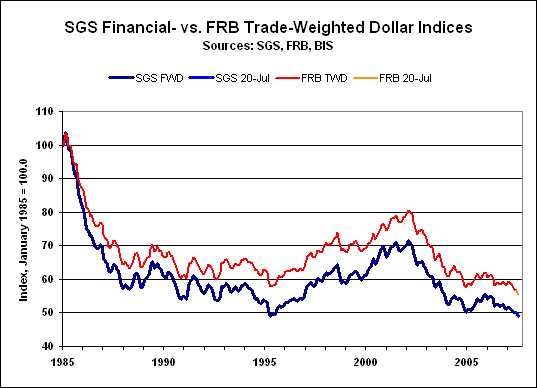
As shown in the following graph, U.S. dollar trading again was mixed in June, setting a new low on a trade-weighted basis. The added July 20th data point shows the downside movement of the indices so far in July.
General background note: Historical data on both dollar series are available for download on the Alternate Data page of www.shadowstats.com. See the July 2005 SGS for methodology.
U.S. Dollar Indices. The Shadow Government Statistics' Financial-Weighted U.S. Dollar Index (FWD) is based on dollar exchange rates weighted for respective global currency trading volumes. For June 2007, the monthly dollar average rose by 0.11%, after gaining 0.26% in May. The June 2007 average index level of 50.27 (base month of January 1985 = 100.00) was down 4.11% from June 2006, with May down 3.19% from the year before. The index's historic monthly-average low was 48.98 in April 1995. The July 20th level of the index had declined to 48.88.
Dropping to another all-time monthly-average low, June's level of the Federal Reserve's Major Currency Trade-Weighted U.S. Dollar Index (TWD) fell by 0.34%, following May's 0.84% drop. The June 2007 index level of 56.80 (base month of January 1985 = 100.00) was down 3.16% from the year before, against May's 2.78% annual decline. As of July 20th, the TWD stood at 55.42.
Once again, the variance of the gain in the FWD versus the decline in the TWD can be explained by the sharp monthly decline of the U.S. dollar against the Canadian dollar, where the latter receives a much heavier weighting in the TWD.
Gold -- As of Friday, gold was trading around $682 per troy ounce and silver around $13.30. For June, however, the monthly-average gold price (London afternoon fix per Kitco.com) averaged $665.49 per troy ounce against May's $666.86. Silver averaged $13.14 per troy ounce in June, down from $13.15 in May.
High gold price volatility continues but generally is trending higher. Despite central-bank manipulations and intervention, the upside potential for the precious metal remains explosive, particularly as heavy dollar selling begins. Look for new monthly and daily highs in the months ahead.
General background note: As discussed in the Hyperinflation Series (see the December 2006 to March 2007 SGSs), the eventual complete collapse of the U.S. dollar -- the world's reserve currency -- will force the creation of a new international currency system. Gold likely will be structured into any replacement system, in an effort by those organizing the new currency structure to gain public acceptance.
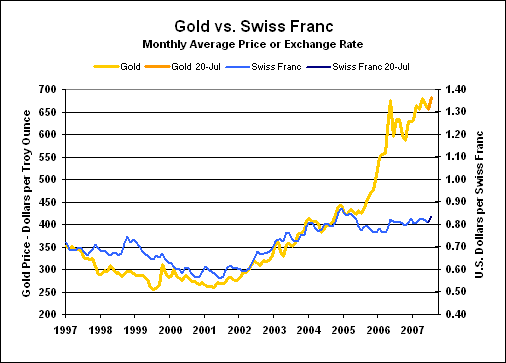
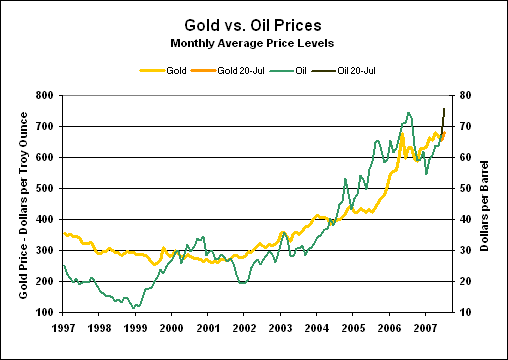
The updated gold versus oil and Swiss franc graphs show June averages as well as added points for closing prices on July 20th. As we go to press, gold is trading above $680, oil is over $75 and the Swiss franc is over $0.83. Look for all three measures to trade significantly higher in the months ahead.
The bulk of major economic reports continue coming in on the soft side of expectations, while inflation results generally have remained at the upper end of expectations. The occasional countertrend reports tend to lose their strength in later revisions, as discussed in the Opening Comments concerning housing starts.
Financial market sentiment increasingly has settled into the concept of a stagnant or recessionary economy beset by inflation problems. Even so, the full extent of the economy's plight is far from broad recognition. With the President's positive rating still bottom bouncing and setting new record lows, and with the Fed fearful of a market meltdown, recent and upcoming releases of major series have been, and likely will continue to be, subject to some massaging for both the perceived political needs of the Administration and the heavy financial market needs of an impotent Federal Reserve Board.
General background note: Against lagging and still largely distorted market expectations, most near-term economic reporting will tend to continue surprising the markets on the downside, while most inflation reporting should continue to surprise the markets on the upside.
Employment/Unemployment -- Seasonally-adjusted June payrolls were reported up by 132,000 (207,000 net of revisions), once again not much outside the 95% confidence interval of +/- 129,000, following a revised 190,000 (previously 157,000) gain in May. Annual growth for June was reported at 1.45%, down from 1.46% in May, which previously had been reported with year-to-year growth of 1.39%.
As discussed in the July 11th Flash Update, recent misreporting patterns resumed with massive prior-period revisions and unusual seasonal-adjustments distorting the June employment report. With the BLS re-jiggering its seasonal factors each month, the range of potentially gimmicked reporting is great. Nonetheless, year-to-year change in the seasonally-adjusted and unadjusted series should be the same, and based on June's unadjusted annual growth rate, the seasonally-adjusted jobs increase should have been 107,000 instead of 132,000.
Contributing to the overstatement of June's payroll figures, the monthly fudge or bias factor (birth/death model) created 156,000 jobs that were added to the unadjusted number for good measure. That number flows through to the seasonally-adjusted data with minimal variation. The bias factors never are adjusted for a recessionary environment, always assuming ongoing growth. For example, 25,000 construction jobs were added to employment last June, and 26,000 construction jobs were fudged into the count this June, despite the obvious deterioration in the 2007 construction environment.
Additionally, the reported 16,500 June jobs gain in the educational sector suggests that, as is the case more often than not, the BLS had problems properly seasonally adjusting for the effect of the end of the school year.
The household survey counts those who are employed, while the payroll survey counts the number of jobs. The household survey showed seasonally-adjusted June employment up by 197,000, with seasonally-adjusted U.3 unemployment increasing to 4.53% +/- 0.23% (95% confidence interval) in June, from 4.46% in May. Unadjusted U.3 rose to 4.7% in June from 4.3% in May. The broader, seasonally-adjusted U.6 unemployment rate held at 8.2% in June, but rose on an unadjusted basis to 8.5% from 7.9% in May. Net of the "discouraged workers" defined out of existence during the Clinton Administration, traditional unemployment continues to run around 12%.
The June employment gain was against a background of plunging help-wanted advertising, less economically-negative new claims for unemployment insurance and flat to weaker employment numbers in the June purchasing managers surveys (see respective sections). These background numbers remain consistent with continued weakness in official jobs and unemployment reporting.
Next Release (August 3): The July payroll survey should resume a pattern of falling back to the soft side of market expectations. Look for the unemployment rate to continue pushing higher, entering a period of fairly regular upturns.
Gross Domestic Product (GDP) -- The "final" estimate revision to annualized real (inflation-adjusted) growth for the first quarter of 2007 was little more than statistical noise taking the previously reported 0.6496% to 0.6873 +/- 3%, which still was statistically indistinguishable from a quarterly contraction. The first-quarter's minimal growth was down sharply from the fourth quarter's reported 2.45%. Measured year-to-year, annual GDP growth in the first quarter revised to 1.91% from 1.90%, and down from 3.13% in the fourth quarter. Despite being labeled a "final" estimate, the first-quarter's growth rate is subject to further revision in the annual revision due on July 27th.
Nominal growth actual notched higher, but that largely was offset by an upward revision to the first quarter's implicit price deflator, reflecting annualized inflation of 4.2%, versus prior reporting of 4.0%, and up from 1.7% in the fourth quarter.
A Michael Mandel June 18, 2007 Business Week article "The Real Cost of Offshoring" makes the case that the Bureau of Economic Analysis (BEA) understates import inflation, creating -- of all things -- "Phantom GDP." Normally, understated inflation boosts reported GDP, but since imports get subtracted from GDP, the effect is reversed in aggregate GDP reporting. This concept will be addressed in next month's Reporting/Market Focus that will assess the annual GDP revisions and review the SGS-Alternate GDP.
General background note: Although the GDP report is the government's broadest estimate of U.S. economic activity, it is also the least meaningful and most heavily massaged of all major government economic series. Published by the BEA, it primarily has become a tool for economic propaganda. Adjusting for methodological distortions built into GDP reporting over time, the SGS-Alternate GDP measure suggests economic reality is much weaker than officially reported. Alternate year-to-year annual contractions continue, with an annual 2.2% contraction in the first quarter deepening from the 1.5% decline in the fourth quarter (see the graph in the Alternate Reality section in the Opening Comments).
As to revised official estimates for real, annualized, quarterly first-quarter growth in gross national product (GNP) and gross domestic income (GDI), first-quarter real GNP -- GDP net of the international flows in factor income (interest and dividend payments) -- was revised upward to show an annualized quarterly rate of 0.76% versus initial reporting 0.40%, and down from 3.49% in the fourth quarter.
First-quarter real GDI -- the supposedly equivalent income side of GDP -- contracted at a revised annualized rate of 0.28% versus the initially reported contraction of 0.32%, following the fourth quarter's 4.47% gain.
Next Release (July 27): It would be surprising if the "advance" estimate of annualized quarterly real GDP growth for the second quarter were not substantially weaker than consensus forecasts currently touted at about 3.4%, but this indeed is the most heavily politicized and massaged of all the major series, and the times are very difficult politically.
Nonetheless, the annual revisions to GDP will restate historical economic growth from first-quarter 2004 to date, and those restatements should result in lowered growth rates for the last two years or so. Underlying series ranging from retail sales and housing to industrial production have already led the way. Somehow, those changes likely will avoid showing any quarterly contractions in real GDP, irrespective of quarterly contractions shown in series such as industrial production.
Consumer Price Index (CPI) -- The BLS reported the seasonally-adjusted June CPI-U (I.6) up by 0.19% (0.19% unadjusted) +/- 0.12% (95% confidence interval) for the month, following May's increase of 0.67% (0.61% unadjusted) and April's gain of 0.42% (0.65% unadjusted). Annual inflation held at 2.69% in June and May, up from 2.57% in April. Annualized year-to-date inflation through June was 5.00% adjusted, 6.60% unadjusted.
Annual inflation for the Chain Weighted CPI-U (C-CPI-U) (I.5) -- the substitution-based series that increasingly gets touted by the manipulators as the replacement for the CPI-U -- was 2.32% in June, versus 2.33% in May and against 2.35% in April.
Adjusted to pre-Clinton (1990) methodology (I.7), annual CPI growth was about 6.1% in June and May, up from 5.9% in April, while the SGS-Alternate Consumer Inflation Measure (I.8), which reverses gimmicked changes to official CPI reporting methodologies back to 1980, held at roughly 10.3% in June and May, versus 10.2% in April. The eight levels of annual inflation, I.1 to I.8, are shown in the table in the Alternate Reality section, along with the graph of SGS-Alternate Consumer Inflation.
Next Release (August 15): Annual inflation generally will continue rising into at least the fourth quarter of 2007. Seasonally-adjusted, monthly CPI-U increased by 0.39% in July 2006. Any monthly reporting above or below that for the pending release of July 2007 CPI will add or subtract directly to or from the current annual CPI-U inflation rate. Reporting risks favor an upside surprise to modest market expectations. A renewed upside movement in core inflation also has become long overdue.
Federal Deficit -- General background note: The federal government's fiscal 2006 (fiscal year-end September 30th) deficit, prepared based on generally accepted accounting principles (GAAP), widened to $4.6 trillion from 2005's $3.5 trillion. Those numbers dwarfed the officially-gimmicked 2006 federal budget deficit of $248.2 billion, which was down $70.8 billion from 2005's $318.5 billion (see the December SGS).
General background note: Although it lacks the accrual accounting of the GAAP numbers, the change in gross federal debt bypasses several of the reporting manipulations and is a better indicator of actual net cash outlays by the federal government than is the official, gimmicked deficit reporting. As of fiscal year-end 2006, the gross federal debt stood at $8.507 trillion, up $574 billion from 2005, which in turn was up $554 billion from 2004.
For the rolling 12 months through June 2007, the gimmicked deficit was $162.7 billion versus $275.5 billion in June 2006, compared with the rolling deficits of $169.7 billion in May 2007 and $273.1 billion in May 2006. For the rolling 12 months through April 2007, the gimmicked deficit was $144.9 billion versus $265.7 billion in April 2006. The gap in the year-to-year rolling deficits has started to narrow.
For June 30, 2007, the gross federal debt stood at $8.868 trillion, up $39 billion from May and up $448 billion from June 2006, which in turn was up $584 billion from June 2005. For May 31, 2007, the gross federal debt stood at $8.829 trillion, up $472 billion from May 2006, which in turn was up $579 billion from May 2005.
General background note: The Administration and Congress continue playing bookkeeping games. Even so, the gimmicked deficit should widen in the next 12 months, as government finances begin to suffer from tax revenue losses due to the intensifying recession and relative tax receipt declines after the expiration of recent tax incentives. While GDP growth estimates can be gimmicked, incoming tax receipts (based on consistently applied tax policies) remain an independent estimate of underlying economic reality and eventually will reflect the economy's mounting difficulties.
Initial Claims for Unemployment Insurance -- Annual growth in initial claims has continued to soften (an economic positive) but has remained marginally in positive territory (an economic negative). On a smoothed basis for the 17 weeks ended July 14th, annual growth was 0.1%, down from 2.7% for the 17 weeks ended May 26th.
General background note: More often than not, week-to-week volatility of the seasonally-adjusted weekly claims numbers is due to the Labor Department's efforts to seasonally adjust these numbers around holiday periods, such as Easter, Memorial Day, July 4th and Labor Day. The Labor Department has demonstrated an inability to do such adjusting successfully. When the new claims series is viewed in terms of the year-to-year change in the 17-week (four-month) moving average, however, such generally is a fair indicator of current economic activity.
Real Average Weekly Earnings -- June's seasonally-adjusted monthly real earnings rose by 0.5%, after declining by 0.4% in May and by 0.5% in April. Annual growth notched higher to 1.3% in June, from 1.2% in May and 0.9% in April.
General background note: Gyrations in the poor quality of reported CPI growth account for most month-to-month volatility in this series. Adjusting for the major upside biases built into the CPI-W inflation measure used in deflating the average weekly earnings, annual change in this series shows the average worker to be under severe financial stress in an ongoing recession.
Retail Sales -- June's seasonally-adjusted retail sales declined by 0.89% (down 1.04% net of revisions) +/- 0.9% (95% confidence interval), largely reversing the 1.52% gain (previously 1.40%) reported in May, and following a 0.32% decline in April. With monthly CPI up by 0.19%, seasonally-adjusted monthly retail sales were down by roughly 1.08% after inflation. Increasingly, retail sales are reflecting relative strength due to rising prices, and the real retail sales number will become more important in assessing the strength of consumer spending.
On a year-to-year basis, June retail sales were up 3.77% before inflation and just 1.08% after inflation, compared with respective annual growth numbers for May of 4.98% and 2.29%.
General background note: Real (inflation-adjusted) year-to-year growth in retail sales below 1.8% (using the official CPI-U for deflation) signals recession, and a signal first was generated in this business cycle back in June 2006.
Next Release (August 13): July retail sales, once again, should come in below market expectations, and below the rate of inflation on both a monthly and possibly a year-to-year basis.
Industrial Production -- Seasonally-adjusted industrial production rose by 0.5% (0.6% net of revisions) in June, following May's revised 0.1% decline (previously unchanged), and April's 0.4% increase. Despite the intermittent monthly gains, annual growth continues to slow to recessionary levels. Annual April growth of 1.76% (previously 1.88%) slowed to 1.74% In May and to 1.37% in June.
Next Release (August 15): Look for July industrial production to move once again towards a pattern of contraction. Eventually, monthly contractions in this series should become regular, with rapidly slowing annual growth turning negative.
New Orders for Durable Goods -- For May, the usually volatile durable goods orders fell by 2.8% (down 2.2% net of revisions) on a seasonally-adjusted basis, after a revised 1.1% gain (previously 0.6%) in April. May's annual change was up by only 0.3%, clearly a contraction after inflation, following April's revised 5.2% gain (previously 4.7%). On a three-month moving-average annual basis, the annual change was 0.5%, following a 0.2% increase in April. Again these growth rates are negative net of inflation and continue to be suggestive of less-than-robust economic activity.
The closely followed nondefense capital goods new orders tumbled by 8.3% in May, for the month, following April's revised 0.1% (previously 0.8%) decline. May's annual growth rate for nondefense capital goods was 1.4%, which also was below the rate of inflation.
General background note: Durable goods orders lost its status as a solid leading economic indicator when the semi-conductor industry stopped reporting new orders in 2002.
Trade Balance -- The seasonally-adjusted monthly trade deficit for May 2007 was reported at $60.0 billion, up from a revised $58.7 billion (previously $58.5 billion) in April, but down from $62.4 billion in March. The May detail showed some increase in oil imports, based both on higher prices and higher physical volume, but the current trade shortfall remains well shy of reality.
Next Release (August 14): Odds continue to favor continued deterioration in the monthly trade deficit, recovering further from recent understatement. Reporting risk generally remains on the negative side of consensus forecasts, and a sharp June deterioration would suggest a downside revision to the upcoming second-quarter advance GDP estimate to be published on August 27th. The months ahead should see a pattern of regularly increasing deficits that shortly, again, will be setting new records.
Consumer Confidence -- June confidence measures declined both on a monthly basis, with annual growth dropping or slowing. The Conference Board's June Consumer Confidence fell by 4.2% month-to-month, following May's revised 2.1% (previously 1.6%) increase. June's annual change was a 1.4% decline (down 0.38% on a three-month moving-average basis), following May's 3.6% gain (0.3% on a three-month moving-average basis).
For June, the University of Michigan's Consumer Sentiment fell by 3.4% for the month, versus May's 1.4% increase. June's year-to-year change slowed to 0.5% (3.7% on a three-month moving-average basis) from May's 11.6% (3.3% on a three-month moving-average basis).
The drop in these lagging, not leading, indicators tends to reflect the tone of the popular financial media and suggests the economy has continued to falter.
General background note: The Conference Board measure is seasonally adjusted, which can provide occasional, but significant distortion. The adjustment does not make much sense and is of suspect purpose, given that the Conference Board does not release the unadjusted number. The Michigan survey is unadjusted. How does one seasonally-adjust peoples' attitudes? Also, beware the mid-month Consumer Sentiment release from the University of Michigan. Its sampling base is so small as to be virtually valueless in terms of statistical significance.
Short-Term Credit Measures -- Patterns of annual growth in consumer and commercial borrowing remain mixed, with consumer credit growth slowing in contrast to generally stronger commercial borrowing.
Annual growth slowed for seasonally-adjusted consumer credit, which includes credit cards and auto loans, but not mortgages. Year-to-year growth of 4.7% in May was down from 4.8% in April and 5.1% in March. In the current environment, where inflation-adjusted growth in income is not adequate to support meaningful growth in the personal consumption component of GDP, GDP growth only can come from temporary debt expansion or savings liquidation. Accordingly, slowing consumer debt expansion places a constraint on economic growth.
Commercial borrowing growth, however, continued to be strong on a year-to-year basis, with annual growth in commercial paper outstanding jumping to 21.0% in June from 19.6% in May. Annual growth in commercial and industrial loans was 12.3% in June, up from 11.6% in May and 12.2% in April. Solid growth in the commercial credit measures can signal credit needs tied either to rising sales and receivables/inventory, or to slowing sales and slowing collections and involuntarily rising inventories.
Producer Price Index (PPI) -- Stretching credibility more than usual, the June finished goods PPI fell by a seasonally-adjusted 0.2% (down 0.4% unadjusted), against a May gain of 0.9% (1.2% unadjusted) and an April of 0.7% (1.0% unadjusted). Annual PPI in June eased back to 3.3% from 4.4% in May. Seasonally-adjusted intermediate and crude goods rose 0.5% and 0.3% in June, after being up by 1.1% and 2.0% in May.
What particularly seems to be running counter to overwhelming anecdotal evidence is the reported 0.8% decline in food prices. As an aside, we have had communication from a person formerly involved in the PPI's preparation, who advises of directions received and pressures applied to not report or to moderate the reporting of large price increases that would show up in certain politically sensitive commodities.
Next Release (August 14): Despite the regular random volatility of the monthly price variations, PPI inflation reporting over the next six-to-nine months generally should come in above market expectations. As with the CPI, the core PPI inflation rate is long overdue for an upside surprise.
General background note: The following numbers are generally good-quality leading indicators of economic activity and inflation that offer an alternative to the politically-hyped numbers when the economy really is not so perfect. In some instances, using a three-month moving average improves the quality of the economic signal and is so noted in the text.
Economic Indicators
Purchasing Managers Survey: Manufacturing New Orders -- The overall June ISM manufacturing index again gained minimally, rising to 56.0 from May's 55.0 and February's 54.7. At work here appears possibly to be a dead-cat bounce in the manufacturing sector activity, although there may still be poor-quality seasonal factors (supplied by the Commerce Department) at work. The June employment index, however, fell again, to 51.1, from May's 51.9 and April's reading of 53.1. Renewed decline in the broad series is a good bet in the next several months, based on declining annual activity and growth in durable goods orders orders, retail sales, housing and industrial production.
The June new orders index rose to 60.3, from May's 59.6. Seasonal-factor distortions usually are overcome by viewing the series using year-to-year change on a three-month moving average basis. On that basis, the June new orders index was up by 5.1%, versus a decline of 0.6% in May.
General background note: Published by the Institute for Supply Management (ISM), the new orders component of the purchasing managers survey is a particularly valuable indicator of economic activity. The index is a diffusion index, where a reading below 50.0 indicates contracting new orders. The index gradually has notched lower from its peak annual growth of 42.6% in April of 2004. As an SGS early warning indicator of a major economic shift, the new orders measure breached its fail-safe point in mid-2005, generating a signal of pending recession.
Service Sector Index. The service-sector ISM index does not have much meaning related to overall business activity, since new order activity at law firms, hospitals or fast-food restaurants has little obvious relationship to broad economic activity. That said, the overall June services sector index rose minimally to 60.7, from 59.7 in May. Both the services employment and prices paid components, however, have some meaning. The June employment component was marginally higher at 55.0 versus 54.9 in May. The prices paid component is covered in the Inflation Indicators.
Help-Wanted Advertising Index (HWA) -- The Conference Board reported that help-wanted advertising plunged to 27 in May, down from 29 in April, setting a new 50-year low. Even allowing for the advertising volume lost to the Internet in recent years, the current weakness is enough to signal a deepening problem in the employment sector. The May number was down 18.2% from the year before, compared with a 14.7% drop in April.
Viewed on a three-month moving-average basis, May's year-to-year change was a contraction of 18.3%, versus April's 19.1%. The series still indicates rapidly deteriorating employment conditions. Where the index never recovered from the 2000/2001 recession, its ongoing renewed plunge has signaled a new and rapid contraction in economic activity. Continued deterioration remains likely in the months ahead.
Housing Starts -- As discussed in this month's Opening Comments, ongoing weakness in the housing starts remains in place, with graphs highlighting recent monthly reporting revisions and showing the year-to-year change in the series (last newsletter's graph showed annual change on a three-month moving-average basis).
June seasonally-adjusted housing starts rose by 2.3% +/- 10% (95% confidence interval) for the month, after revised 3.4% and 0.4% monthly declines in May and April. Year-to-year, June starts were down 19.4% (+/- 7.1%), versus a drop of 26.2% in May, and were down 21.5% on a three-month moving average basis.
Confirming ongoing weakness in the housing sector, June building permits were down 7.5% +/- 1.2% for the month and 25.2% +/- 1.2% year-to-year. In May reporting, new home sales were down 15.8% +/- 11% (95% confidence interval) year-to-year, while May existing home sales were down 10.3% at an annual rate.
Money Supply -- As discussed in the Opening Comments, the Fed has been redefining and revising some its commercial bank asset series, making mistakes in the process. The effect, subject to further revisions in Federal Reserve reporting, has been to slow the pace of recently reported M2 annual growth (May revised from 6.7% to 6.3%). On a parallel but lesser basis, the SGS Ongoing M3 estimates of annual growth were revised (May revised from 13.3% to 13.1%). The changes in annual M3 growth rates, however, are not meaningful and do not alter the picture of roughly 13% June annual growth in the Fed's no-longer-reported broad money measure, contrasted with the reported 6.1% annual M2 growth for June.
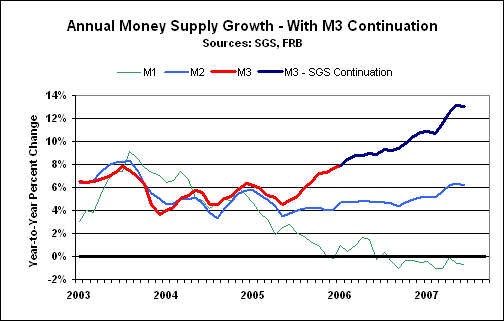
General background note: Historical annual growth data for the money supply series, including the SGS Ongoing M3 estimates, are available for download on the Alternate Data page of www.shadowstats.com. See the August 2006 SGS for methodology. The indicated M3 levels below are our best estimate and are provided at specific subscriber request. Keep in mind that regular revisions in the related Fed series affect historical M3. Usually, annual growth rates hold, although levels may shift a little. We have not attempted, nor do we plan to recreate a revised historical series for an M3 monthly-average level going back in time. The purpose of the SGS series was and is to provide monthly estimates of ongoing annual M3 growth. We are comfortable with those numbers and that our estimated monthly growth rates are reasonably close to what the Fed would be reporting, if it still reported M3. With those caveats on the table, here are the monthly-average levels for M3:
      Shadow Government Statistics Ongoing M3
  (Estimated seasonally-adjusted monthly average)


              Current     Yr Before
   Month      $ Tril      $ Tril     % Yr/Yr


   Mar 07     11.541 (r)  10.347 (r) 11.6%
   Apr        11.723 (r)  10.417 (r) 12.5%
   May        11.865 (r)  10.490 (r) 13.1%
   Jun        11.919 (p)  10.547 (r) 13.0%


  (p) June's preliminary estimate is based on full-month
  reporting, reflecting Fed revisions and redefinitions
  of the last month and corrections to same. (r) Revised.
  There would be prior period-revisions before March 2006,
  but there also would be no significant change in annual
  growth rates, which have been left intact from earlier
  calculations for the months before March 2007.


  NOTE OF CAUTION: The estimates of monthly levels best are
  used for comparisons with other dollar amounts, such as
  nominal GDP. While the estimates are based on seasonally-
  adjusted Federal Reserve data, great significance cannot
  be read into the month-to-month changes, as was the case
  when the Fed published the series. The most meaningful way
  to view the data is in terms of year-to-year change.
Based on the revised and full-month June data, annual growth in June for monthly M1 fell by 0.7%, versus a 0.6% contraction in May, while June M2 annual growth was 6.1%, down from 6.3% in May.
Inflation Indicators
Purchasing Managers Surveys: Prices Paid Indices -- The June prices paid indices were slightly softer, not yet reflecting the recent surge in oil prices. The levels, however, remain high and in inflation territory, suggestive of ongoing inflation issues in both purchasing managers surveys.
On the manufacturing side, the June price index eased to 68.0 from May's 71.0. On a three-month moving average basis, June's annual change was down by 5.8%, after May's 2.6% decline. The manufacturing price indicator is not seasonally adjusted and, therefore, is a generally better indicator of pricing activity. Keep in mind that the oil market was particularly strong at this time last year.
On the non-manufacturing side, the seasonally-adjusted June prices diffusion index softened to 65.5 from May's 66.4. On a three-month moving-average basis June's annual change was a decline of 9.2%, following May's 4.4% drop.
General background note: Published by the Institute for Supply Management (ISM), the prices paid components of the purchasing managers surveys are reliable leading indicators of inflationary pressure. The measures are diffusion indices, where a reading above 50.0 indicates rising prices.
Oil Prices -- As of July 20th, oil was trading over $75 per barrel, pushing the record high of $77.03 seen just about a year ago, on July 14, 2006. The current oil price contrasts with $69.57 at the end of June.
For the month of June, the monthly-average West Texas Intermediate spot price (Department of Energy) rose 6.3% to $67.48 per barrel from $63.46 in May. Against last year's particularly high oil prices, June's year-to-year decline in average monthly price was 4.9%, narrowed from May's 10.5% price drop. Price movement remains highly volatile, but generally is trending higher.
Meaningful upside risks to oil prices remain in play, both from the hurricane season and ever-mounting Middle Eastern political tensions. Forecasts for a particularly active hurricane season have not panned out, yet, but the season peak still is ahead, while oil and gasoline prices started the season at levels already at or above those seen post-Katrina.
General background note: Global political conditions continue to favor a further sharp spike in oil prices in the months ahead, irrespective of any ongoing games-playing by the Administration and OPEC. Overhanging the market remains the potential for a change in the dollar-based pricing of oil, particularly as dollar selling intensifies. Where dollar weakness is the equivalent of an oil price cut for oil purchasers denominated in an appreciating currency, market forces tend to push dollar-based oil prices higher, and that exacerbates inflation problems in the United States. Even worse, if oil pricing were shifted to something other than the U.S. currency, as appears to be happening between Iran and Japan (see U.S. Dollar section), U.S. inflationary pressures would be even more intense, since any drop in the dollar would be reflected directly as an increase in the price of foreign oil for U.S. consumption.
General background note: Whether from supply and demand, geo-political or currency pressures, oil prices will remain at highly inflationary levels and will continue as a major contributing factor to U.S. inflation woes. Historically high oil prices still are working their way through all levels of U.S. economic activity, ranging from transportation and energy costs, to material costs in the plastics, pharmaceutical, fertilizer, chemical industries, etc. These broad inflationary pressures will remain intact despite any near-term oil price volatility. Although these pressures may be slow to surface in government reporting of the so-called "core" inflation measures, they will surface.
The problem using statistical models to simulate or forecast economic activity, or to simulate or predict default risks, is tied largely to simplifying assumptions that have to be made, and to inaccurate numbers that get plugged into the models. When the limiting factors are not fully appreciated, the results of that modeling can have such a limited relationship to the real world as to be not only useless, but also financially dangerous to those relying on them.
Consider econometric forecasting. Some decades back, the Wharton School developed a wonderful model that simulated the U.S. economy, with something like 30,000 equations that had to be solved simultaneously. The model's value was in answering "What if?" types of questions. For example, if taxes were raised, what would that do to the economy next year? While the model could provide an indication of net impact, it could not predict the level of economic activity with any accuracy.
Nonetheless, this new tool soon was called into service as a forecasting model -- which it was not -- going well beyond the "What if?" If one wanted to forecast interest rate levels a year out, one first had to forecast what inflation would be the next year. If the inflation assumption were off, so also would be the interest rate forecast. To the extent the model was accurate, its forecasts could only be as good as the underlying assumptions made by the forecaster. Further, if the forecaster knew what the next year's inflation rate was going to be, he or she really did not need the model to figure out what would happen to interest rates.
The lack of forecast accuracy, however, did not dissuade the U.S. Government, the Federal Reserve and Corporate America from adopting such models for economic and business forecasting. The use of similar modeling today is so widespread that it partially explains the closeness of some consensus forecasts (often wrong) that come out of U.S. industry.
There have been ways of forecasting key data with reasonable accuracy, using single-equation formulas to predict a certain factor, where the formulas used leading indicators with enough lead-team to avoid having to rely on underlying assumptions. The growing problem with such models, however, has been the rapid deterioration in recent years of the quality of government statistics that would be used in such modeling.
Then there are simplifying assumptions. Financial models that do not allow for or otherwise assume away the possibilities of a major economic downturn, massive sell-offs in equities and the U.S. dollar, or significant spikes in long-term interest rates, have potential vulnerability to downside surprises, at such time as the economic and financial environments eventually unfold in a not so happy manner.
GDP growth of recent years should be revised to the downside in this year's annual revision, based on already published benchmark revisions to key underlying series covering economic segments such as retail sales, industrial production and housing. The new data -- due for release on Friday, July 27th -- will be assessed, including within the context of the SGS Alternate GDP. Summary numbers and an initial assessment will be published in an Alert over the weekend following the data release.
The extreme variance in the current distribution of U.S. income and wealth has received considerable press, recently. The government's annual estimate of this long-range indicator of economic and financial activity is due for late August release in conjunction with the annual Poverty Report. The latest data and implications of same will be examined. Last year's report showed income distribution at its most extreme since before the 1929 stock market crash and the Great Depression. It is not likely that the situation has improved.
PLEASE NOTE: This month's double-issue catches up the newsletter date with the calendar, and affected subscriptions have been extended one month to adjust for same. The Hyperinflation Summary Report still is pending and will follow shortly.
The August "Shadow Government Statistics" newsletter is targeted for the week of August 13th, due to vacation in the prior week. The September newsletter will be targeted for the week of September 10th. There will be at least two intervening Flash Updates between each newsletter. Postings on the Web site of monthly newsletters, interim Flash Updates and Alerts are advised immediately by e-mail.
OCCASIONALLY, BRIEF UPDATES ARE COMMUNICATED DIRECTLY BY E-MAIL. IF YOU ARE NOT RECEIVING E-MAIL COMMUNICATIONS FROM US, PLEASE LET US KNOW at johnwilliams@shadowstats.com or by using the Feedback option on www.shadowstats.com.