Flash Update
JOHN WILLIAMS’ SHADOW GOVERNMENT STATISTICS
FLASH UPDATE
July 28, 2009
__________
Depression Data Distortions Fuel Recovery Mania
Statistically Insignificant Monthly Changes amidst Severe Bottom Bouncing
Foreclosures Warp New and Existing Home Sales
Shy of a Political Fix, Second-Quarter GDP Consensus Is Too Optimistic
__________
PLEASE NOTE: The next posting should be a Flash Update following Friday morning’s (July 31st) release of "advance" second-quarter GDP and the GDP grand benchmark revisions. A special report on the restated GDP will follow within a day or so of the published revisions. Any interim Flash Update or Alert would be published as dictated by developing economic or financial-market circumstances.
– Best wishes to all, John Williams
The Depression Continues to Unfold, Including Housing. In line with the discussion in the "Depression-Induced Economic Reporting Distortions" of the Opening Comments section of last week’s newsletter, the recent reports of surging home sales are little more than Wall Street, Administration and media hype, overplaying results of limited-quality series plateauing at historic lows.
Consider the "recovery mania" surrounding new houses sold in June, for example (see also hyped expectations below on second-quarter GDP in the Week Ahead section). First, in this highly volatile series, the monthly gain of 11.0% was not statistically meaningful, +/- 13.6% (90% confidence interval as published in the Census Bureau release) or with the 95% confidence interval as usually cited by SGS of +/- 16.1%.
Despite all the hoopla of the monthly home sales growth being the strongest in nearly nine years, the Census Bureau’s release noted that the "90% confidence interval includes zero. The Census Bureau does not have sufficient statistical evidence to conclude that the actual change is different from zero."
Second, at work here is a case of severe bottom bouncing. In 2004 and 2005, average new home sales were over 1.2 million per year. The annual rate for the last eight months has averaged 70% less, 356,000 +/- 30,000; that is also the three-month moving average for June (the moving average helps to smooth the volatile monthly numbers). June was 384,000 on a standalone basis. The accompanying graph shows the monthly level of new house sold since 2004.
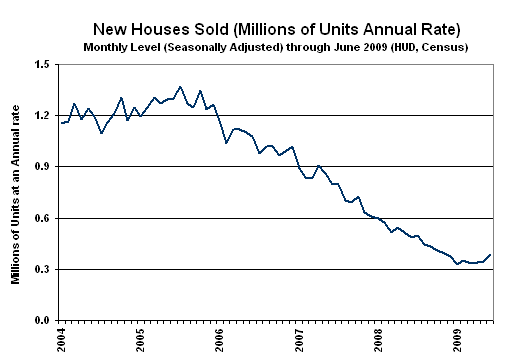
The month-to-month June gain of 11.0% (12.3% net of revisions) followed a revised 2.4% gain (previously a -0.6% contraction) in May. Year-to-year contraction narrowed to 21.3% from a revised 32.0% (was 32.8%) decline in May. Third, reflecting depression-induced distortions, annual contraction was so severe a year ago, that current year-to-year contractions reflect only a plateauing of housing activity at historic lows, not an upturn or turnaround in economic activity.
Fourth, the numbers reported for new houses sold have been disrupted by foreclosure activity.
Foreclosures Warp Reporting of New and Existing Home Sales. As shown in the second graph, the fall-off in existing home sales also is plateauing (has been for over a year). In 2005, existing home sales averaged 7.1 million. In the last eight months, sales have averaged 34% less at 4.7 million +/- 200,000. July sales were reported up by 3.6% month-to-month, down 0.2% year-to-year (again reflecting plateauing).
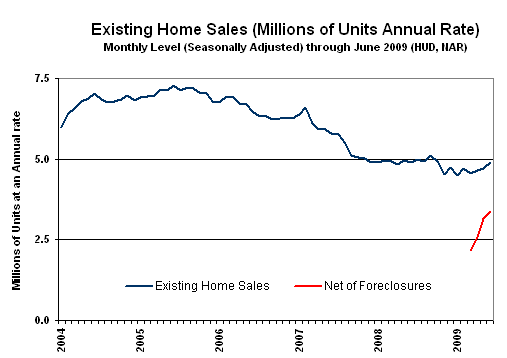
The reporting entity here, the National Association of Realtors (NAR), however, also has attempted recently to estimate the portion of sales forced by foreclosure activity. With foreclosures running between 30% and somewhat over 50% of total activity in recent months, the monthly and annual changes in existing home sales are particularly difficult to assess in terms of economic activity, as sales likely would have been less without the foreclosures. The short red line on the existing home sales graph reflects the imputed homes sales based on the NAR estimates, but I would hesitate to draw any more of a conclusion from the numbers than existing home sales, net of foreclosures, would be in the annualized two-to-three million range.
Separately, the Census Bureau acknowledges that there also is a portion of new home sales that reflects foreclosures, but the impact of same is not surveyed and likely is relatively smaller than the impact on new home sales.
In summary, given the patterns of ongoing low activity, year-to-year distortions, and the warping influence of foreclosures, there is little in the housing numbers, at present, that can be used to anchor claims of rebounding economic activity.
Consumer Confidence Remains Deep in RecessionTerritory. Consumer confidence continues to be swayed easily by the tone of the popular media towards the state of economy and the financial markets, so the July monthly declines are not good news for the recovery mania. While year-to-year change has turned more positive/less negative, such is due only to the extreme lows seen last year. The monthly levels remain deep in traditional recession territory.
This morning’s (July 28th) Conference Board July 2009 Consumer Confidence measure fell by 10.2% on top of an unrevised 10.0% decline in June. Year-to-year change for the three-month moving average was a decline of 6.4% versus a drop of 15.7% in June.
The Reuters/University of Michigan’s Consumer Sentiment measure fell by 6.8% in July, following a 3.1% increase in June. Year-to-year change in the Sentiment three-month moving average was up by 15.8% in July, versus a 14.3% gain in June.
As noted in last week’s newsletter, annual comparisons here still are against extremely weak readings the year before, tied to soaring gasoline prices. As renewed economic and inflation concerns get aired before the public, and as the stock market’s luster fades anew, the confidence numbers are likely to tumble even more sharply, again, in the months ahead.
Week Ahead: New Orders for Durable Goods. Due for release on tomorrow (Wednesday, July 29th), the highly volatile new orders for durable goods series should show a continued sharp fall-off, irrespective of the direction of the month-to-month change.
Gross Domestic Product. As discussed in the GDP (Reporting Perspective) section of last week’s newsletter, a grand-scale benchmark revision to the national income accounts (which include the GDP) will accompany the release of the "advance" estimate of second-quarter GDP growth on Friday (July 31st). While economic history for the last couple of years should be rewritten to show a longer and deeper GDP downturn than previously reported, the media and the markets likely will concentrate on the headline second-quarter number, which is expected to show an annualized quarterly real (inflation-adjusted) contraction of 1.5% (per Briefing.com), much narrowed from the first quarter’s 5.5% decline.
Key underlying economic series suggest some narrowing of the annualized contraction rate, but not by that magnitude. Since a 1.5% contraction is well within the statistical margin of error of reporting of the series, some even are suggesting a positive quarter-to-quarter change. A 1.5% quarterly contraction, let alone positive growth, would have to be a political fabrication, which has happened before.
Quarterly contractions in payrolls and real retail sales were of roughly the same magnitude in the second quarter as in the first quarter, and while second-quarter contraction rates narrowed for industrial production and housing starts. Those declines would support a much deeper quarterly contraction than the consensus estimate. Nonetheless, the consensus estimate will be targeted by the Bureau of Economic Analysis for its "advance" guesstimate.
If there were no prior period revisions to account for (they should be major), and the second quarter showed an annualized 1.5% quarterly contraction rate, the year-to-year real contraction in the second-quarter would hit a post-World War II record low of 3.5%, making the current downturn not only the longest, but also the deepest recession since the Great Depression. As special report will follow Friday’s Flash Update, as soon as is practicable.
______