Flash Update
FLASH UPDATE
October 2, 2009
__________
BLS Revision Nightmare: March 2009 Payrolls Overstated by 824,000
Birth-Death Model Falsely Boosted Jobs Reporting in Recession Environment
Monthly Jobs Loss of 263,000 (Payroll Survey) versus
Monthly Employment Decline of 710,000 (Household Survey)
September Unemployment Rates:
U.3 = 9.8%, U.6 = 17.0%, SGS = 21.4%
__________
PLEASE NOTE: The next planned Flash Update is for Friday, October 9th, following release of the August trade deficit.
– Best wishes to all, John Williams
Employment/Unemployment Overview Remains Bleak. The U.S. economy continued in an ongoing recession, which has been deeper than previously estimated, per today’s Bureau of Labor Statistics (BLS) reporting of its labor-related coincident indicators of economic activity for September. Further, the limited value of headline monthly payroll reporting as a short-term indicator of underlying economic conditions was confirmed in several areas. The preliminary estimate of a pending massive downward annual benchmark revision was announced for the payroll series; the discrepancies between the payroll and what I consider the statistically-sounder (the BLS disagrees on this point) household series have pushed to an extreme; and unusual revision patterns to recent months were increasingly evident, clouding the substance of the current monthly payroll report.
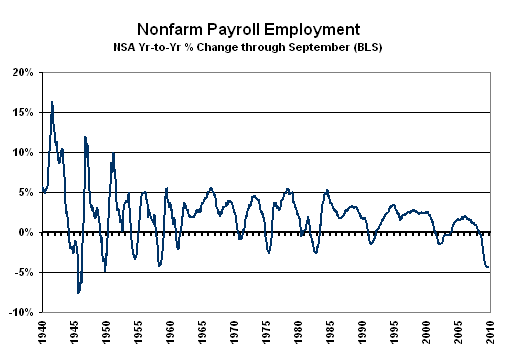
Benchmark Revision and Overly Optimistic Payroll Reporting. The BLS announced a preliminary estimate of its annual benchmark revision, due on February 5, 2010, indicating that the not-seasonally-adjusted March 2009 employment level would be reduced by 824,000. Such was based on benchmarking the payroll data against state unemployment tax records in March. As this revision pattern gets redistributed across time by the BLS in its benchmarking, current-period reporting could be revised lower by as much as 2,000,000 jobs. The full revisions also should show that the annual percentage decline in nonfarm payrolls already has been the worst of the post-World War II era.
While still shy of reality, the preliminary March 2009 benchmark number largely is confirms the underreporting of jobs losses in the last two years, as indicated by the concurrent seasonal factor bias (CSFB) discussed below. It also serves as a broad confirmation that the assumptions underlying the birth-death model (the old monthly bias factor) are not valid in times of a severe economic downturn. The birth-death model currently adds a net gain of about 900,000 jobs per year to payroll employment reporting, on top of BLS assumptions that jobs lost from companies going out of business are offset equally by the number of jobs created by new businesses.
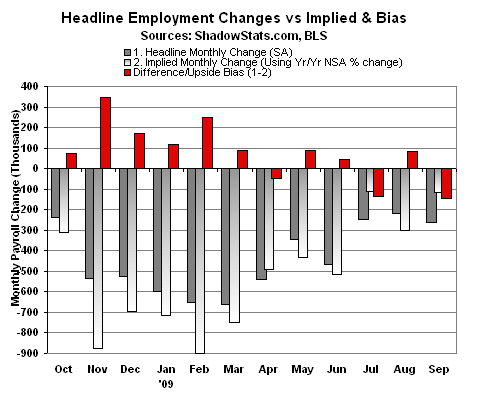
Unusual Revisions. While the concurrent seasonal factor bias (CSFB) reversed its usual trend in the September report, suggesting that consistently applied seasonal factors would have produced a smaller-than-headline jobs loss, such was against an unusual pattern of prior monthly revisions. On a not-seasonally-adjusted basis, total August payroll employment was not revised (seasonally adjusted it was revised higher by 15,000), yet July’s unadjusted level was revised lower by 55,000, following a 136,000 downside revision to July in the reporting of the month before. Seasonally adjusted, July’s initial estimate of a 247,000 jobs, revised subsequently to losses of 276,000 and today’s estimate of 304,000, which still is 134,000 shy of the downside revisions to the raw data. While these numbers showed unusual revision and seasonal-factor patterns, they were a month removed from being reflected in the CSFB, which deals only with the prior month’s revisions.
Household versus Payroll Series. I long have contended that the household survey (unemployment, measuring the employment status of individuals) is statistically sounder than the establishment survey (payroll employment, measuring the number of nonfarm jobs). (See the Employment and Unemployment Primer on www.shadowstats.com.) The BLS attributes narrower statistical confidence intervals around the payroll numbers, claiming a broader-based survey. While the payroll survey is broader based, the BLS never knows what it really is receiving in data (did a company just not get its report in on time, or did it go out of business?), and revisions over the last year or two have been well outside the bounds of the estimated confidence intervals. The household survey, however, is one where the sampling universe is fairly well established, and the unadjusted raw data are not revised. The issues with the household survey usually are more in the area of how survey questions are defined, rather than problems with the nature of survey’s universe.
That said, accounting for all definitional differences, the BLS never has been able to reconcile fully the numbers in the two surveys. In September, the number of employed individuals (household) dropped by 785,000 versus a payroll employment drop of 263,000.
More Disappointed Market Expectations Ahead. The consensus outlook and continued hype from Wall Street and political Washington on improving economic conditions remain irrationally optimistic. As underlying reality continues to surface in most upcoming economic reporting, consensus economic expectations should soften anew. With the constraints on broad systemic liquidity still tightening, unhappy surprises are likely in that area as well. Accordingly, as the lead-time (six-to-nine months) between any stimulus action and potential economic impact starts to push against the 2010 mid-term elections, some renewed activity by the Administration, Treasury and/or Fed to boost the economy and systemic liquidity is a good bet, irrespective of current strong protestations to the contrary.
Accordingly, there should come a point where more-traditional relationships should begin to resurface in the markets, where a weaker U.S. economy has negative impact on the U.S. dollar’s foreign exchange rate, and where a weakening U.S. dollar begins to restrict domestic liquidity, hitting both the equity and credit markets.
September Employment/Unemployment — Percent Jobs Loss Worst Since Great Depression:
Payroll Survey. The BLS reported a statistically-significant, seasonally-adjusted jobs loss of 263,000 (down 276,000 net of revisions) +/- 129,000 (95% confidence interval) for September 2009, following a revised 201,000 (previously 216,000) jobs loss in August.
From peak-to-trough (the peak month was December 2007; the current month of September also is the short-lived trough of the current cycle), payroll employment has declined by a seasonally-adjusted 7,205,000 jobs, or by 5.2%. Net of the pending benchmark revision, the peak-to-trough decline likely has been closer to 9 million jobs or 6.5%.
Year-to-year contraction (unadjusted) in total nonfarm payrolls narrowed a notch or so to 4.2% in September versus a 60-year low of a 4.4% decline in August. Adjusted for the benchmark revision, however, September’s annual decline likely was around 5.2%, the most severe contraction seen since the production shutdown following World War II. That extreme likely was passed by May 2009. Disallowing the post-war shutdown as a normal business cycle, the annual decline would be the worst since the Great Depression.

Underlying economic series (such as the purchasing managers and help-wanted advertising surveys, and new claims for unemployment insurance) are consistent with a monthly September jobs loss in excess of 500,000. Such reflects likely revisions and aggregated birth-death model understatements of roughly 200,000 jobs per month.
Concurrent Seasonal Factor Bias. The pattern of impossible biases being built into the headline monthly payroll employment reversed again, with a downside bias of 146,000 jobs in September 2009 reporting. Instead of the headline jobs loss of 263,000, consistent application of seasonal-adjustment factors — net of what I call the concurrent seasonal factor bias (CSFB) — would have shown a less-severe monthly jobs loss of about 117,000. This factor has generated an upside reporting bias seen in 9 of the last 12 months, with a rolling 12-month total upside headline-number bias of 935,000. Distorting factors are discussed in the Overview, above. A worksheet on this is available upon request. (See SGS Newsletter No. 50, for further background.)

Birth-Death/Bias Factor Adjustment. As discussed in SGS Newsletter No. 51, Birth-Death Model biases tend to overstate payroll employment during recessions. Never designed to handle the downside pressures from an economic contraction, the model adds a fairly consistent upside bias to the payroll levels each year, currently averaging about 74,000 jobs per month. The unadjusted September 2009 bias was an addition of 34,000 jobs, up from 18,000 the year before, and down from 118,000 in August 2009.
Household Survey. The usually statistically-sounder household survey (see Overview comments), which counts the number of people with jobs, as opposed to the payroll survey that counts the number of jobs (including multiple job holders), showed September employment dropped by 785,000 in September, versus a decline of 392,000 in August.
The September 2009 seasonally-adjusted U.3 unemployment rate showed a statistically-insignificant increase to 9.83% +/- 0.23% (95% confidence interval), from 9.66% in August. Unadjusted U.3 eased to 9.5% in September, from 9.6% in August. The broader September U.6 unemployment rose to an adjusted 17.0% (16.1% unadjusted), from 16.8% (16.5% unadjusted) in August.
During the Clinton Administration, "discouraged workers" — those who had given up looking for a job because there were no jobs to be had — were redefined so as to be counted only if they had been "discouraged" for less than a year. This time qualification defined away the long-term discouraged workers. The remaining short-term discouraged workers (less than one year) are included in U.6.
Adding the excluded long-term discouraged workers back into the total unemployed, unemployment more in line with common experience — as estimated by the SGS-Alternate Unemployment Measure — rose to about 21.4% in September, up from 21.1% in August. See the Alternate Data tab at www.shadowstats.com for a graph and more detail.
Broad Money Growth Continues to Falter. Last night’s (October 1st)weekly reporting on M3 components (seasonally adjusted) M2 and institutional money funds showed continued weekly contractions. While I am still a week shy of publishing a formal estimate of September’s SGS-Ongoing M3, annual growth in the measure likely will slow again, nearing 2% annual growth versus the 3.9% estimated at present for August. There is nothing in the data of the last month that would alter the content of the September 2nd Alert.
Week Ahead. August Trade Balance. Due for release on Friday (October 9th), reporting of the August trade deficit is at some risk of deterioration, assuming the catch-up reporting seen in the July report carries through into the current number. Such will be the last trade deficit estimate before the "advance" estimate on third-quarter GDP is published at the end of October. Significant deterioration in the deficit could soften some of the stronger forecasts surfacing for the current quarter’s GDP growth.
__________