Flash Update
FLASH UPDATE - June 3, 2008
JOHN WILLIAMS’ SHADOW GOVERNMENT STATISTICS
FLASH UPDATE
June 3, 2008
__________
A Case for Manipulation of Headline Payroll Employment Numbers
__________
The pending newsletter has been pushed back until this coming weekend. Nothing in the general outlook has changed. Today’s Flash Update, however, offers a preview of one area of focus in the coming missive: manipulation of key headline economic statistics, as it relates to payroll employment. Issues tied GDP and CPI reporting will be covered in the newsletter.
– Best wishes to all, John Williams
Headline Monthly Payroll Changes Suggest Data Massaging
In the May 2nd Flash Update, I asserted, "Apparently the Administration and the Fed have moved to a rig-the-data mode, in order to avoid appearances of the economy falling into recession." That pattern of reporting appears to be ongoing. Contending that the government is manipulating current economic reporting is not a position I take lightly, hence this Flash Update. With the May payroll data due this Friday (June 6), the following analysis details of some of the unusual reporting seen in recent headline reports of jobs data — specifically the first estimates of monthly change in seasonally-adjusted payrolls — numbers so closely followed by the financial markets and media.
There are two types of manipulation that distort economic reporting. Manipulation of the first kind includes long-term methodological changes to the definition, gathering, analysis or reporting of key data, with the impact of building in a reporting bias that generates overly positive results. As a result, government reporting increasingly strays from common experience. Examples of this type of manipulation include the creation of the monthly bias-factor/birth-death model adjustment added into payroll employment, or the elimination of accounting for millions of "discouraged workers" due to redefinitions.
Manipulation of the second kind involves direct adjustment of targeted, current economic reporting for near-term political or financial market needs. An example would be Lyndon Johnson’s reviewing the GNP reports before they were published, and his sending them back to the Commerce Department for "correction," if he did not like the result.
The current matter involves manipulation of the second kind. If indeed it is taking place, it offers some political buffer to the Bush Administration from the inflationary recession that otherwise would help political opposition in November. It also would be an inexpensive alternative to other policy tools that might be considered by the Federal Reserve and the Administration in their efforts to support troubled financial markets and related institutions.
While there have been several instances of the second kind of manipulation in earlier administrations that I have been able to document (see the Primer Series available at www.shadowstats.com), the current contention is based on significant circumstantial evidence; there is no whistleblower or other direct proof at present of what appears to be happening.
In the case of Payroll Employment, published monthly by the Bureau of Labor Statistics (BLS), the data that go into the monthly calculations and seasonal adjustments are massive and complex. Out of necessity, very few individuals would be involved or have direct knowledge of what was happening where the numbers might be getting a political massaging. Indeed, in some earlier documented cases, the manipulations were orchestrated by the Fed or a given administration from outside the statistical agency that did the reporting.
When irregular changes are made within a complex reporting system, however, such sometimes leaves unintended evidence of the manipulation that can be found in careful examination of the available data. During the Clinton Administration, for example, an examination of monthly revisions to payroll employment reporting showed that seasonally-adjusted monthly jobs growth was being targeted for an extended period of time at exactly 250,000 jobs per month or exactly 500,000 jobs per two months (a target of 3,000,000 jobs per year). After the BLS was questioned on the matter, those patterns disappeared from further reporting.
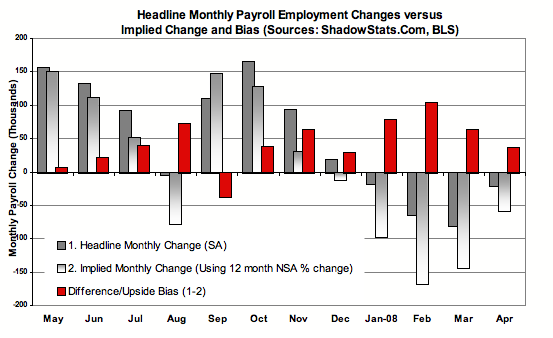
Impossible Seasonal Adjustments. A generally unrecognized issue with current payroll reporting is highlighted in the above graph, a circumstance that has been enabled by the BLS’s "concurrent" seasonal adjustment practices, which calculate current-month and recalculate recent-month seasonal adjustments each month. Over the period of a year, seasonally-adjusted and unadjusted series should be equal to each other. Instead, unusual seasonal-adjustment patterns appear to have "created" 517,000 jobs in the headline employment numbers in the last year, with nearly 300,000 of those being generated in January through April.
The purpose of seasonally-adjusting payrolls is to redistribute reported employment activity throughout the year, so as to smooth out monthly activity for regular variations tied to calendar events, holiday-season employment, school year, etc. At the end of a year, both the seasonally-adjusted and unadjusted series should equal each other. Using seasonal adjustments should not end up creating the reporting of new jobs, only redistributing the numbers over the period of a year.
One way of avoiding having to use seasonal adjustments in order to assess current monthly trends is to look at the year-to-year change in the monthly series, as such neutralizes the bulk of seasonal variation. The exception would be where calendar variations, such as an early or late Thanksgiving, might result in some irregular (when viewed year-to-year) month-to-month shifting of jobs.
That said, under most circumstances, the year-to-year percent change in monthly payrolls should be virtually identical for both the seasonally-adjusted and unadjusted series. One of the regular cross-checks I run on the monthly employment data is to look at the adjusted and unadjusted year-to-year change in the employment levels that generate the headline jobs creation number. Therein lies a situation that cannot be happening with honest reporting.
For each headline employment number in the last year (subsequent revisions are not relevant here, as the headline number is what would be targeted and what is followed by the markets and media), the year-to-year unadjusted change was calculated and used to work out an implied seasonally-adjusted set of numbers. For example, for April 2008 jobs report, the unadjusted employment levels for March and April 2008 were divided by the same numbers for 2007. If the year-to-year percent changes in the numbers on an unadjusted basis were the same as the adjusted, then applying the unadjusted annual rates of growth from the unadjusted series to the adjusted March and April 2007 numbers would yield the same March and April 2008 as officially published.
That, however, does not work out. As reported, April payrolls of 137,818,000 fell by 20,000 from March’s 137,838,000. Estimating the adjusted series using the unadjusted growth patterns shows April at 137,742,000, down by 57,000 from 137,799,000.
The problem is that this pattern has been repeated in 11 of the last 12 months, suggestive of some intelligent intervention in what otherwise should be something of a random process. While the math may be somewhat convoluted (a worksheet on the data is available on request), and comparative adjusted and unadjusted annual growth rates will vary some month-to-month, the variations should lead to irregular patterns of higher and lower implied change versus reported headline jobs change (adjusted and unadjusted series should equal each other over time).
Instead, with the exception of September 2007 (which may have involved unusual Administration versus Fed pressures on the approach to the banking crisis), every month in the last year has shown an implied upside bias in the headline reporting. The total upside bias over the last 12 months was 517,000 (just headline, not net of revisions), with monthly biases in January through April 2008 running respectively 79,000, 104,000, 63,000 and 37,000.
As with the Clinton Administration’s apparent 250,000 per month jobs targeting, this circumstance likely will disappear as it gets exposure.
The circumstantial case for massaged jobs data considers the preceding, in conjunction with potential political/financial-market motivation and with other employment-related data, such as help-wanted advertising, jobless claims and purchasing managers surveys, all of which suggest recent monthly employment declines should have been six-digit.
As to Friday’s reporting of May employment, expectations seem to be around a 50,000 monthly jobs loss. Recent reporting trends would suggest a fair risk of a politicized number coming at a more positive level than consensus. Other employment indicators suggest reality would be closer to 100,000-plus monthly jobs decline.
Full details on the various economic reporting will be covered in the pending newsletter.
__________
The U.S. economy remains in an intensifying inflationary recession, while the banking solvency issues fester. Continuing market turmoil, central-bank/government intervention (particularly in the currency and gold markets), increasing economic data distortions and ongoing systemic shocks remain within the general outlook, which is unchanged.
Publication of the next regular newsletter should be over the coming weekend. Any intervening Flash Updates and Alerts will be posted as needed. All postings will be advised by e-mail.