Flash Update
JOHN WILLIAMS’ SHADOW GOVERNMENT STATISTICS
FLASH UPDATE
October 26, 2008
__________
Bank Lending Picks Up
Monetary Base Up 38.0% Year-to-Year
Near-Term U.S. Debt Default Unlikely,
Unless Lenders Request Non-Dollar Issuance
Administration Signals Reporting of 3rd-Qtr GDP Contraction
__________
PLEASE NOTE: The following is a brief update on the money numbers and pending economic reporting. The full newsletter will follow next weekend with the third-quarter advance GDP estimate and pre-election considerations. The markets and the global financial system remain in a state of flux, but the long-range outlook is unchanged. — Best wishes to all, John Williams
The Cost Is Money Growth and Inflation. The global financial system remains in turmoil, ongoing panic and a state of flux. Messrs. Bernanke and Paulson will continue to do whatever they have to do to prevent a functional collapse of the U.S. financial services industry, at any cost. The eventual cost to the U.S. financial and economic system will be much higher inflation.
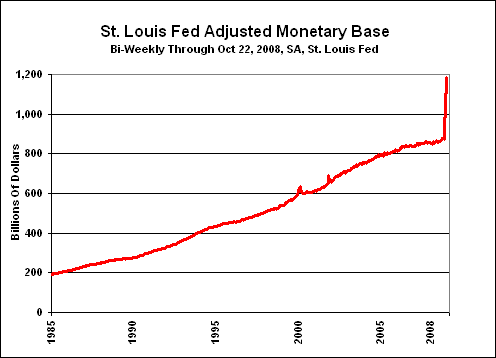
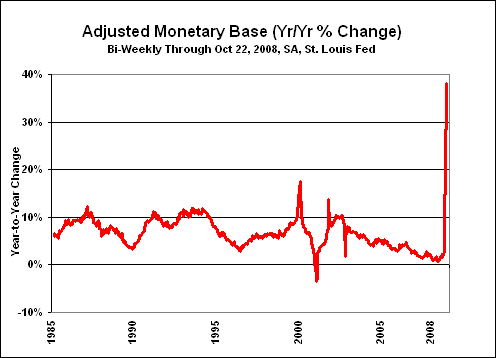
As shown in the accompanying graphs the monetary base has seen an unprecedented surge, reflecting total reserves of depository institutions jumping from an average of $47.1 billion (seasonally-adjusted) in the two weeks ended September 10th, to $328.6 billion in the period ended October 22nd.


Using the St. Louis Fed’s Adjusted Monetary Base (effectively total reserves plus M1 cash in circulation), the year-to-year growth in the latest period was an unprecedented 38.0%. In the period since 1919, the previous high growth rate was 28% in September 1939, as the U.S. was building up industry for the evolving war in Europe.
Back in the days when the Federal Reserve targeted money supply growth, the monetary base was the measure it adjusted. The current surge in the base is a direct result of the ongoing, extraordinary actions taken by the Federal Reserve and the U.S. Treasury aimed at preventing a collapse of the U.S. financial system. The higher monetary base growth will result in sharp spikes to domestic money supply growth and will intensify inflationary pressures in the year ahead, irrespective of wild gyrations and sell-offs in oil and of strength in the U.S. dollar, that otherwise should prove very short-lived going forward. The key to expanded money growth in this environment is growth in bank lending, and the difficulties there seem to be easing.
Commerical Bank Lending (Federal Reserve Board H.8)
Seasonally-Adjusted
2007
2008
2008
Annualized
Year
As shown in the accompanying table of current commercial bank lending (latest reporting is through October 15th), annualized growth in the six weeks since the Fed started re-infusing the system with extraordinary liquidity has been 47% for total commercial and consumer lending, versus a year-to-year rate of growth of about 9%. These numbers do not reflect the sharp fall-off in commercial paper outstanding, which has triggered some growth in back-up commercial and industrial lending, but the Fed will be addressing the commercial paper market in the weeks ahead, as lender, backer and market creator of last resort.
As discussed in the Money Supply Special Report of August 3, 2008, there is no perfect measure of money growth. Generally, the broader the measure (M3 being the broadest until discontinued by the Fed in 2006, still estimated by the SGS-Ongoing M3), the better it is as a predictor of inflation. Discontinued in 1998 by the Fed was a still-broader measure known as "L" for liquid assets. It contained individual holdings of Treasury bills.
In the recent panic, the Treasury issued bills to help keep that market liquid, but had the effect of drawing cash out of the system and out of the reported money supply. The most recent reporting (week ended October 13th) showed M3 components M2 and institutional money funds rising sharply, but reporting on large time deposits (October 15th) showed continued decline. The weekly numbers are in a state of flux and heavy week-to-week revision. In the weeks ahead, the money numbers should stabilize, and should start to spike sharply in terms of annual growth in the SGS-Ongoing M3 estimate.
Fed apologists offer assurances that the U.S. central bank will dry up excess liquidity when the crisis passes, with no net impact on money supply growth or inflation prospects. Assurances also are being put forth that the surge in government borrowing will be absorbed happily by the usual forced lenders, and that the Fed will not have to monetize Treasury debt further. Do not count on that!
Risks of a U.S. Default. Several readers have sent me articles suggesting that the explosive growth in U.S. federal debt portends a U.S. debt default as early as next year. Such is not likely, unless foreign lenders start making not-so-unreasonable demands that the United States issue its debt in yen, pounds, euros, etc. While the government’s gross debt level is exploding, the United States had no prospects of ever honoring the obligations that already were in place before the current crisis (see the Hyperinflation Special Report of April 8, 2008). Under such circumstances, most governments would opt to use the printing press to hyperinflate their way out of debt, rather than to go through a formal debt default.
If, however, the U.S. had to start covering new obligations in something other than the U.S. dollar, then the risk of default would become meaningful, and sovereign ratings on non-dollar U.S. Treasury debt easily could fall below investment grade.
Third Quarter GDP to Contract. With all that has happened in recent weeks and with official Washington trying to convince the public that the sky was falling, the issue of whether the economy is headed into recession became something of a moot point. In an unusual move, the Administration announced (October 23rd), "We expect our [GDP] number next week not to be a good one, and the next quarter could probably be tough as well."
Such a statement closer to announcing a contraction (and recession) than most administrations would get. Most administrations would try to keep the estimate in positive territory less than a week before an election. Yet, a week in advance (release scheduled for October 30th), the Administration has a pretty good idea of what will be reported for the "advance" growth estimate for real (inflation-adjusted) third-quarter GDP. With consensus forecasts moving from flat to a 0.5% annualized quarterly contraction (per Briefing.com), such is a likely target for the Bureau of Economic Analysis estimate.
As will be discussed in the upcoming newsletter (and has been discussed in prior newsletters), the recession likely started late in 2006, and it is the second downleg of a much longer and deeper 2000 recession than officially is recognized, at present.
Durable Goods and Consumer Confidence Should Suffer. Given the market turmoil and economy-bashing out of Washington, both the October Consumer Confidence and Sentiment measures should take tremendous hits (due respectively October 28th and 31st). The regularly-volatile new orders for durable goods should see a continued decline on a year-to-year basis (due October 29th).
U.S. Dollar, Gold and Oil. With the financial panic continuing, the markets are not close to being in balance. Recent U.S. dollar strength and gold weakness have been heavily influenced by forced liquidations, position squaring, etc. by troubled entities. At such time as the markets return to some level of stability, heavy dollar selling and gold buying likely will resume. As the dollar tumbles anew, that should add some upside pressure to oil prices, irrespective of slowing global demand. More detail follows in the newsletter.