Flash Update
JOHN WILLIAMS’ SHADOW GOVERNMENT STATISTICS
FLASH UPDATE
November 23, 2008
__________
Monetary Base Annual Growth Now at 75.5%
Systemic Solvency Crisis Intensifies Anew
Increased Nationalization of U.S. Banks Ahead?
__________
PLEASE NOTE: Any major systemic, market or economic surprises will be addressed in the week ahead with a Flash Update or Alert. Otherwise, the next update will follow on Monday, December 1st.
– Happy Thanksgiving to all! John Williams
Fed’s Extreme Liquefaction Has Moved Neither Lending Nor Broad Money Growth Meaningfully. Both Bloomberg and Reuters reported late Friday that Citigroup may be propped further by additional government or Fed action. Such tends to confirm the picture shown in latest money and reserve data (Federal Reserve publications H.3, H.6, H.8). Despite extreme banking system liquefaction by the Fed, neither bank lending nor broad money growth has started to show meaningful positive movement. Instead, the systemic solvency crisis appears to be intensifying, once again.
Irrespective of changing administrations, the U.S. Treasury and the Federal Reserve still have to do — and will do — everything within their ability to prevent a collapse of a functional financial services industry. The ongoing crisis cannot be put on hold for two months, awaiting the Obama Administration. Creative funding seems to be nearing its practical limits, but lack of confidence in the system continues. Any number of surprises could be forthcoming. Such might include something where the government not only puts its full faith and credit behind the functioning of the banking and financial system, but also where it takes partial or direct control, with some form of increased nationalization.
For the seasonally-adjusted daily average for the two weeks ended November 19th, total reserves of depository institutions surged again, to $652.9 billion, up from $415.7 billion in the prior period. The latest numbers are up nearly 15-fold from August’s monthly average of $44.6 billion, prior to the Fed’s extreme liquefaction in response to the current intensification of the systemic solvency crisis.
The surge was reflected in excess reserves (increase of $241.1 billion, from $363.6 to $604.7 billion), which grew faster that total bank borrowings from the Fed (increase of $49.9 billion from $675.3 to $725.2 billion). This suggests some regression in banks moving towards more normal functioning.
Required reserves (seasonally-adjusted) eased to $48.1 billion in the two weeks ended November 19th, from $52.1 in the prior two-week period, which in turn had been up from $46.9 billion in the period before. While year-to-year growth in required reserves was an historically strong 18.0% in the November 19th period, it was down from the prior period’s 28.9%. Again, this was suggestive of some regression in bank lending versus what had been in place two weeks ago.
The Fed’s primary tool for controlling money supply is the monetary base, and the St. Louis Fed’s adjusted measure (seasonally adjusted) continued its explosive growth, reflecting the increase in total reserves. Against the prior two-week period, the St. Louis Fed measure gained 19.1%. Year-to-year growth rose to 75.5% from 48.2% in the period before.
In terms of reported seasonally-adjusted M3 components, where the latest data (H.6) are for the week ended November 10th (more than a week shy of the reserve data), M2 rose by $29.5 billion to $7,907.1 trillion and institutional money funds rose by $10.0 billion to $2,223.0 billion, but the (H.8) data (through November 12th) indicated a roughly $37 billion weekly decline in large time deposits and a sharp fall-off in bank repos. Consistent with a re-intensify solvency crisis, there is nothing so far in the early November data to suggest a surge in broad money growth.
Have you ever been in the circumstance where you thought you had lit a charcoal fire, successfully, but then flames disappeared and the smoldering died down without the coals turning white? Although it can work, I do not advocate throwing a glass-full of lighter fluid on smoldering coals (such can be very dangerous). If you should do so, and the fire does not ignite, there likely arises a cloud of highly flammable fumes, where a thrown match will trigger an explosion something akin to a fuel-air bomb. The Fed has dumped the fuel. The fumes are there; what is needed is for someone to toss a lit match.
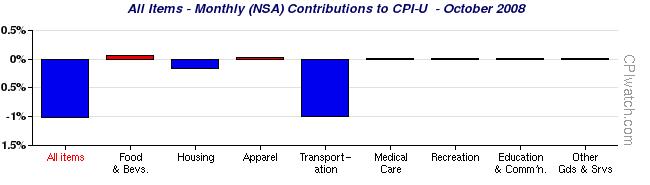
Falling Consumer Prices Largely Tied to Oil. The recent sharp monthly drop in the official CPI has been heavily touted as deflation at hand. In that monthly CPI levels swing plus or minus regularly, even on a seasonally-adjusted basis, inflation in the prices of goods and services traditionally is measured on a year-over-year basis, which remains far from turning negative.
The monthly October decline in the adjusted CPI-U was due to the effects of collapsing oil prices, as shown in the accompanying graph, courtesy of CPIwatch.com. The broad categories that showed monthly contractions — transportation and housing — showed upon further drill-down that the declines primarily were due to declining energy-related cost components.
Produced by a colleague who works with me on ShadowStats.com, CPIwatch.com is intended as a helpful tool in accessing the official government CPI-U data. Those who like to play with numbers and to look at them from different angles will find the available detail quite interesting.
The sharp drop in oil prices reflects a great deal more than slowing global demand, which is being offset to a certain extent by oil cartel production cuts. As discussed in the most recent newsletter, some of the oil/gasoline price decline may have been encouraged by pre-election politics. More important, though, has been the impact of a stronger U.S. dollar. At such time as the dollar resumes its major, long-term downtrend, upside pressure on dollar-denominated oil prices also should resume.
U.S. Dollar Remains Key to Next Phase of Crisis. The U.S. financial system remains unstable and continues in crisis. The U.S. financial markets remain in turmoil, and are highly unstable and often appear irrational. Crosscurrents from systemic deleveraging and forced liquidations have been and remain in play. At such time as the U.S. system begins to stabilize, as U.S. banks begin to lend more normally, as individuals begin to take their cash out from underneath their mattresses, broad money growth will begin to pick-up sharply, spiking annual M3 growth from its 10.8% October level. At the same time, U.S. dollar selling should resume, with related upturns in precious-metals and oil prices.
As dollar selling intensifies, dumping of the U.S. currency and dollar-denominated assets should follow, with flight from the dollar turning into a flight-to-safety outside the dollar. Such will increase the downside stress on U.S. financial markets and will pressure the Fed to monetize U.S. Treasuries otherwise not wanted by the investing world. As recently seen, these markets can turn sharply overnight. The timing on renewed dollar selling is an open question. The dollar could turn at any time, with little or no warning, but it may take months before the U.S. currency begins to move once again in tandem with its underlying economic and political fundamentals.
Week Ahead. GDP. Market expectations (per Briefing.com) are for the "preliminary" estimate revision of third-quarter GDP to hold at a 0.3% annualized real (inflation-adjusted) contraction, due on Tuesday (November 25th). While recent trade data would suggest stronger growth, retail sales and industrial production numbers would suggest weaker growth. The Bureau of Economic Analysis can bring in the number anywhere it wants to, with a likely eye on not being market-disruptive.
Consumer Confidence. The November Conference Board (Tuesday, November 25th) and Reuters/University of Michigan (Wednesday, November 26th) series likely both will sink further, particularly on a year-to-year basis.
New Orders for Durable Goods. Due for release on Wednesday (November 26th), this regularly-volatile series could show a sharper October monthly contraction than the 2.2% consensus (Briefing.com). Annual change in durable goods orders should show a deepening decline, consistent with the intensifying economic downturn.
__________