May 2008 - Overview
Issue Number 43
June 9, 2008
__________
Inflationary Recession and Banking Crises Continue to Intensify
Market Fantasies of Contained Crises Begin to Fade
Severe Inflation Surge in Offing
Evidence Mounts for Manipulation of Key Headline Economic Numbers
__________
Section One
(View all Sections of this Issue)
OVERVIEW — OPENING COMMENTS
There is no question of the economy being in an intensifying inflationary recession. Market fantasies of a bottomed downturn and a banking system on the mend got a jolt of reality last week, and regardless of any further jolts of alternating market pressures, the longer range outlook remains bleak for U.S. equities, bonds and the dollar but remains brilliant for gold.
A near-manic jump in oil prices and a reported surge in the May unemployment rate understandably rattled the markets. More disturbing, though, was that while Mr. Bernanke was pushing new liquidity into troubled banks — exacerbating inflation and dollar problems — he crossed his fingers behind his back and began jawboning in support of the dollar and raising concerns about inflation. All is not well in the banking system solvency crisis, and the Fed’s waffling suggests some bad news may be in the offing. The crisis continues, and it is severe.
Some questionable economic reporting of recent months can be attributed, at least partially, to the abuse and misuse of seasonal factors.
Data that have been properly seasonally adjusted enable meaningful period-to-period (such as month-to-month) comparisons. Seasonal adjustments are used to smooth out regularly repetitive patterns of economic activity tied to seasons, holidays and the school year, for example, or where monthly business activity may vary by the number of working days in a month.
Good quality seasonal adjustments, however, often are difficult to develop, and otherwise can be misleading by their general nature. My good friend Al Sindlinger (1907-2000), pioneer surveyor of consumer attitudes in the late-1920s and advisor to many presidents, beginning with Herbert Hoover, always had a twinkle in his eye when he described seasonal adjustments.
"You can sit with one foot in a bucket of ice water and the other foot in a bucket of boiling water," he would chuckle. "Seasonally adjusted, you’re very comfortable."
Indeed there is little comfort in the common experience of individuals, when government reporting suggests that they really are not paying $4.00 per gallon for gasoline, or that they really are not unemployed, when viewed on a seasonally-adjusted basis.
Seasonal adjustment of data can be misleading (often times inadvertently) as well as illuminating. This issue’s Reporting/Market Focus explores seasonal-adjustment abuse that appears to have enabled near-term manipulations of headline monthly payroll gains and CPI inflation. In other areas, misuse of the techniques or over-reliance upon inadequate factors may innocently generate inaccurate or conflicting information. Problems in seasonal adjustments, for example, likely accounted for at least part of the surge
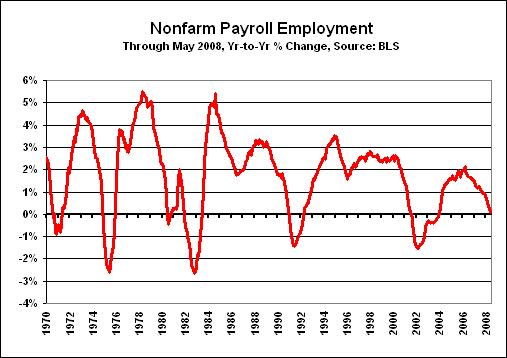
Recession Solidifies in Key Data. Official economic reporting in the last month or so has generated a rapidly solidifying picture of a recession in place. As shown in the preceding graph, year-to-year change in payroll employment was near zero in May. What the graph shows is that every time annual payroll growth has slowed to zero (in fact, every time it has slowed to below 1.0%), the economy has been in an official recession, or what shortly would be recognized as such. With the latest official payroll reporting, not only did payrolls show a first-quarter quarterly contraction, but also a second-quarter contraction appears highly likely.
The 0.5% surge in the May unemployment rate could be taken as a sign of recession, and indeed the unemployment rate should be rising. As discussed in the Employment/Unemployment section in the Reporting Perspective, though, part of that reported unemployment rate jump may be due to problems the Bureau of Labor Statistics (BLS) has in properly seasonally adjusting for school year variations.
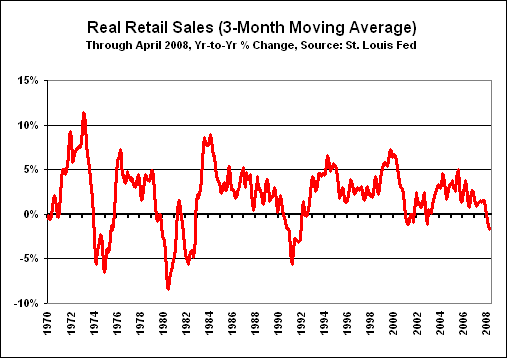
Nonetheless, the weakening employment circumstance is a strain on consumers, who account for more than 70% of GDP, when housing and personal consumption are included. In a related area, year-to-year inflation-adjusted growth in retail sales (smoothed with a three-month moving average), also has locked in a recession pattern. As shown in the preceding graph, the current level of annual contraction has not been seen historically outside of formal recessions, and the current contraction is the deepest since the 1990/1991 recession. When payrolls and retail sales show these patterns, a recession is in place.
Historic or near-historic annual contractions also were reported in May consumer confidence measures, April housing measures and help-wanted advertising. Recession patterns have been reflected in the latest industrial production, purchasing managers manufacturing survey, new orders for durable goods, new claims for unemployment insurance and real average weekly earnings series.
Continuing positive growth reported for the GDP is discussed in the Reporting/Market Focus on manipulation of headline economic data. Nonetheless, the GDI (Gross Domestic Income) — theoretical equivalent to the GDP — was virtually flat in first-quarter 2008, after a fourth-quarter 2007 contraction.
Other data related to consumer conditions are worthy of comment, in that they received some recent press, with the release of the Federal Reserve’s Flow of Funds reporting for first-quarter 2008. Keep in mind that the published data are of poor quality, particularly on a quarterly basis.
The story was that household net worth had declined for the second consecutive quarter, thanks to falling home prices. While indeed the household/nonprofit organizations first-quarter net worth figure of $56.0 trillion was down by $1.7 trillion from the fourth quarter, which in turn was down by $0.5 trillion from the third quarter, home prices had relatively little to do with it. Where household real estate values fell by 1.6% in the first quarter — following a 0.5% decline in the fourth quarter — over 80% of the decline in net worth was due to a decline in the stock market. Again, the numbers should not be relied on, but the suggestion is that the consumer indeed is indeed feeling something of a fundamental financial squeeze.
The economy remains in a major structural downturn that likely will evolve into a depression and eventual hyperinflationary great depression (see the Hyperinflation Special Report). Neither the federal government nor the Federal Reserve has viable options for turning the economy to the upside. Short-lived measures, such as tax rebate checks, will have little impact other than brief upside blips in activity.
Inflation Surge Likely in Second Half of 2008. As noted in the Reporting/Market Focus, seasonal factors that have been suppressing reported CPI annual inflation should reverse in the second half of the year. With current oil prices holding at levels more than double last year’s levels, inflation should start to show a sharp pick-up not only from energy and food, but also from recent dollar weakness and continued excessive money supply growth, as reflected in M3. By year-end 2008, official CPI annual inflation — now at 3.9% — could be pushing double digits.
The preliminary SGS-Ongoing M3 Estimate for May, based on 26 out of 31 days of data, shows annual growth slowing to 16.0%, from 16.4% in April and from a record 17.4% in March. The somewhat slower growth appeared to reflect intensification of the banking system solvency crisis, which the Fed addressed with expanded Term Auction Facility (TAF) lending. While growth in the weekly M3 components resumed thereafter, the turnaround was not soon enough to generate an overall higher rate of annual growth in May. Nonetheless, the May level of M3 annual growth remains significantly above levels that promise higher inflation in the months ahead.
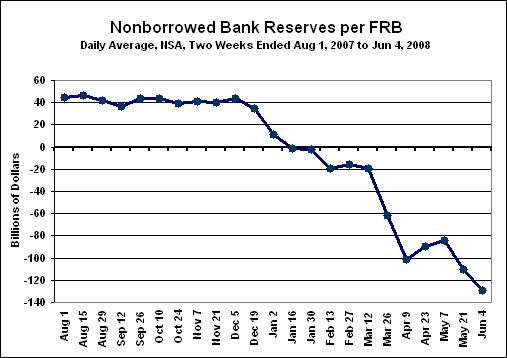
Banking System Stability Remains Elusive. Other than the hypesters on Wall Street, talk from central bankers and others knowledgeable within the system tend to confirm the continuing nature of the problems within the banking system. Direct evidence of ongoing trouble is seen in the increasing net lending of the Federal Reserve to troubled banks. The level of total nonborrowed reserves (a number that should be viewed on a not-seasonally-adjusted basis as to what is happening in the banking system) has continued to sink into record negative territory, a negative $129.3 ($130.3 adjusted) billion daily average for the two-week period ending June 4th, as shown in the following graph.
U.S. Currency as Sound as the CDOs Backing It? Updating the numbers as of June 4, 2008, the Fed reported physical U.S. currency (Federal Reserve Notes) in circulation at about $787 billion, the better portion of which circulates outside the geographic confines of the United States. While the U.S. currency has been a fiat currency (not backed by gold) for decades, the Federal Reserve Notes presently in circulation are collateralized by securities held by the Fed. Those securities primarily had been U.S. Treasury securities up until late-2007.
Since the onset of the banking solvency crisis and the establishment of various new lending facilities by the U.S. central bank, however, an increasing portion of the U.S. Treasury securities held as collateral has been lent to troubled financial institutions in exchange for largely illiquid collateralized debt obligations — including mortgage backed securities — those non-Treasuries now total in excess of 22% of the collateral backing the Federal Reserve Notes and appear to be increasing regularly.
Bernanke the Inflation Fighter? Despite developing claims to the contrary, the Fed’s primary concern remains preventing a systemic financial collapse; everything else is secondary or tertiary, including the dollar, inflation and the economy. The Fed has very limited ability at present either to stimulate the economy or to contain inflation, despite severe problems in both areas. From a practical standpoint, its ability to rally the dollar also is limited: (1) to jawboning, which is underway and (2) to intervention, which likely already has been seen on occasion on a covert basis. Raising rates, though an option, could play out very negatively in the domestic markets and economy, and hence the banking system.
Mr. Bernanke made the decision to sacrifice the U.S. dollar and inflation, months ago, as a cost of salvaging the financial system. The purported move now to cease cutting the rates likely is due to the targeted Fed funds rate being near a practical lower limit of 2.00%, and perhaps due to a forced rethinking of the to-hell-with-the-dollar policy of recent years. If sovereign threats of dollar abandonment/dumping appear serious enough to add a dangerous new twist to the domestic solvency crisis, then the Fed may be forced to spike interest rates sharply, despite negative effects on the domestic markets and economy.
Market Turmoil Is Not Over. Given the inflationary recession and the ongoing banking solvency crisis, there is no likely long-term happy result on the horizon for the U.S. equity and credit markets, or for the U.S. dollar. Gold and silver, however, should continue seeing significant long-term gains from the same factors that will pummel the other markets.
Wall Street will unwind at some point, as increasingly nightmarish scenarios begin to capture market thinking. The long-term underlying fundamentals remain miserable for equities and bonds. A severe and protracted bear market in equities already likely is underway. Foreign buying of U.S. debt and sporadic flight-to-quality have depressed Treasury yields, but inflation and developing U.S. dollar woes eventually will push long-term Treasury yields much higher, a process that already may have started. Recent strength/stability in the U.S. dollar and weakness in gold will prove as fleeting as the related central bank jawboning and likely intervention, covert or otherwise. Heavy dollar selling and strong gold buying remain good bets over the longer term.
PLEASE NOTE: A "General background note" provides a broad background paragraph on certain series or concepts. Where the language used in past and subsequent newsletters usually has been or will be identical, month-after-month, any text changes in these sections will be highlighted in bold italics upon first usage. This is designed so that regular readers may avoid re-reading material they have seen before, but where they will have the material available for reference, if so desired.
Alternate Realities. This section updates the Shadow Government Statistics (SGS) alternate measures of official GDP, unemployment rate and CPI reporting. When a government economic measure does not match common public experience, it has little use outside of academia or the spin-doctoring rooms of the Federal Reserve, White House and Wall Street. In these alternate measures, the effects of gimmicked methodological changes have been removed from the official series so as to reflect more accurately the common public experience, as embodied by the pre-Reagan-Era CPI and GDP and the pre-Clinton Era unemployment rate. Methodologies for the GDP and CPI series are discussed in the August 2006 SGS. Issues as to current manipulation of the headline numbers of these series are discussed in the Reporting/Market Focus.
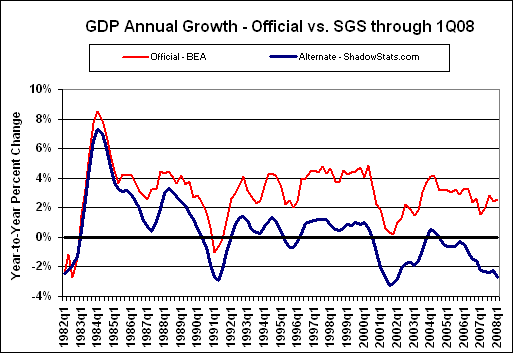
GDP. The alternate first-quarter 2008 GDP growth reflects the "preliminary" estimate revision, with many of the methodological gimmicks of recent decades removed. The alternate first-quarter inflation-adjusted annual growth rate (year-to-year, as opposed to the popularly-touted annualized quarter-to-quarter rate) for GDP was a decline of roughly 2.7% versus the official year-to-year gain of 2.5%. The official annualized real growth rate for the quarter was 0.9%. While the quarterly growth number is popularly followed, its significant inaccuracies are expanded to the fourth-power in reporting. The alternate measure safely would have shown a quarterly contraction.
General background note: Historical data on both the official and SGS-Alternate GDP series are available for download on the Alternate Data page of www.shadowstats.com. The Alternate GDP numbers tend to show deeper and more protracted recessions than have been reported formally or reflected in related official reporting. Nonetheless, the patterns shown in the alternate data are broadly consistent with the payroll employment and industrial production series (as revised), which are major indicators used by the National Bureau of Economic Research in determining the official timing of U.S. business cycles.
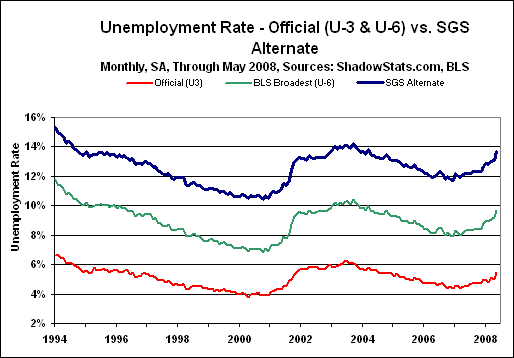
Unemployment Rate. Shown are two official seasonally-adjusted unemployment measures, U.3 and U.6, and the SGS-Alternate Unemployment Measure. All three measures moved sharply higher in May in response, at least partially, to rapidly deteriorating labor conditions, standing respectively at 5.5%, 9.7% and 13.7%, up from 5.0%, 9.2% and 13.1% in April.
U.3 is the popularly followed unemployment rate published by the Bureau of Labor Statistics (BLS), while U.6 is the broadest unemployment measure published by the BLS. U.6 is defined as total unemployed, plus all marginally attached workers, plus total employed part time for economic reasons, as a percent of the civilian labor force plus all marginally attached workers. Marginally attached workers include the discouraged workers who survived redefinition during the Clinton Administration. The SGS-Alternate Unemployment Measure simply is U.6 adjusted for an estimate of the millions of discouraged workers defined away during the Clinton Administration — those who had been "discouraged" for more than one year.
General background note: Historical data on both the official and SGS-Alternate unemployment series are available for download on the Alternate Data page of www.shadowstats.com. The Alternate numbers are reported from the 1994 series redefinitions forward. It is planned to take the alternate series further back in time.
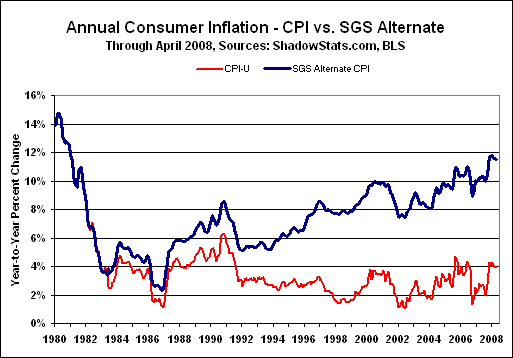
CPI. April’s annual non-core and core inflation rates tended to hold at prior-month levels or one notch lower. Nonetheless, annual inflation rates should continue rising well into 2009, with mounting inflationary pressures reflecting the increasing impact of energy-cost damages to the general economy, combined with pressures from a weak dollar and extremely high monetary growth.
Outright data manipulation appears to be an ongoing issue. Recent food and oil-related price pressures still have been reflected only minimally in current reporting, and that increasingly has caused some in the financial media to question the accuracy of official inflation reporting.
General background note: Historical data on both the official and SGS-Alternate CPI series are available for download on the Alternate Data page of www.shadowstats.com. The Alternate CPI numbers tend to show significantly higher inflation over time, generally reflecting the reversal of hedonic adjustments, geometric weighting and the use of a more traditional approach to measuring housing costs, measures all consistent with the reporting methodology in place as of 1980. Available as a separate tab at the SGS homepage www.shadowstats.com is the SGS Inflation Calculator that calculates the impact of inflation between any two months, 1913 to date, based on both the official CPI-U and the SGS-Alternate CPI series.
|
Eight Levels of Consumer Inflation |
|||||
|
2008 |
|||||
|
Measure |
Jan |
Feb |
Mar |
Apr |
|
| I.1 | Core PCE Deflator (r) | 2.0% | 1.9% | 2.1% | 2.1% |
| I.2 | Core Chained-CPI-U | 2.2% | 2.0% | 2.1% | 2.0% |
| I.3 | Core CPI-U | 2.5% | 2.3% | 2.4% | 2.3% |
| I.4 | PCE Deflator (r) | 3.5% | 3.4% | 3.2% | 3.2% |
| I.5 | Chained-CPI-U | 3.9% | 3.7% | 3.6% | 3.5% |
| I.6 | CPI-U | 4.3% | 4.0% | 4.0% | 3.9% |
| I.7 | Pre-Clinton CPI-U | 7.6% | 7.3% | 7.3% | 7.3% |
| I.8 | SGS Alternate Consumer Inflation | 11.8% | 11.6% | 11.6% | 11.5% |
|
(r) Revised. |
|||||
End of Section One
(View all Sections of this Issue)
PLEASE NOTE: The next SGS Newsletter is targeted for around the end of June. Intervening Flash Updates and Alerts will be posted in response to key economic or financial-market developments.
Earlier editions of the SGS Newsletter, referenced in the text, can be found on the Archives tab at www.shadowstats.com.
OCCASIONALLY, BRIEF UPDATES ARE COMMUNICATED DIRECTLY BY E-MAIL. IF YOU ARE NOT RECEIVING E-MAIL COMMUNICATIONS FROM US, PLEASE LET US KNOW at johnwilliams@shadowstats.com or by using the "Feedback" option on www.shadowstats.com.