No. 296: Retail Sales, Production and the Deficits
JOHN WILLIAMS’ SHADOW GOVERNMENT STATISTICS
COMMENTARY NUMBER 296
Retail Sales, Production and Deficits
May 14, 2010
__________
Retail Gain Statistically Indistinguishable from Contraction
Revisions Enhance Production Reporting
Trade Deficit Remains Economic Negative
Budget Deficit Widens Despite Gimmicks
__________
PLEASE NOTE: The next regular Commentary is scheduled for Wednesday, May 19th, following the release of the April consumer price index.
– Best wishes to all, John Williams
There are times when the economy has fallen into recession without money supply contracting first. Rising year-to-year growth in M3 not always is followed by increasing economic activity (the proverbial Fed pushing on a string), and a growth in the economy not always is preceded by growth in real M3.
Whenever real M3 has contracted on a year-to-year basis, however, the economy always has followed, either falling into recession, or if already in recession, intensifying. Such makes sense. If liquidity is strangled enough, the broad economy will suffer, every time. The present contraction in broad liquidity is the deepest of the post-World War II era. The lead time between the liquidity signal and economic activity is roughly six-to-nine months (the plot of M3 in the graph is shifted six months ahead on the time scale versus the payrolls).

The lead-time appears to be shorter in an existing recession, and evidence of an intensifying downturn should be imminent. This morning’s (May 14th) reporting of April retail sales and industrial production, however, had no downside surprises, showing somewhat stronger-than-consensus results (although the retail sales gain was statistically indistinguishable from a contraction).
Nonetheless, near-term economic activity will turn down, with major negative implications for the federal budget deficit, U.S. Treasury fundings, systemic solvency and the U.S. dollar. Such developments should place significant upside pressure on domestic inflation. U.S. difficulties eventually should dwarf the European sovereign solvency concerns currently helping to roil the markets. Accordingly, the long-term outlook for the U.S. dollar and U.S. equity and credit markets remains bleak, while the long-term outlook for gold and silver remains extremely strong.
The inflation outlook and the financial markets will be reviewed in greater depth with next week’s Commentary following the CPI release.
Reported Nominal Retail Sales. Today’s (May 14th) retail sales report for April 2010 — issued by the Census Bureau — indicated a statistically-insignificant, seasonally-adjusted monthly gain of 0.42% (up 0.88% net of revisions) +/- 0.6% (95% confidence interval). Such followed a revised 2.12% (previously 1.60%) monthly gain in March. On a year-to-year basis, April 2010 retail sales were reported up by 8.82% from April 2009, versus an upwardly revised 8.52% (was 7.62%) annual gain in March, with the April and March annual changes exacerbated by the severe trough seen a year ago and downside benchmark revisions to same.
Benchmark Revision. An annual benchmark revision, published on April 30th, revamped seasonal factors and encompassed detail from the 2008 economic census. The revisions were more significant in shifting monthly patterns than they were in altering annual levels. The contraction in annual 2009 retail sales deepened from 6.2% to 6.5%, with particular downside revisions to sales reported for February through May of 2009. April 2009 revised downward by 0.45%. Such had the effect of boosting April 2010 on a relative year-to-year basis and possibly may have shifted the seasonal factor distortions arising from the unusual length and depth of the current downturn.
For all of 2009, the level of annual sales was revised lower by 0.2%. The level of inventories also was revised lower, by 0.9% for the year. Lower sales and inventory would suggest lower levels of production than previously reported, or revisions to trade activity.
Real Retail Sales. Estimates of real (inflation-adjusted) retail sales will be published on Wednesday, May 19th, in the Commentary following the release of the April CPI data. Month-to-month real growth in retail sales for April likely was minimal, with annual growth somewhat over 6%.
Core Retail Sales. The "core retail sales" methodology was revamped recently, where the net relative monthly increases and/or decreases in gasoline station and grocery store sales were subtracted from the full monthly retail sales number, instead of the total of gasoline station and grocery store revenues each month. Assuming that the bulk of non-seasonal variability in food and gasoline sales is in pricing, instead of demand, the revamped reported "core" change more closely reflects the actual retail sales experience. In April a reported month-to-month decline in grocery store sales slightly more than offset a gain in sales at gasoline stations.
This approach remains a work in progress and eventually will be used in the development of additional SGS alternative economic measures. The "core" retail sales is reported in two versions, where Version I uses the original methodology, and Version II version appears to provide a more balanced picture of the impact food and energy inflation in the standard retail sales reporting.
Consistent with the Federal Reserve’s predilection for ignoring food and energy prices when "core" inflation is lower than full inflation, "core" retail sales:
Version I — April retail sales net of total grocery store and gasoline station revenues — rose by 0.6% versus the official aggregate gain of 0.4%.
Version II — April retail sales net of the monthly change in revenues for grocery stores and gasoline stations — rose by 0.4% versus the official aggregate gain of 0.4%.
The year-to-year change in April rose to 5.18% from a revised March annual gain of 3.80% (was 3.95%). The spike in annual growth was due largely to the pattern of collapsing activity a year ago, which bottomed out in June 2009.
The cycle-low reading in June 2009 of 95.75 reflected a 13.3% year-to-year contraction, the steepest annual decline in production growth since the shutdown of war-time production following World War II. For the last 16 months, the production index has averaged 99.07, around which the series has been fluctuating, with April’s six-month moving average reading at 101.01 versus 102.27 for the single month.
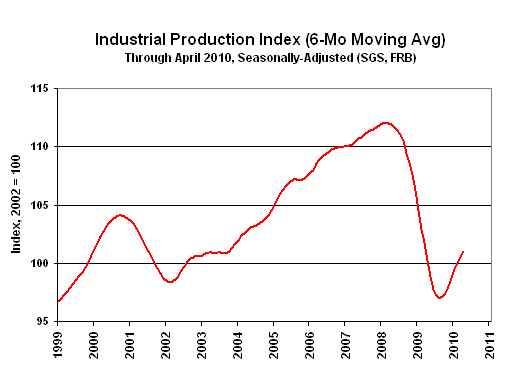
The "recovery" in production is shown in the above graph, where month-to-month volatility is smoothed using a six-month moving average. Production activity had leveled off at a low-level plateau of activity that effectively wiped out the last eight years of growth in industrial production. Despite the near-term upside bump generated by short-lived stimulus and seasonal distortions, the series generally still appears to be bottom-bouncing and should begin to soften anew, significantly, in the next several months.
Against February 2010, the March trade balance — as with February against January — reflected both higher imports and exports, with a sharper increase in imports. Higher March oil imports reflected both higher physical volume and oil prices. Specifically, for the month of March 2010, the not-seasonally-adjusted average price of imported oil was $74.32 per barrel, versus $72.92 in February 2010 and $41.36 in March 2009. In terms of not-seasonally-adjusted physical oil imports, March 2010 volume averaged 9.660 million barrels per day, versus 8.689 million in February 2010 and 9.345 million in March 2009.
Adjusted for seasonal factors and inflation (2005 chain-weighted dollars as used in reporting real GDP), the January, February and March 2010 respective merchandise trade deficits were $40.9, $42.3 (previously $42.5) and $43.8 billion (new), or an annualized quarterly rate in first-quarter 2010 of $508.3 billion, worse than the annualized fourth-quarter shortfall of $492.5 billion (previously $492.2). The GDP includes trade in services in addition to merchandise, and the first-quarter’s "advance" estimate of 3.2% annualized real GDP growth was a guesstimate, including deteriorating net exports based on two of three months of trade deficit. With the March deficit near consensus estimates, the net effect of the hard number on the May 27th first-quarter GDP revision should be neutral to slightly negative.
{[federal_deficit Federal Budget Deficit Deteriorates Despite Accounting Gimmicks.}}Federal Budget Deficit Deteriorates Despite Accounting Gimmicks. Just a year ago, the Monthly Treasury Statement of the monthly receipts and outlays (monthly fiscal deficit or surplus) for April 2009, announced, "TARP [the bailout package] purchases are now being accounted for on a net present value basis, taking into account market risk." That accounting knocked an immediate $175 billion off the already reported deficit and likely reduced the overall reported 2009 cash-based deficit by about $500 billion. Keeping the preceding in mind, here is how the latest numbers line up.
The rolling twelve-month "cash" deficit through April 2010 was $1.413 trillion, up 28.0% from the $1.104 trillion rolling deficit as of April 2009. The deficit for the fiscal year ended September 30, 2009 was $1.416 trillion.
In contrast, gross federal debt, per Treasury reporting, stood at $12.949 trillion as of April 30, 2010, up $175.6 billion from March 31, 2010, and up by $1.710 trillion from April 30, 2009. April 30, 2009 was up by $1.861 trillion from the year before. In the last two years, gross federal debt has grown by 38.1% or $3.571 trillion, against a "cash" deficit basis of just $2.517 trillion. Such is one of the wonders of a little gimmicked accounting.
Housing Starts (April 2010). April housing starts are due for release on Tuesday, May 18th. The bottom-bouncing of the last year or so should continue, with the reported month-to-month change not likely to be statistically meaningful but still to the downside of consensus expectations.
Producer Price Index — PPI (April 2010). The April PPI is due for release on Tuesday, May 18th. Seasonal factors will dampen the impact of higher oil prices in this regularly volatile series. Nonetheless, as the broader impact of higher oil prices spreads through the system, there likely will be some upside reporting risk to consensus forecasts.
Consumer Price Index — CPI (April 2010). The April CPI is due for release on Wednesday, May 19th. As with the PPI, seasonal factors will dampen the impact of higher gasoline prices. Still, as the broader impact of higher oil prices spreads through the system, there also likely will be some upside reporting risk to consensus forecasts.
Year-to-year CPI-U inflation would increase or decrease in April 2010 reporting, dependent on the seasonally-adjusted monthly change, versus the 0.09% adjusted monthly gain seen in April 2009. I use the adjusted change here, since that is how consensus expectations are expressed. To approximate the annual inflation rate for April 2010, the difference in April’s headline monthly change versus the year-ago monthly change should be added to or subtracted directly from March 2010’s annual inflation rate of 2.31%.
__________