No. 305: Economic Update, GDP Revision, Durable Goods
JOHN WILLIAMS’ SHADOW GOVERNMENT STATISTICS
COMMENTARY NUMBER 305
Economic Update, GDP Revision, Durable Goods
June 25, 2010
__________
69% of First-Quarter GDP Growth Was Inventory Build-Up
Annualized Final Sales Growth Slowed to 0.86%
Unusually Large Late-GDP Changes in
Advance of Next Month’s Annual GDP Revisions
Softer than Advertised "Recovery" Data Should
Accompany Onset of Renewed Downturn
__________
PLEASE NOTE: The next regular Commentary is scheduled for Friday, July 2nd, following the release of the June employment and unemployment reporting.
- Best wishes to all, John Williams
With hints of renewed economic weakness surfacing in the numbers, and as financial analysts increasingly have mentioned the possibility of a U.S. "double-dip" recession, the Fed began playing language games with its latest FOMC statement (June 23rd), which opened with:
"Information received since the Federal Open Market Committee met in April suggests that the economic recovery is proceeding and that the labor market is improving gradually. Household spending is increasing but remains constrained by high unemployment, modest income growth, lower housing wealth, and tight credit. Business spending on equipment and software has risen significantly; however, investment in nonresidential structures continues to be weak and employers remain reluctant to add to payrolls. Housing starts remain at a depressed level. Financial conditions have become less supportive of economic growth on balance, largely reflecting developments abroad [my italics]. Bank lending has continued to contract in recent months. Nonetheless, the Committee anticipates a gradual return to higher levels of resource utilization in a context of price stability, although the pace of economic recovery is likely to be moderate for a time."
The italicized text places blame for a negative shift in the economic environment — a shift unforeseen by the Fed — upon the sovereign solvency crisis in Europe. The Administration already is hinting also that European austerity measures could kill the U.S. economic "recovery." Such is nonsense; the problems are not abroad, but at home.
Decades of unsound U.S. fiscal, monetary, financial-regulatory and trade policies — policies known by the various Administrations, Congresses and Fed Chairmen to have been unsound but that catered to political and/or special-interest needs — have culminated in the current crises. The United States led the global financial system into the current systemic solvency crisis and into the current severe economic downturn.
Only politicians and Federal Reserve officials without viable options and Wall Street hypesters would claim that the current structural economic depression would be turned fundamentally by short-lived stimulus measures. The structural issues never were addressed. Now, as the structural fundamentals reassert themselves, it is the problems at home that still are at the base of the systemic woes.
As discussed in the Hyperinflation and Consumer Liquidity Special Reports, U.S. households suffer contracting real income. This is a structural issue that has evolved over decades as an offshoot of domestic trade policies. Where consumers accounted for 73.4% of the just-revised first-quarter 2010 GDP (including housing), sustained real economic growth — sustained positive real growth in personal consumption — is impossible without positive real growth in consumer income. Temporary economic growth can be generated with the debt expansion — as Mr. Greenspan encouraged when he was Federal Reserve Chairman — but the recent systemic solvency crisis has triggered a severe debt contraction.
The intensifying economic contraction has serious consequences that do not seem to have surfaced yet in financial-market concerns — consequences that are unexpected — including unexpected additional explosive growth in the federal deficit, an unexpected further surge in Treasury funding needs, and unexpected renewed solvency concerns for the banking system. Such conditions are not happy news for the U.S. equity or credit markets.
The broad outlook is unchanged. The economy still is in a particularly severe and protracted downturn. The consequences of that and the extreme fiscal abuses practiced by the U.S. government over decades promise a shift in global market concerns to the U.S. dollar, with an eventual massive flight from the U.S. currency and a U.S. inflation surge that should lead into hyperinflation. Over the long haul, those with dollar-denominated paper assets would do well to consider preserving their wealth and assets. Irrespective of possibly extreme near-term volatility in the various markets, gold, silver, stronger currencies (such as the Canadian and Australian dollars and Swiss franc) and assets outside the U.S. dollar and even outside the United States should be the best bets for accomplishing that long-term wealth preservation.
GDP-Related Definitions. For purposes of clarity and the use of simplified language in the following text, here are definitions of key terms used related to GDP reporting:
"Gross Domestic Product (GDP)" is the headline number and the most widely followed broad measure of U.S. economic activity. It is published quarterly by the Bureau of Economic Analysis (BEA), with two successive monthly revisions and with an annual revision the following July.
"Gross Domestic Income (GDI)" is the theoretical equivalent to the GDP, but it is not followed by the popular press. Where GDP reflects the consumption side of the economy and GDI reflects the offsetting income side. When the series estimates do not equal each other, which almost always is the case, the difference is added to or subtracted from the GDI as a "statistical discrepancy." Although the BEA touts the GDP as the more accurate measure, the GDI is relatively free of the monthly political targeting the GDP goes through.
"Gross National Product (GNP)" is the broadest measure of the U.S. economy published by the BEA. Once the headline number, now it rarely is followed by the popular media. GDP is the GNP net of trade in factor income (interest and dividend payments). GNP growth usually is weaker than GDP growth for net-debtor nations. Games played with money flows between the United States and the rest of the world tend to mute that impact on the reporting of U.S. GDP growth.
"Real" means growth has been adjusted for inflation.
"Nominal" means growth or level has not been adjusted for inflation. This is the way a business normally records revenues or an individual views day-to-day income and expenses.
" GDP Implicit Price Deflator (IPD)" is the inflation measure used to convert GDP data from nominal to real. The adjusted numbers are based on "Chained 2005 Dollars," at present, where the 2005 is the base year for inflation, and "chained" refers to the methodology which gimmicks the reported numbers so much that the total of the deflated GDP sub-series misses the total of the deflated total GDP series by nearly $40 billion in "residual" as of second-quarter 2010.
"Quarterly growth," unless otherwise stated, is in terms of seasonally-adjusted, annualized quarter-to-quarter growth, i.e., the growth rate of one quarter over the prior quarter, raised to the fourth power, a compounded annual rate of growth. While some might annualize a quarterly growth rate by multiplying it by four, the BEA uses the compounding method, raising the quarterly growth rate to the fourth power. So a one percent quarterly growth rate annualizes to 1.01 x 1.01 x 1.01 x 1.01 = 1.0406 or 4.1%, instead of 4 x 1% = 4%.
"Annual growth" refers to the year-to-year change of the referenced period versus the same period the year before.
The revisions in this report were unusually large for a third estimate — so late in the reporting cycle — and likely reflected efforts at positioning the first-quarter numbers in the upcoming annual GDP revisions, so as to have minimal revisions to the first-quarter growth patterns next month, when the "advance" estimate of second-quarter GDP is released along with the series revisions on July 30th.
Those revisions will restate GDP history back to first-quarter 2007, a period that encompasses the official timing for the recession being clocked from fourth-quarter 2007. Based on patterns of already-published revisions to other series — such as payroll employment — the revised GDP data likely will show weaker than previously reported growth. The new data should show a more severe downturn, a more shallow "recovery" and perhaps indications that the economic contraction started before fourth-quarter 2007.
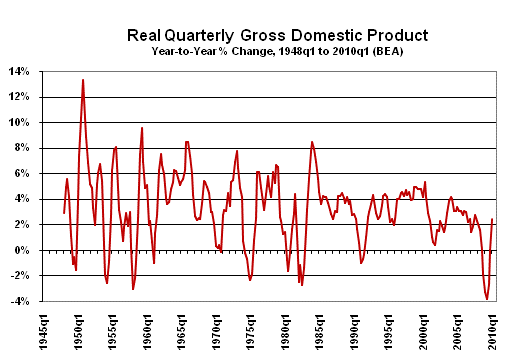
GDP. Published today by the Bureau of Economic Analysis (BEA), the third estimate (second revision) of first-quarter 2010 Gross Domestic Product (GDP) was estimated at an annualized real growth rate of 2.74% +/- 3% (95% confidence interval), versus the previous estimate of 3.04% and an initial estimate of 3.24%. Such followed a 5.55% annualized gain reported for fourth-quarter 2009 GDP. The year-to-year change in real first-quarter GDP revised to 2.42%, down from prior reporting of 2.50% and an initial estimate of 2.55%, versus an annual gain of 0.06% reported for the fourth-quarter.
A greater than previously reported build-up in inventories accounted for 1.88 percentage points of or 68.6% of the 2.74% total annualized GDP growth rate. Inventories built in excess of demand usually trigger inventory-balancing production cut backs in later quarters. Annualized real growth in first-quarter final sales, which is GDP net of the change in inventories, slowed to 0.86% in revision, down from 1.38% in previous reporting and down from 1.67% in initial reporting.
The GDP implicit price deflator — inflation measure — showed a revised annualized pace of inflation in first-quarter 2010 of 1.12% versus the previous estimate of 1.08% and an initial estimate of 0.88%, up from 0.50% in fourth-quarter 2009. In contrast, annualized inflation for the CPI-U in the first-quarter was 1.53% versus 2.62% in the fourth-quarter. The higher the inflation rate used in deflating the GDP, the weaker is the inflation-adjusted number.
The SGS Alternate-GDP estimate for first-quarter 2010 remains an approximate annual contraction of 1.5% versus the official estimate of a 2.4% gain, less-negative than the annual 4.6% contraction (0.1% official gain) estimated in the fourth-quarter. While annualized real quarterly growth is not formally estimated on an alternative basis, a small quarter-to-quarter contraction likely would have been realistic for the first-quarter. The relative upturn in annual change reflects the bottom-bouncing at low levels of activity seen for much of the last year in key underlying economic series, not an economic recovery. As discussed in the opening comments, an intensified downturn appears to be unfolding (see the Alternate Data tab).
The graph shows official year-to-year change. The "recovery" in year-to-year growth still reflects the nature of the protracted recent bottom-bouncing in the economy. The pattern should flatten out and turn negative, once again, in long-range revisions and in future quarters. While widely followed, the GDP series probably is the worst in quality and most heavily politicized of the major economic series. Reporting over the near-term largely is guesstimated and usually is targeted at consensus forecasts.
GNP. The second estimate of first-quarter Gross National Product (GNP) showed annualized real growth of 3.45%, down from initial reporting of 3.87%, and versus 5.05% in the fourth-quarter. Year-to-year growth revised to 2.62% from the initial estimate of 2.72%, and versus 0.42% in the fourth-quarter. Where GDP is GNP net of the trade balance in transfer payments (interest and dividend payments), the GNP continues suffering distortions from the effects of unusual capital flows in the global solvency crisis.
GDI. The Gross Domestic Income (GDI) underwent a massive upward revision from its initial estimate, reflecting an upwardly revised surge in reported corporate profits. The national income account estimates of corporate profits are so heavily massaged and modeled that they rarely reflect real world activity. The second estimate of GDI for first-quarter 2010 showed annualized real growth of 4.18%, revised from an initial estimate of 2.89%, and versus a fourth-quarter growth rate of 5.21%. Year-to-year change was 2.21% in the first-quarter, revised from initial reporting of 1.89%, versus a 0.84% annual contraction in the fourth-quarter.
The Census Bureau reported yesterday (June 24th) that the regularly volatile, seasonally-adjusted new orders for durable goods fell by 1.1% (1.0% net of revisions) in May, after a revised 3.0% (previously 2.9%) gain in April. Unadjusted, year-to-year change in May 2010 new orders was a gain of 15.3%, following a revised 21.5% (previously 21.6%) jump in April.
The decline in May new orders was more than accounted for by a 29.6% decline in new orders for nondefense aircraft and parts, which otherwise had spiked recent reporting (April orders were up by 215.7% from March). Given the high month-to-month volatility in and long lead-time for airplane orders, developments here are much longer-term in their implications on broad economic activity than are items such as new orders for automobiles (up 0.7% monthly for May).
The widely followed nondefense capital goods declined by 2.8%, seasonally-adjusted, for the month in May, after gaining a revised 8.2% (previously 9.2%) in April. Also heavily influenced by aircraft orders, the unadjusted year-to-year change in the series was up by 18.9% for May, a somewhat less-torrid pace than the revised April annual gain of 42.6% (previously reported at 43.4%). {{end}}
Employment/Unemployment (June 2010). As discussed in Wednesday’s Commentary No. 304, the layoffs of roughly 240,000 temporary and intermittent census workers will dominate the headline payroll employment change for June, due for release on Friday, July 2nd. Per Briefing.com, expectations still are for total jobs loss of 70,000 in June (implying a 170,000 jobs gain net of census), versus the census-job-spiked 413,000 gain of May (the May jobs gain net of census impact was 20,000). Expectations are for the unemployment rate holding at 9.7%.
Contrary to consensus forecasts, I look for June payrolls to contract net of the census impact, which would mean a reported total payroll decline of 250,000 or more versus current expectations of a 70,000 decline. Where a portion of the reported decline in the May unemployment rate to 9.7% from 9.9% in April was due to the census circumstance, an uptick in the June unemployment rate is a good bet. Given distortions in recent seasonal adjustments, and with reporting catch-up, the June unemployment rate could hit 10.0% or more.
In related reporting, the Conference Board’s May newspaper help-wanted advertising index, which leads June payrolls, held at 10 for the seventh straight month, off the record-low readings of 9 seen in September and October 2009. An updated assessment on the pending jobs and unemployment report will be published next week — before the release — as late numbers from other related economic series become available.
__________