No. 311: June Housing Starts
JOHN WILLIAMS’ SHADOW GOVERNMENT STATISTICS
COMMENTARY NUMBER 311
June Housing Starts
Housing Starts Show Bottoming-Bouncing
Approaching Renewed Decline
PLEASE NOTE: The next regular Commentary is scheduled for Wednesday, July 28th, after release of the June new orders for durable goods data. Included in that Commentary will be some assessment of the changes likely in the July 30th annual revisions to GDP. A Commentary on July 30th will follow the release of the "advance" estimate of second-quarter 2010 GDP and the annual GDP revisions, which will restate economic history back to the first-quarter 2007.
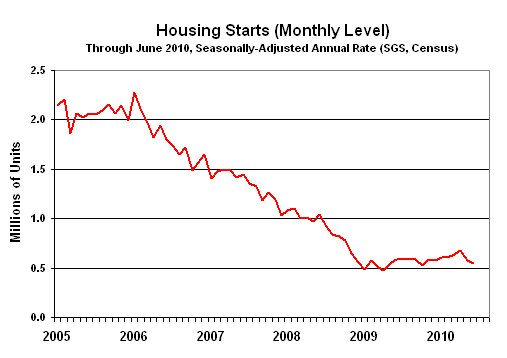
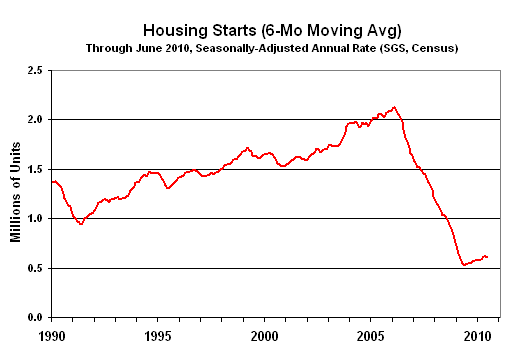
Year-to-year change in June was a statistically-insignificant contraction of 5.8% +/-12.3% (95% confidence interval), following a downwardly revised annual gain of 5.1% (previously 7.8%) in May. The recent variation in annual growth patterns is due to the collapsing and troughing (April 2009 was the trough) of data a year ago, combined with the ongoing extreme volatility seen in these data in the current contraction. Indeed, since December 2008, as noted, housing starts have been bottom-bouncing at an historically low level, averaging a seasonally-adjusted annual rate of 572,000. In the past 19 months, all monthly readings have been within the normal range of monthly volatility for the series around that average, including June 2010’s reading of 549,000. The "recovery" in housing is shown in the above graphs. The first graph reflects the level monthly of activity in terms of the annualized monthly rate of housing starts, which is randomly volatile and subject to large revisions on a monthly basis. For purposes of looking at the broader trend in activity — net of random and often extreme month-to-month reporting volatility seen in many series, and net of recent month-to-month seasonal factor distortions also common recently to many series — I have smooth the data for certain graphs using a six-month moving average, including retail sales, industrial production, new orders for durable goods and housing starts. The second graph shows the six-month moving average in housing starts. Irrespective of any level of smoothing, though, in the current cycle, housing starts remain at least 25% below any levels seen since before the end of World War II. Along with the activity in the broad economy, a renewed downturn in housing likely is underway. In response to a query and suggestions posed by a subscriber, I shall attempt to clarify my usage of the six-month moving average in graphs. There are different ways of showing the plot of a moving average. One is to plot it centered on the middle month of the average; another is to plot it using the last month in the average. I use the latter style, here, because, in the current instance, the six-month average through June includes June information that was not available as of March/April, the mid-point. Where the June average also includes the trailing five months of data back to January, however, this type of plot of the average will appear to lag the pattern of activity shown in coincident monthly data, when changes in monthly activity reflect more than random volatility (as seen in recent retail sales and industrial production reporting). The recent bottom bouncing in housing starts has tended more to be a pattern of random volatility. I hope this clarifies what is shown with the six-month moving-average graphs and welcome any questions or comments: johnwilliams@shadowstats.com.

Home Sales (June 2010). Due for release on Thursday, July 22nd (existing), and on Monday, July 26th (new), home sales should continue to show depressed levels in the wake of the home buyer tax credit expiration. Beyond the hits that will provide a one-shot lowering in the levels of home sales, patterns of bottoming-bouncing should continue, quickly falling into a renewed downtrend that will tend to confirm slowing broad activity in the months ahead. Keep in mind that the month-to-month change in new home sales rarely is statistically significant, and market distortions from heavy foreclosure rates continue as a major impairment to getting data that indicate actual underlying market conditions.
Consumer Confidence and Sentiment (July 2010). Unexpected weakness in the preliminary University of Michigan Consumer Sentiment number for July was given credit for roiling the markets last Friday. That particular number has little statistical meaning, given the limited surveying behind it. Nonetheless, given an increasing number of stories in the popular media on the slowing economy, some drop in the monthly numbers for July is a reasonable expectation for both the Conference Board’s Consumer Confidence (Tuesday, July 27th) and full-month Consumer Sentiment (Friday, July 30th) measures. Given seasonal adjustments to the Conference Board numbers (seasonal factors are not disclosed), a surprise always is a possibility.
New Orders for Durable Goods (June 2010). Due for release on Wednesday, July 28th, June new orders for durable goods can go either way, given the random volatility of the series. Boeing’s big pick-up in orders at the air show in Farnborough, England, however, should show up as a healthy spike in next month’s reporting of July orders.
Gross Domestic Product — GDP (Second-Quarter 2010 "Advance Estimate" and Annual Revisions). Early consensus estimates appear to be for some relative pick-up in annualized quarterly real (inflation-adjusted) growth in the largely guesstimated "advance" second-quarter GDP, due for release on Friday, July 30th. As discussed in the prior Commentary No. 310, a slower growth rate would be consistent with recent underlying economic reporting. An analysis of likely revisions will follow in the Commentary scheduled for July 28th. A pattern of generally weaker than previously-reported economic growth is a good bet for the revisions.