No. 317: July Housing Starts, Production and PPI
JOHN WILLIAMS’ SHADOW GOVERNMENT STATISTICS
COMMENTARY NUMBER 317
July Housing Starts, Production and PPI
August 17, 2010
__________
July Housing Starts Below Initial June Reporting,
Suggestive of Third-Quarter GDP Contraction
July Industrial Production Boosted by Seasonal Disruptions
Annual PPI Inflation Rose to 4.2% in July
__________
PLEASE NOTE: The next regular Commentary is scheduled for Wednesday, August 25th, following release of July New Orders for Durable Goods, along with analyses of New and Existing Home Sales data.
– Best wishes to all, John Williams
Economic reporting in the months ahead increasingly should confirm this pattern, with reporting of business statistics generally coming in below consensus estimates.
July Housing Starts Indicate Third-Quarter Contraction. The Census Bureau reported a soft July 2010 residential construction report for housing starts, today (August 17th). The small monthly gain would have been a contraction but for a large downward revision to June’s initial reporting. Further, the July housing starts level was below the average level for the second-quarter, suggesting, as with last week’s real retail sales, the potential of a third- versus second-quarter contraction that should be paralleled in related GDP components.
As reported, July housing starts rose by a statistically-insignificant 1.7% (down by 0.5% net of revisions) +/- 8.2% (95% confidence interval). June’s starts were revised to an 8.7% (previously 5.0%) monthly decline. Activity has started to slow, anew, although the pattern of housing starts generally remains one of bottom-bouncing at an historically low-level plateau of activity, as seen over the last 20 months. Much weaker monthly numbers are likely in the months ahead.
Year-to-year change in July was a statistically-insignificant contraction of 7.0% +/-8.1% (95% confidence interval), following a downwardly revised annual drop of 7.9% (previously 5.8%) in June.
Since December 2008, as noted, housing starts have been bottom-bouncing at an historically low level, averaging a seasonally-adjusted annual rate of 570,600. In the past 20 months, all monthly readings have been within the normal range of monthly volatility for the series around that average, including July 2010’s reading of 546,000.


The "recovery" in housing is shown in the above graphs. The first graph reflects the level monthly of activity in terms of the annualized monthly rate of housing starts, which is randomly volatile and subject to large revisions on a monthly basis.
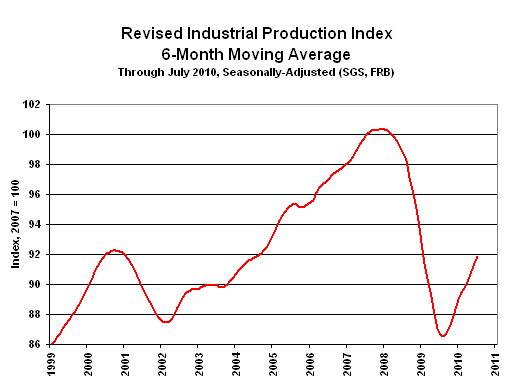
For purposes of looking at the broader trend in activity — net of random and often extreme month-to-month reporting volatility seen in many series, and net of recent month-to-month seasonal factor distortions also common recently to many series — I have smoothed the data for certain graphs using a six-month moving average, including retail sales, industrial production and housing starts.
The second graph shows the six-month moving average in housing starts, which has turned down in the latest reporting. Irrespective of any level of smoothing, though, in the current cycle, housing starts remain at least 25% below any levels seen since before the end of World War II. Along with the activity in the broad economy, a renewed downturn in housing appears to be underway.
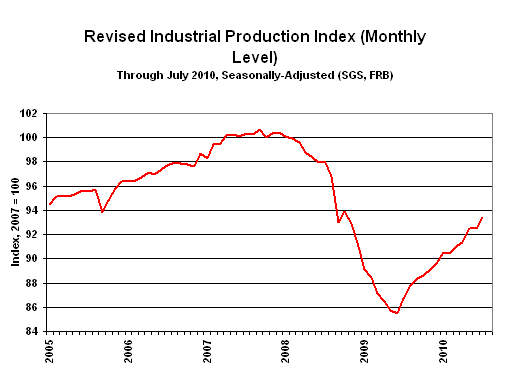
Auto Industry Disruptions Boosted July Industrial Production with Warped Seasonal Factors. The irregular patterns in U.S. auto production in the last two years from insolvencies and pending insolvencies with GM and Chrysler, and from collapsing economic activity, have resulted in a relative economic boom for the seasonally-adjusted auto industry, which was the primary driver of a 1.0% monthly gain in seasonally-adjusted July industrial production, which shrank by 1.0% before seasonal adjustments. Surprisingly, despite extremely unseasonable weather across the country, seasonally-adjusted utility usage was up just 0.1%, not a major factor in the aggregate change. Prior-period revisions boosted reporting by 0.1% from what would have been seen otherwise
Unlike July’s real retail sales and housing starts, July industrial production was higher than the second-quarter average, at an annualized pace of 5.9%. While such is relatively good news for third-quarter GDP, it is at a slower pace than the second-quarter’s 6.7% annualized growth, and there is good reason to expect downside movement in the production series in the months ahead.
The Federal Reserve Board reported today (August 17th) that seasonally-adjusted June 2010 industrial production rose by 0.99% (up by 0.94% before revisions to June’s initial reporting), versus a 0.05% contraction (previously a 0.07% monthly gain) reported for June.
The year-to-year change in July production eased back to 7.74% from June’s revised 8.16% (previously 8.22% pace). The relatively high level in annual growth is due largely to the pattern of collapsing activity a year ago, which troughed in June 2009. After last month’s benchmark revision, the deepest year-to-year decline seen in the current cycle was a year-to-year contraction of 12.86% for May 2009 (previously a decline of 13.31% in June 2009). The May 2009 drop was the steepest annual decline in production growth since the shutdown of war-time production following World War II.


The first graph above shows recent monthly detail, with a fair chance that the August number will mark the turning point to renewed decline in the production series.
The "recovery" in production is shown in the second graph, where month-to-month volatility is smoothed using a six-month moving average. For the last 19 months, the production index has averaged 89.17, around which the series has been fluctuating, with July’s six-month moving average reading at 91.87 versus 93.40 for the single month. Production activity had leveled off at a low-level plateau of activity that effectively wiped out the last eight years of growth in industrial production; the current rally almost has reclaimed the pre-2001 recession high.
Despite the near-term upside gains generated by short-lived stimulus and seasonal-factor distortions, the series likely still is bottom-bouncing and should begin to soften anew, significantly, in the next several months. The six-month moving-average series remains 9.15% below its December 2007 historic high.
July PPI Inflation Hit by Negative Seasonal Factors for Gasoline. Seasonally-adjusted inflation at the wholesale and production rose month-to-month in July, slightly above expectations, despite energy prices again being suppressed by seasonal adjustments. Those adjustments usually start turning sharply to the plus-side for energy prices at this time of year.
As reported this morning (August 17th) by the Bureau of Labor Statistics (BLS), the regularly-volatile, seasonally-adjusted finished-goods producer price index (PPI) in July rose by 0.2% (up by 0.3% before seasonal adjustment) month-to-month, following June’s decline of 0.5% (down 0.6% unadjusted).
Unadjusted and year-to-year, July’s annual PPI inflation rose to 4.2%, up from an annual inflation rate of 2.8% reported for June.
On a monthly basis, seasonally-adjusted July intermediate goods fell by 0.4% (down by 0.9% in June), with July crude goods rising by 2.7% (down by 2.4% in June). Year-to-year inflation in July intermediate goods was up by 6.4%, the same as in June, with July annual inflation in crude goods up by 20.5% (up by 13.3% in June).
Week Ahead. Given the unfolding reality of a weaker economy (or re-intensifying downturn) and more serious inflation problems than generally are expected by the financial markets, risks to reporting will tend towards higher-than-expected inflation and weaker-than-expected economic reporting in the months ahead. Increasingly, that is being seen in economic reporting net of prior-period revisions.
Home Sales (July 2010). July Existing Home Sales due for release on Tuesday, August 24th, and New Home Sales due for release on Wednesday, August 25th, are both at risk of disappointing already-soft market expectations. As discussed in earlier Commentaries, both series are distorted meaningfully by the foreclosure debacle, and any change in the heavily volatile new home sales category is likely to be statistically insignificant.
New Orders for Durable Goods (July 2010). Due for release on Wednesday, August 25th, July new orders should show a solid spike, due to strong, multi-year aircraft orders. Net of aircraft orders — which likely will not have immediate impact on the near-term economy — the other randomly volatile data have a fair chance of being weaker than already-soft expectations.
Gross Domestic Product — GDP (Second-Quarter 2010, Second Estimate). Due for release on Friday, August 27th, the second estimate (first revision) to second-quarter 2010 annualized real GDP growth faces an unusually large downward revision, from initial reporting of 2.4% to 1.4%, per the consensus estimate at Briefing.com. Realistically, the quarter should have been flat-to-minus, but the downside impact of sharply weaker June trade data and some expectation of lowered inventory levels on official reporting may be overdone. A downside revision is a good bet, but I’d look for something closer to a revised growth level of 1.8%, given the propensities of the Bureau of Economic Analysis to offset inventory changes with adjustments to consumption.
__________