No. 335: GDP Revision, October Durable Goods Orders and Home Sales
COMMENTARY NUMBER 335
GDP Revision, October Durable Goods Orders and Home Sales
November 24, 2010
__________
GDP at 2.5% But "Equivalent" GDI at 1.6%
Weaker Durable Goods Orders Reflect Stressed Consumer
Home Sales Weakness Intensified by Systemic-Solvency Issues
__________
PLEASE NOTE: The next regular Commentary will be on Friday, December 3rd, following release of November employment and unemployment reporting. An interim Commentary will update the outlook for that release.
– Best wishes to all for a Happy Thanksgiving! — John Williams
Signs of mounting consumer problems, however, were suggested in other reporting of the last several days. Greater-than-expected weakness in October new orders for durable goods was seen largely in categories dominated by consumer buying. Likewise, October home sales continued to reflect constrained consumer liquidity — on both an income and credit front — with suggestions of some of the restricted consumer lending being tied directly to bank solvency issues as opposed to being just a matter of consumer credit worthiness.
The general outlook as discussed in Special Commentary No. 333 has not changed. The release of November labor market numbers next week will be the first major economic report on November, and the broad economic outlook will be reviewed in the Commentary at that time.
GDP-Related Definitions. For purposes of clarity and the use of simplified language in the following text, here are definitions of key terms used related to GDP reporting:
"Gross Domestic Product (GDP)" is the headline number and the most widely followed broad measure of U.S. economic activity. It is published quarterly by the Bureau of Economic Analysis (BEA), with two successive monthly revisions and with an annual revision the following July.
"Gross Domestic Income (GDI)" is the theoretical equivalent to the GDP, but it is not followed by the popular press. Where GDP reflects the consumption side of the economy and GDI reflects the offsetting income side. When the series estimates do not equal each other, which almost always is the case, the difference is added to or subtracted from the GDI as a "statistical discrepancy." Although the BEA touts the GDP as the more accurate measure, the GDI is relatively free of the monthly political targeting the GDP goes through.
"Gross National Product (GNP)" is the broadest measure of the U.S. economy published by the BEA. Once the headline number, now it rarely is followed by the popular media. GDP is the GNP net of trade in factor income (interest and dividend payments). GNP growth usually is weaker than GDP growth for net-debtor nations. Games played with money flows between the United States and the rest of the world tend to mute that impact on the reporting of U.S. GDP growth.
"Real" means growth has been adjusted for inflation.
"Nominal" means growth or level has not been adjusted for inflation. This is the way a business normally records revenues or an individual views day-to-day income and expenses.
" GDP Implicit Price Deflator (IPD)" is the inflation measure used to convert GDP data from nominal to real. The adjusted numbers are based on "Chained 2005 Dollars," at present, where the 2005 is the base year for inflation, and "chained" refers to the methodology which gimmicks the reported numbers so much that the total of the deflated GDP sub-series misses the total of the deflated total GDP series by nearly $40 billion in "residual" as of second-quarter 2010.
"Quarterly growth," unless otherwise stated, is in terms of seasonally-adjusted, annualized quarter-to-quarter growth, i.e., the growth rate of one quarter over the prior quarter, raised to the fourth power, a compounded annual rate of growth. While some might annualize a quarterly growth rate by multiplying it by four, the BEA uses the compounding method, raising the quarterly growth rate to the fourth power. So a one percent quarterly growth rate annualizes to 1.01 x 1.01 x 1.01 x 1.01 = 1.0406 or 4.1%, instead of 4 x 1% = 4%.
"Annual growth" refers to the year-to-year change of the referenced period versus the same period the year before.
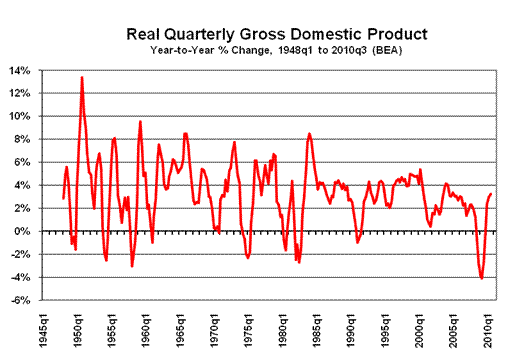
GDP — The Detail. The "second" estimate or first revision of third-quarter 2010 Gross Domestic Product (GDP) showed a revised but still statistically-insignificant annualized real growth rate of 2.53% (initially 2.01%) +/- 3% (95% confidence interval), up from an estimated 1.72% in the second-quarter. The year-to-year change in real third-quarter GDP revised to 3.24% (previously 3.11%), up from 3.00% in the second quarter.
The following graph shows the annual percent change in inflation-adjusted quarterly GDP for the history of the series. The record annual contraction for the series was 4.11%, seen in second-quarter 2009.
The GDP implicit price deflator was estimated at an annualized pace of 2.21% (revised from 2.17%) inflation for third-quarter 2010, up from 1.96% in the second-quarter. In contrast, annualized seasonally-adjusted quarterly inflation for the CPI-U in the third-quarter spiked to 1.47%, following a 0.72% contraction in the second-quarter. The lower the inflation rate used in deflating the GDP, the stronger will be the inflation-adjusted number and vice versa.
The SGS Alternate-GDP estimate for third-quarter 2010 remains an approximate annual contraction of 1.4% versus the official estimate of a 3.2% gain, more-negative than the alternate 1.3% annual contraction (3.0% official gain) estimated in the second-quarter (see the Alternate Data tab). While annualized real quarterly growth is not estimated formally on an alternative basis, a flat-to-minus quarter-to-quarter change still appears to have been realistic for the second-quarter. The recent relative upturn in annual change reflects the bottom-bouncing at low levels of activity seen for much of the last year in key underlying economic series, not an economic recovery. As discussed in Special Commentary No. 333 an intensified downturn, now in the form of a double-dip recession, continues to unfold.
GNP. Before adjusting GDP for trade in factor income, initial reporting of the third-quarter GNP (Gross National Product) showed real annualized quarterly growth of 2.33% versus 1.81% in the second-quarter. Year-to-year change in the third-quarter was 3.35% versus 3.43 in the second-quarter.
GDI. As mentioned in the opening comments, initial reporting of the third-quarter 2010 GDI, the income-side equivalent to the consumption-side GDP, was reported with annualized real quarter-to-quarter of 1.61%, instead of the 2.53% reported for the GDP. Such was against revised annualized quarterly growth in the second quarter of 2.70% (previously 1.30%). Year-to-year change in the third-quarter was 3.76% versus a revised 3.35% (previously 2.99%) in the second-quarter.
One of the larger factors accounting for the irregular volatility in this series remains commercial airplane orders. While such orders accounted for the bulk of the growth in September’s durable goods orders, and were revised higher with October reporting, October airplane orders remained near September levels. Accordingly, the decline reported in October’s orders — enhanced somewhat by the relative upward revisions in September’s previously-reported orders — reflected heavy declines in orders for appliances (see homes sales) and in computer and electronic products.
The widely followed nondefense capital goods orders fell by 4.5% (down 1.5% before prior-period revisions) in October, versus a revised monthly gain in September of 11.7% (previously up by 8.6%). For October, the unadjusted year-to-year change in the series was 24.5%, versus a revised 30.6% (previously 27.0%) gain in September.
Such is anecdotal evidence of a continuing solvency crisis in the banking system, which remains the most likely reason for the Fed’s pre-emptive debasement of the U.S. dollar by monetizing U.S. Treasury debt, the so-called "QE2," as discussed in Special Commentary No. 333.
Indeed, a liquidity crisis — inadequate income and constrained credit — remains in play for many potential home buyers. That condition, in conjunction with low consumer confidence, still holds no near-term prospect of helping to boost broad economic activity. Instead, liquidity-constrained consumers likely still will not fuel sustainable economic growth, further impairing broad personal consumption and residential construction and sales. New orders for durable goods, which usually benefit from home sales activity (appliance sales, etc.) in more-positive times, also should continue to be impacted negatively.
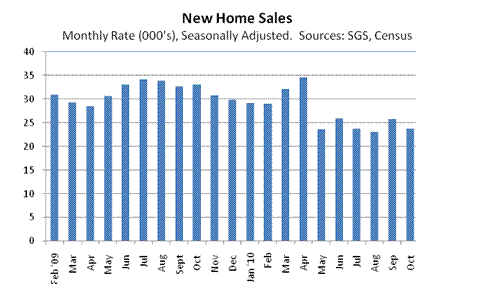
Today’s (November 24th) reporting of October new-home sales (counted based on contract signings, Census Bureau) showed a statistically insignificant monthly decline of 8.1% (down 7.8% before prior period revisions) +/- 18.8% (95% confidence interval) from September. September showed a revised 12.0% (previously 6.6%) monthly gain, due to a sharp downward revision to August’s reporting. The year-to-year decline in the new home sales series in October 2010 deepened to 28.5% from a revised 21.2% (previously 21.5%) decline in September.
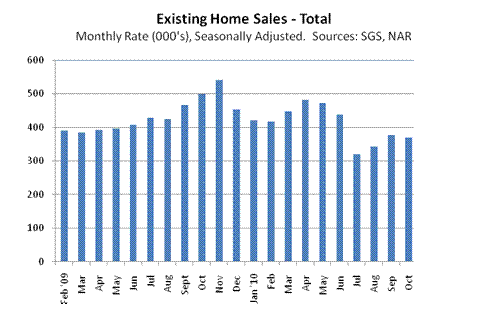
Tuesday’s (November 23rd) release of October existing-home sales (counted based on actual closings, National Association of Realtors [NAR]) showed a 2.2% decline in monthly activity versus September, which was up an unrevised 10.0% from August. The October level of activity remained near historically-low levels. On a year-to-year basis, October sales fell by 25.9% against October 2009, with September sales down by 19.1% from the year before.
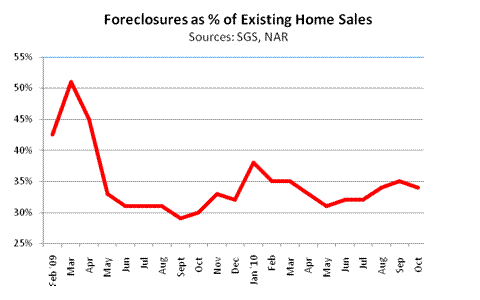
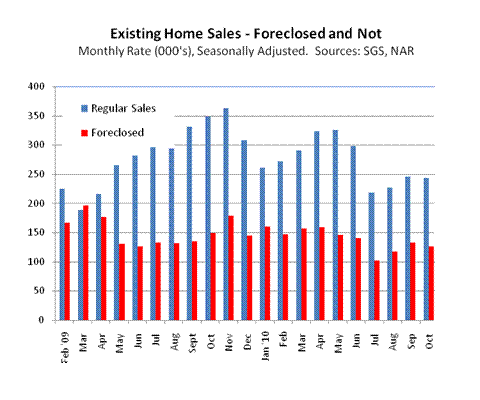
Foreclosure activity remained a major distorting factor for home sales, with "distressed" activity accounting for an estimated 34% of existing sales in the NAR’s October reporting, back to August’s level, after a spike to 35% in September. Short-lived foreclosure moratoriums appear to be coming into play.
Separately, the Census Bureau acknowledges that a portion of new home sales also is from foreclosure activity but offers no estimates as to the scope of the issue. Some in the construction trade have difficulty competing with the pricing of foreclosed properties. Until the foreclosure problems get worked out in the system, monthly changes in these home sales numbers cannot be taken as meaningful positive indicators (when the numbers are positive) of underlying activity in homeowner real estate, as it relates to general economic activity.
The following updated graphs reflect different measures of home sales activity since February 2009. The numbers, through October 2010, reflect the seasonally-adjusted level of monthly sales, rather than the annual rates usually published by the industry.
Payroll Employment, Unemployment Rate (November 2010). Due for release on Friday, December 3rd, both the change in nonfarm payrolls (especially net of revisions) and the level of the headline U.3 unemployment are at high risk of showing outright contractions economic activity and in disappointing what likely will be reasonably positive consensus forecasts. Such is based on what appears to be a still-unrecognized intensifying downturn in broad economic activity. This outlook will be revised in a Commentary before the scheduled data release, as consensus the outlook firms, and as reporting of related economic series become available.
__________