No. 342: Economic, Market and Systemic Outlook for 2011
SPECIAL COMMENTARY NUMBER 342
Economic, Market and Systemic Outlook for 2011
December 30, 2010
__________
2010: A Year of Depressed Economic Stagnation
2011: A Year of Increasing Economic and Systemic Difficulties
Gold Outperforms Dow for Seventh Straight Year (2010)
__________
PLEASE NOTE: The next regular Commentary is planned for Friday, January 7th, following release of December payroll employment and unemployment release.
Best Wishes for a Happy, Healthy and Prosperous New Year!
– John Williams and the ShadowStats.com staff
SUMMARY OUTLOOK
Nothing has changed fundamentally to improve the outlook for the U.S. economy. It remains in a protracted downturn that has started to deepen anew and that shows no signs of sustainable economic recovery in the year ahead. Due to spikes in certain business activity from short-lived stimulus effects, the National Bureau of Economic Research (NBER) declared June 2009 to be the end of the recession, so what now is unfolding eventually should gain recognition as a double-dip recession, with the second dip likely having commenced in the August to October 2010 period. The comments here both supplement and update Special Commentary No. 333 and, as general background, the fundamentals discussed in the Hyperinflation Special Report, which is due for a full update in the month ahead.
Even allowing for consumer spending absorbing the temporary cut in Social Security tax withholdings, the economy in 2011 should remain much weaker than generally is expected, with ongoing negative implications for systemic solvency, for the federal budget deficit and for U.S. Treasury fundings. Such also implies a likely accelerating expansion of the Federal Reserve’s "quantitative easing," reflecting active monetization of U.S. Treasury debt and debasement of the U.S. dollar.
The Fed has to have a fair sense of its abilities and inabilities by this point of time. It always can force an economic downturn by contracting broad liquidity, but its ability to expand the economy is problematic. It always can create inflation by debasing the U.S. dollar, but bringing inflation under control can be quite difficult when the inflation is not driven by strong economic demand. The inflation being pursued by the Fed, at present, is of the "difficult" kind. The nascent inflation is driven by distorted monetary policy, with resulting foreign-exchange weakness in the U.S. dollar and upside pressure on dollar-denominated prices for certain commodities, such as oil. Here, the higher prices do not reflect increasing economic demand.
As demonstrated in actions of the last several years, the U.S. Treasury, and particularly the independent Federal Reserve, will do anything, spend or create any amount of money necessary, in order to prevent a collapse of the financial system in the United States. The Fed and the Treasury actions since 2007 bought some temporary stability, but they did not revitalize or heal the system, and the risk of a systemic collapse remains high (hence the proactive dollar debasement efforts by the Fed).
All these factors favor an environment that should see significant selling of the U.S. dollar — eventually an outright dumping of the U.S. dollar and dollar-denominated paper assets — and the onset of an increase in consumer inflation that likely will open the door to hyperinflation. Risks are particularly high of this dollar selling and early consumer inflation pressures breaking by mid-2011. The outside timing remains 2014. Keep in mind that the inflation outlook described here is defined in terms of prices for consumer goods and services. Some analysts are arguing at present for deflation in the near future. Where they are looking at an asset deflation, such as a stock market sell-off, such is not inconsistent with this outlook.
In the ongoing dollar debasement process, the U.S. equity, credit, currency and commodity (including precious metals) markets can be highly unstable and likely will be quite volatile, particularly when central banks try to affect activity. Looking at the long-term, though, strategies aimed at preserving wealth and assets continue to make sense. For those who have their assets denominated in U.S. dollars, physical gold and silver remain primary hedges, as do stronger currencies such as the Canadian and Australian dollars and the Swiss franc, which recently broken parity with the U.S. dollar, again. Holding assets outside the United States also likely will have benefits.
The Economy. Since plunging from late-2007 into early-2009, the U.S. economy largely has been bottom-bouncing at a low level of activity, with 2010 being a year of depressed stagnation for key series such as employment and housing (see Commentaries: No. 337 for employment, No.341 for housing), series which appear to be turning down, again. The relative strength seen in series such as retail sales and industrial production (see Commentary No.339) likely will prove fleeting in the months ahead, particularly as benchmark revisions reduce the levels of previously indicated economic activity and as reported economic activity in those areas begins to falter anew.
The problem with the economy remains structural, where household income is not growing fast enough to beat inflation, and where debt expansion — encouraged for many years by former Fed Chairman Alan Greenspan as a way to get around the economic growth problems inherent from a lack of income growth — generally is not available, as a result of the systemic solvency crisis. Accordingly, individual consumers, who account for more than 70% of the gross domestic product (GDP), do not have the ability, and increasingly lack the willingness, to fuel the needed growth in consumption, on which the U.S. economy is so dependent.
Although viewed by many as leading indicators to consumer activity (I contend they are more coincident or lagging), the most popular consumer confidence numbers are suggestive of a renewed economic downturn. The Conference Board’s Consumer Confidence measure, which is seasonally adjusted, is plotted in the following graph through December 2010 reporting. The pattern here shows bottom-bouncing after the economic crash. The bold line has been smoothed with a six-month moving average, in order to reduce the month-to-month volatility. Monthly data are plotted with the thin line. The pattern seen here is closest to the patterns seen in payroll employment and housing starts

The second graph plots the University of Michigan’s Consumer Sentiment measure, through November 2010, and is plotted in the same manner as the consumer confidence number, but the sentiment measure is not seasonally adjusted. The sentiment measure shows a pattern more reminiscent of the retail sales and industrial production patterns of activity. If this series were a leading indicator to retail sales for example, then the retail sales series would be expected to turn lower in the not-too-distant future.

Ongoing Market Hype and Reliance on Meaningless Numbers. Not widely recognized, most media hype on economic reporting usually focuses on changes in data that consistently are worthless, standalone numbers. Often, published statistical confidence intervals show the reported changes to be statistically insignificant, or, as seen increasingly in recent months, the reporting of certain numbers has been warped by the unusual nature of economic weakness.
This morning’s hype over a sharp drop in weekly new claims for unemployment to a "two year low" is typical of the misdirection frequently promoted by Wall Street shills trying to show an economic recovery at hand, where there is none to be had. As has been discussed in numerous Commentaries, the Department of Labor seasonally adjusts these numbers, but the results around holiday periods (in this case Christmas) rarely, if ever work well. As a result, unexpectedly large swings are typical in the weekly numbers around holidays, with offsetting movement usually seen in subsequent reporting.
From the standpoint of statistical significance, quarterly GDP and monthly housing starts and new home sales rarely show gains that are statistically distinguishable from contractions, and vice versa. The same often is true with changes in monthly nonfarm payrolls and in the unemployment rate.
Unique to the current period, however, are the severe data distortions created by the deepest and most-protracted economic downturn post-World War II, the most intense economic contraction in the history of modern economic reporting. As discussed in Commentaries No.339 and No. 337 the extraordinary disruptions to the normal flow of commerce in the United States have so warped seasonal-adjustment factors as to cast serious doubt on the significance of key reporting, ranging from payrolls to retail sales and industrial production. Separately, the recent high level of business failures cannot be accommodated within the standard surveying assumptions and reporting adjustments used with series such as payrolls, new orders for durable goods, retail sales, etc., with the effect of overstating reported economic activity.
Accordingly, in 2011, look for meaningful benchmark revisions to various series. Those numbers should tend to show that economic activity in the last year or two has been weaker than previously reported. In particular, watch for the benchmark revisions in payroll employment (February 4th), industrial production (month of March), GDP (July 29th) and retail sales (timing not available).
Systemic Risk. If the U.S. financial system were healthy and no longer at risk of collapse, banks would be lending increasing amounts of money into the normal stream of commerce, the money supply would be growing, and the Fed would not be monetizing federal debt. Instead, despite the Fed pumping extraordinary amounts of cash into the system, bank lending for consumer credit and commercial and industrial loans still is contracting month-to-month and year-to-year, due at least partially to impaired balance sheets at a number of banks. Broad money supply, as measured by the SGS-Ongoing M3 estimate has been contracting year-to-year for more than a year, and while the monthly change had flattened out and started moving higher in May 2010, November and an early approximation on December levels suggest a resumption of month-to-month decline. Early December reporting suggests that all three money supply measures displayed below (through November 2010) will show weaker or more-negative patterns of year-to-year change in December than they did in November. These factors are symptomatic of ongoing systemic solvency issues.

The weakening in broad money growth is despite the initial Treasury-debt monetization in the second round of "quantitative easing."

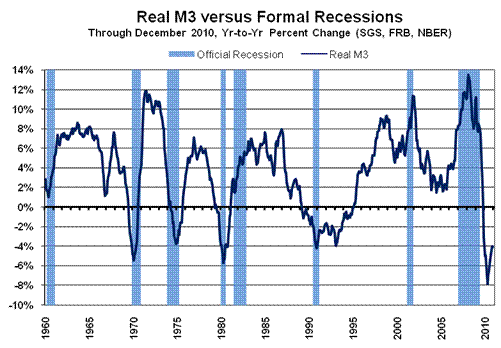
As shown in the preceding graph, the signal for an intensified downturn, given a year ago by the year-to-year change in real (inflation-adjusted) M3, remains in place. The background here was discussed most recently in Commentary No.339. The economy has started to slow again, with an early hit likely being seen in the real estate market, nonfarm payrolls and industrial production. Such is ongoing bad news for the banking system and is likely to intensify the systemic solvency crisis in the year ahead.
The Markets. Continued deterioration in the worst economic contraction since the Great Depression and ongoing instabilities in the financial system, along with an ineffective Fed doing its best to flood the system with liquidity in an effort to salve the system and to create inflation, are not happy news for the traditional U.S. financial markets in 2011.
Market fears of rising U.S. consumer prices already have affected interest rates, currencies and precious metals, with the price of gold outperforming the Dow Jones Industrial Average (DJIA) for the seventh year in a row, barring extraordinary market movements tomorrow, December 31st. Based on December 30, 2010 closing prices (London afternoon fix for gold — Kitco.com), the price of gold gained 29.2% versus 11.1% for the DJIA, this year. For the full-year 2009, gold gained 25.0% versus 18.8% for the DJIA, the same numbers respectively: for 2008 were 4.3% versus -33.8% ; for 2007 were 31.9% versus 6.4%; for 2006 were 23.2% versus 16.2%; for 2005 were 17.8% versus -0.6%; for 2004 were 4.6% versus 3.1%. In 2003, gold was up by 19.9%, but that was topped by a 25.3% gain in the Dow.
A day shy of year’s end, the S&P 500 was up by 12.8%, the Wilshire 5000, up by 15.8% and the NASDAQ Composite up by 17.4%. Again gold was up by 29.2% and silver up by 80.7%. On the currency front for the year, against the U.S. dollar, the Japanese yen gained 14%, the Australian dollar gained 13%, the Swiss franc gained 10% and the Canadian dollar rose by 5%. The euro and the British pound fell respectively by 7% and 5% versus the U.S. currency.
As the markets in the New Year deal with the extremely negative fundamentals for stocks and bonds, highly unstable conditions are likely. Again, at some point, extremely negative underlying fundamentals will catch up with the U.S. dollar. Relative currency exchange rates tend to reflect relative economic strength, trade deficit, inflation, interest rates, fiscal stability and political stability. All of those areas already are negative for the United States versus most of its major trading partners, and relative U.S. conditions are likely to deteriorate further in the year ahead.
Employment/Unemployment (December 2010) – The December payroll employment and unemployment reports are due for release on Friday, January 7th. As this Commentary is posted, Briefing.com is suggesting consensus forecasts of a total nonfarm payroll gain of 111,000 versus a 39,000 jobs gain reported for November, with unemployment holding at November’s level of 9.8%.
Generally, I would expect the numbers to be weaker than consensus, where the consensus seems to be embracing — at least temporarily — expectations of a developing recovery. During the first-quarter of 2011, those expectations should begin to shift rapidly back towards a double-dip recession. The 95% confidence interval for payroll change is +/- 129,000, which encompasses the consensus, so a contraction of 28,000 would be within the consensus range with the confidence interval.
Given that the annual payroll benchmark revision (a large downside revision already has been estimated by the BLS) is due with the January 2011 payroll release on February 4th, the BLS likely will massage the initial reporting of the December 2010 number so that it does not show significant month-to-month revision in the benchmark reporting. If so, that should add downside pressure on the upcoming monthly payroll number.
The December unemployment rate is anyone’s guess, since the annual seasonal-adjustment revisions to that series also will be published (the unadjusted unemployment rate does not get revised except for population re-estimates). December’s seasonally-adjusted headline U.3 unemployment will be estimated in the context of those revisions, where unemployment patterns can be shifted within the year. Odds favor some shifting of the adjusted unemployment into more recent reporting. If that happens, chances for an increase in the December versus November U.3 unemployment are reasonably good. The broader U.6 and SGS-Alternate unemployment should continue to increase.
Any significant patterns that arise in the reporting of related series — prior to next Friday’s release — will be discussed in a brief Commentary before the labor numbers are published.
__________