No. 345: December Inflation, Retail Sales, Production
COMMENTARY NUMBER 345
December Inflation, Retail Sales, Production
January 14, 2011
__________
Monthly December Inflation Surged (Annualized Rates):
CPI-U Gained 6.2%, CPI-W Jumped 7.8%, PPI Soared 14.0%
December Retail Sales Increase Was Due to Price Increases
Industrial Production Was Spiked by Unseasonable Weather
Initial Trade Deficit Should Help 4th-Quarter GDP
__________
PLEASE NOTE: The next regular Commentary is planned for Wednesday, January 19th, following release of the December 2010 Residential Construction (Housing Starts) data.
– Best wishes to all, John Williams
There is little happening here that I have not written about recently (see for example Special Commentary No. 342). Since I am traveling and am heavily under the weather with a seasonal malady, this morning’s comments will be brief, but the inflation issue will be reviewed in the pending update to the Hyperinflation Special Report and supplements to same.
In the economy, it looks like the "advance" fourth-quarter GDP (January 28th) will be positive, given the numbers discussed below. Significantly, though, major negative revisions to data, such as payrolls and production, loom post-GDP reporting. As to retail sales, keep in mind that the December increase was due to higher prices, not to underlying strong demand. There remains no recovery at hand.
Increasingly, global investors will shun the U.S. dollar, as its purchasing power increasingly gets hammered by Mr. Bernanke et al. The regular gold, silver, oil and Swiss franc graphs are shown below. As investors flee from the dollar, the precious metals and stronger major currencies will continue to be the primary beneficiaries in U.S. dollar terms, irrespective of any near-term market volatility, extreme or otherwise. More-prudent economic and fiscal actions taken by major U.S. trading partners will tend to make the U.S. dollar look all the worse on a relative basis.


Notes on Different Measures of the Consumer Price Index.
The Consumer Price Index (CPI) is the broadest inflation measure published by U.S. Government, through the Bureau of Labor Statistics (BLS), Department of Labor:
The CPI-U (Consumer Price Index for All Urban Consumers) is the monthly headline inflation number (seasonally adjusted) and is the broadest in its coverage, representing the buying patterns of all urban consumers. Its standard measure is not seasonally adjusted, and it never is revised on that basis except for outright errors,
The CPI-W (CPI for Urban Wage Earners and Clerical Workers) covers the more-narrow universe of urban wage earners and clerical workers and is used in determining cost of living adjustments in government programs such as Social Security. Otherwise its background is the same as the CPI-U.
The C-CPI-U (Chain-Weighted CPI-U) is an experimental measure, where the weighting of components is fully substitution based. It generally shows lower annual inflation rate than the CPI-U and CPI-W. The latter two measures once had fixed weightings—so as to measure the cost of living of maintaining a constant standard of living—but now are quasi-substitution-based. Since it is fully substitution based, the series tends to reflect lower inflation than the other CPI measures. Accordingly, the C-CPI-U is the "new inflation" measure being proffered by Congress and the White House as a tool for reducing Social Security cost-of-living adjustments by stealth. Moving to accommodate the Congress, the BLS announced pending changes to the C-CPI-U estimation and reporting process on October 22, 2014, which are described in Commentary No. 668
The ShadowStats Alternative CPI-U measures are attempts at adjusting reported CPI-U inflation for the impact of methodological change of recent decades designed to move the concept of the CPI away from being a measure of the cost of living needed to maintain a constant standard of living.
CPI-U. The Bureau of Labor Statistics (BLS) reported this morning (January 14th) that the seasonally-adjusted December 2010 CPI-U rose for the month by 0.50% (up by a statistically-significant 0.17%, unadjusted) +/- 0.12% (95% confidence interval, not seasonally adjusted). Such followed a 0.12% gain (up 0.01% unadjusted) in November.
Annualized, seasonally-adjusted, quarter-to-quarter CPI-U was 2.57% in fourth-quarter 2010, versus 1.47% in the third-quarter.
Unadjusted, year-over-year, average 2010 over 2009 annual CPI-U inflation was 1.64%, versus a contraction of 0.36% in 2009 over 2008.
Unadjusted, December’s year-to-year CPI-U inflation was 1.50% +/- 0.20% (95% confidence interval) against a 1.14% annual increase in November, and against a December 2009 year-to-year inflation rate of 2.72%.
Year-to-year inflation would increase or decrease in next month’s January 2011 reporting, dependent on the seasonally-adjusted monthly change, versus the 0.17% adjusted monthly gain seen in January 2010. I use the adjusted change here, since that is how consensus expectations are expressed. To approximate the annual inflation rate for January 2011, the difference in January’s headline monthly change (or forecast of same) versus the year-ago monthly change should be added to or subtracted directly from December 2010’s reported annual inflation rate of 1.50%.
CPI-W. The narrower, seasonally-adjusted December CPI-W, which has greater weighting for gasoline than does the CPI-U, rose by 0.63% (up 0.47% unadjusted) for the month, following a gain of 0.04% (up 0.06% unadjusted) in November.
Annualized, seasonally-adjusted, quarter-to-quarter CPI-W was 3.10% in fourth-quarter 2010, versus 1.76% in the third-quarter.
Unadjusted, year-over-year, average 2010 over 2009 annual CPI-W inflation was 2.07% versus a contraction of 0.67% in 2009 over 2008.
Unadjusted, December’s year-to-year CPI-W inflation was 1.68% against a 1.30% annual increase in November, and against a December 2009 year-to-year inflation rate of 3.36%.
C-CPI-U. The Chain-Weighted CPI-U — the fully substitution-based series that gets touted by CPI opponents and inflation apologists, including the recent presidential deficit commission, as the replacement for the CPI — is reported only on an unadjusted basis.
Unofficial, unadjusted year-over-year, average 2010 over 2009 annual C-CPI-U inflation was 1.56%, versus a contraction of 0.06% in 2009 over 2008.
C-CPI-U year-to-year inflation increased to 1.35% in December 2010, versus 0.96% in November. The year-to-year change for December 2009 was 2.98%.
Alternate Consumer Inflation Measures. Adjusted to pre-Clinton (1990) methodology, annual CPI inflation was roughly 4.8% in December 2010, up from 4.4% in November, while the SGS-Alternate Consumer Inflation Measure, which reverses gimmicked changes to official CPI reporting methodologies back to 1980, rose to about 8.9% (8.91% for those using the extra digit) from about 8.5% in November.
The SGS-Alternate Consumer Inflation Measure adjusts on an additive basis for the cumulative impact on the annual inflation rate of various methodological changes made by the BLS (the series is not recalculated). Over the decades, the BLS has altered the meaning of the CPI from being a measure of the cost of living needed to maintain a constant standard of living, to something that no longer reflects the constant-standard-of-living concept. Roughly five percentage points of the additive SGS adjustment reflect the BLS’s formal estimate of the annual impact of methodological changes; roughly two percentage points reflect changes by the BLS, where SGS has estimated the impact not otherwise published by the BLS.
Gold and Silver Highs Adjusted for CPI-U/SGS Inflation. Despite November 9th’s historic high gold price of $1,421.00 per troy ounce (London afternoon fix) and the multi-decade high silver price of $30.67 per troy ounce (London fix) on January 4th, gold and silver prices have yet to approach their historic high levels, adjusted for inflation. The earlier all-time high of $850.00 (London afternoon fix, per Kitco.com) of January 21, 1980 would be $2,395 per troy ounce, based on December 2010 CPI-U-adjusted dollars, $7,943 per troy ounce based on SGS-Alternate-CPI-adjusted dollars (all series not seasonally adjusted).
In like manner, the all-time high price for silver in January 1980 of $49.45 per troy ounce (London afternoon fix, per silverinstitute.org) has not been hit since, including in terms of inflation-adjusted dollars. Based on December 2010 CPI-U inflation, the 1980 silver price peak would be $139 per troy ounce and would be $462 per troy ounce in terms of SGS-Alternate-CPI-adjusted dollars (again, all series not seasonally adjusted).
As shown on page 22 in the Hyperinflation report, over the decades, the price of gold has compensated for more than the loss of the purchasing power of the U.S. dollar as reflected by CPI inflation, while it has effectively fully compensated for the loss of purchasing power of the dollar based on the SGS-Alternate.
Real Money Supply M3. The signal of the still unfolding double-dip recession, based on annual contraction in the real (inflation-adjusted) broad money supply (M3), most recently was discussed graphed in Special Commentary No. 342, continues and is graphed below. Based on today’s CPI-U report and the latest estimate on the December SGS-Ongoing M3 Estimate, the annual contraction in December 2010 deepened to 4.3%, from 4.0% in November.
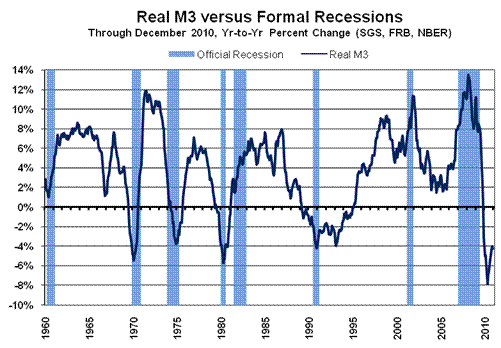
The signal for a downturn or an intensified downturn is generated when annual growth in real M3 first turns negative in a given cycle; the signal is not dependent on the depth of the downturn or its duration. The current downturn signal was generated one year ago, in December 2009. The broad economy tends to follow in downturn or renewed deterioration roughly six to nine months after the signal, as has appeared to have started in recent months, with flat-to-down nonfarm payrolls (with pending benchmark revisions), flattening industrial production, and renewed contraction in the already severely-constrained real estate market. New weakness in a number of series should become evident as annual numbers get locked-in and concurrent seasonally-adjusted series get fully published with updated as "revised" data. Such eventually will lead to recognition of a double-dip recession.
As noted in the opening comments, food and gasoline inflation directly reflected recent weakness in the U.S. dollar, which in turn reflected Federal Reserve efforts to impair the U.S. dollar’s purchasing power meaningfully. Ironically and nonsensically, the Fed does not view food or energy inflation as real inflation, hyping instead the non-food-and energy "core" inflation rate, which was a seasonally-adjusted monthly gain of 0.2% in December, versus 0.3% in November. Also on a monthly basis, seasonally-adjusted December intermediate goods rose by 1.0% (up by 1.1% in November), with December crude goods prices jumping up by 4.0% (up by 0.6% in November). Year-to-year inflation in December intermediate goods was up by 6.5% (a 6.3% gain in November), with December annual inflation in crude goods at 15.5% (up by 12.8% in November). In terms of annualized quarterly inflation, intermediate goods rose by 11.5% in fourth-quarter 2010 after declining by an annualized 1.7% in the third-quarter. On the same basis, crude goods inflation soared by 27.8%, following an annualized 6.3% increase in the third-quarter.
Also at work in the December reporting was a downside revision to the initial estimate of November 2010 sales, and ongoing major distortions from basically the same concurrent seasonal-factor adjustment problems (unprecedented business-cycle effects overwhelming the traditional seasonal patterns of activity) and sampling issues (companies out business that no longer are reporting, but still are being counted) with sales or employees on payrolls. If the seasonal factors were proper, they would be relatively stable over time. They would not swing violently when factors were recalculated the next month. In the December retail sales report, unstable seasonals altered past history. For example, where last month, December 2009 showed a 1.1% increase, this month the increase was reduced to 0.2%. As a result, current reporting now shows that there was virtually no increase in December 2009 sales, either, net of inflation.
This series will face massive revisions in the year ahead. Accordingly, even at best, these data have to be viewed as of highly questionable substance.
Nominal Retail Sales. Today’s (January 14th) December 2010 retail sales report — issued by the Census Bureau — indicated a marginally statistically-significant, seasonally-adjusted monthly gain of 0.61% (up 0.57% net of revisions) +/- 0.6% (95% confidence interval), versus an unrevised 0.83% November gain.
On a year-to-year basis, December 2010 retail sales were reported up by 7.93% from December 2009, versus a revised annual November gain of 7.48% (previously 7.66%). Annual changes still have been unstable due to year-ago comparisons ranging from a severe trough in activity to last year’s cash-for-clunkers stimulus effects. At the same time the Census Bureau still plays games with the monthly seasonal factors and revisions to year-ago data.
Real Retail Sales. Based on the December 2010 CPI-U reporting, inflation- and seasonally-adjusted monthly December retail sales increased by 0.10%, where, before inflation adjustment, the current number was up by 0.61%, versus an unrevised real monthly gain of 0.71% in November.
December real retail sales rose at a year-to-year pace of 6.45%, versus the revised 6.36% (previously 6.54%) annual gain reported for November.
Real retail sales showed an annualized quarterly pace of increase in fourth-quarter 2010 of 2.7%, versus no change in the third-quarter. This is suggestive of positive growth in personal consumption in the "advance" estimate of fourth-quarter 20010 GDP, but the relationship is not a strong one.
Since November 2008, monthly real retail sales (CPI-U deflated) have been fluctuating around an average of $164.0 billion (the deflated December number was $172.9 billion). The first graph following reflects the relatively volatile monthly levels of real retail sales, as reported. The monthly level for December 2010 may show some topping out, but that is not shown in the six-month-moving-average pattern in the second graph, yet.
Smoothed on a six-month moving-average basis, the pattern of activity here has been one of bottom-bouncing in terms of the level of inflation-adjusted sales. The recent bounce/upturn from short-lived stimulus factors and warped-seasonals still lingers in seasonal-adjustment problems, which likely await seasonal-factor and benchmark revisions for catch-up. Nonetheless, there has been no change in underlying fundamentals that would support a sustainable turnaround in personal consumption or in general economic activity — no recovery — just general bottom-bouncing. Accordingly, real retail sales levels in the months ahead likely will be increasingly negative.


Core Retail Sales. Assuming that the bulk of non-seasonal variability in food and gasoline sales is in pricing, instead of demand, "core" retail sales — consistent with the Federal Reserve’s predilection for ignoring food and energy prices when "core" inflation is lower than full inflation — are estimated using two approaches:
Version I: December versus November 2010 seasonally-adjusted retail sales — net of total grocery store and gasoline station revenues — gained by 0.7% versus the official aggregate gain of 0.6%.
Version II: December versus November 2010 seasonally-adjusted retail sales — net of the monthly change in revenues for grocery stores and gas stations — increased by 0.5% versus the aggregate gain of 0.6%.
Somewhat surprisingly, neither the grocery store nor the gasoline station sales reflected the type of increases suggested by the December CPI numbers.
Due to unusually cold weather in December, more than half of the 0.8% purported monthly increase in December production was due to a spike in utility usage. Industrial production is a series that pre-dates World War II and modern economic reporting, and it has some unusual residual features. For example, there are series that are estimate based on the electricity consumption by the involved factories. If electricity consumption is up because of unseasonably cold weather, such also will spike the estimated production at the relevant factories. Utility usage alone accounted for 0.4 percentage points of the 0.8% reported production increase.
As to the specific production data, the Federal Reserve Board reported today (January 14th) that seasonally-adjusted December 2010 industrial production rose by 0.84% (1.04% before revisions to November’s initial reporting, which were in the context of revisions to a number of prior months). November’s revised production showed a revised 0.26% (previously a 0.42%) gain.
Year-to-year change in December production was 5.91%, up from a revised 5.59% (previously 5.38%) in November, and down from the revised near-term peak of 8.35% in June. As with retail sales, the relatively high volatility in annual growth is due largely to the pattern of collapsing activity a year ago (a May 2009 trough), followed by cash-for-clunkers-boosted production. The year-to-year contraction of 12.86% seen in May 2009 was the steepest annual decline in production growth since the shutdown of war-time production following World War II.
The graph following shows recent monthly detail, with a fair shot that the September or October numbers, after revisions, still will have marked the turning point of renewed decline in the production series.
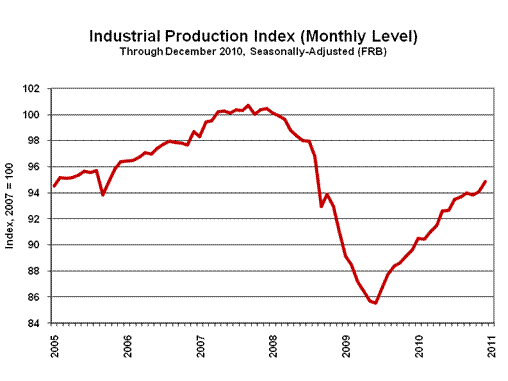

The "recovery" in production is shown in the preceding graph, where month-to-month volatility is smoothed using a six-month moving average. For the last 24 months, the production index has averaged 90.21, around which the series has been fluctuating, with December’s six-month moving average reading at 94.0, versus 94.9 for the single month. Production activity had leveled off at a low-level plateau of activity that at one point effectively wiped out the last eight years of growth in industrial production.
The bump up in December likely will reverse-out in a seasonal-factor catch-up before the March benchmark revision to the series. Despite ongoing intermittent upside gains generated by short-lived stimulus and seasonal-factor distortions, the series likely still is bottom-bouncing and should begin to soften anew, significantly, in the oncoming months.
Nominal (Not-Adjusted-for-Inflation) Trade Deficit. For November 2010, the Bureau of Economic Analysis (BEA) and the Census Bureau reported yesterday (January 13th) that the nominal, seasonally-adjusted monthly trade deficit in goods and services narrowed to $38.3 billion, versus a revised $38.4 (previously $38.7) billion in October, but that it widened from the $35.3 billion monthly deficit of November 2009.
Against October 2010, the November trade balance showed minor gains in exports and imports, with the export gains minimally stronger. As to oil import activity, both prices and import volume increased. Specifically, for the month of November 2010, the not-seasonally-adjusted average price of imported oil was $76.81 per barrel, up from $74.18 in October 2010, and up from $72.57 in November 2009. In terms of not-seasonally-adjusted physical oil imports, November 2010 volume averaged 8.606 million barrels per day, versus 8.209 million in October 2010 and 8.198 million in November 2009.
Real (Inflation-Adjusted) Trade Deficit. A narrowing trade deficit directly increases GDP growth and vice versa. As reported by the BEA with the November number, adjusted for seasonal factors and inflation (2005 chain-weighted dollars as used in reporting real GDP), the fourth-quarter goods deficit was running at an annualized pace of $545.7 billion. That was based on only two of three months of reporting, but it is all that will be used in the upcoming initial estimate of fourth-quarter GDP growth. Such was against a third-quarter annualized goods deficit estimate of $597.7 billion. The implied $42 billion improvement would be enough to add 0.3 percentage points to the GDP reporting, but the Bureau of Economic Analysis adds in a number of other guesstimates (such as services trade), which will impact the final guess.
Residential Construction –Housing Starts (December 2010). Due for release on Wednesday, January 19th, December housing starts likely will continue their general downtrend, with any monthly gain reported likely to be statistically indistinguishable from a month-to-month contraction.
__________