No. 359: GDP Revision, February Home Sales and New Orders for Durable Goods
COMMENTARY NUMBER 359
GDP Revision, February Home Sales and New Orders for Durable Goods
March 25, 2011
__________
Unlike Reported GDP, GNP and GDI Have Not Recovered Pre-Recession Highs
GDP Revision Reflected Weaker Consumption and Higher Inventories
Home Sales Plunged Anew in Tandem with Housing Starts
__________
PLEASE NOTE: The next regular Commentary is scheduled for Friday, April 1st, covering the release of March unemployment and payroll employment, along with an indication of the SGS-Ongoing M3 estimate for March. An interim Commentary will follow after the publication of full historical data for the benchmark revisions to industrial production. While the press release on the benchmark is scheduled for noon ET today (March 25th), the release of full historical data sometimes is delayed.
—Best wishes to all, John Williams
This morning’s (March 25th) GDP revision was to the upside, but it was little more than statistical noise and reflected weaker consumption and higher inventories than previously reported. GDP reporting remains the least meaningful and most heavily gimmicked/politicized of the major economic series, at least in the first year or so of reporting. The next round of GDP annual benchmark revisions, which should show downside revisions to recent economic history, is due for publication on July 29th.
Of some interest in the GDP report, though, were the initial estimates of GNP and GDI for fourth-quarter and annual 2010. As discussed in the Hyperinflation Special Report (2011) (see Section 4, Historical Perspective on the Economic Data on page 28), reported GDP had fully recovered its pre-recession high as of initial and current fourth-quarter 2010 reporting. Not only have the GNP and GDI not recovered their pre-recession highs, but they also have shown the recession to have been deeper than suggested by the GDP. Further, the GDI shows the onset of the recession to have been a full year earlier than is indicated by the GDP.
The GNP or Gross National Product, which actually is the broadest economic measure, includes GDP plus the trade balance in factor income, the flows of interest and dividend payments. Where current reporting shows a peak-to-trough GDP contraction of 4.1% from 4q2007 to 2q2009, with the 4q2010 GDP level now 0.13% above the level of 4q2007, the GNP contracted by 4.7% in the same period and stands 0.17% below its 4q2007 level.
The GDI or Gross Domestic Income, which in theory is the equivalent income measure to the GDP’s consumption measure, is surveyed and estimated separately from the GDP. The GDI is forced to GDP equivalence with the addition or subtraction of a “statistical discrepancy.” Again, where current reporting shows a peak-to-trough GDP contraction of 4.1% from 4q2007 to 2q2009, with the 4q2010 GDP level now 0.13% above the level of 4q2007, the GDI (net of the statistical discrepancy) contracted by 4.9% in the same period and stands 0.30% below its 4q2007 level. The GDI also shows same overall contraction from 4q2006 through 3q2009, suggestive of a much longer official downturn. All these numbers should see significant downside revisions in the pending benchmark revisions.
GDP-Related Definitions. For purposes of clarity and the use of simplified language in the following text, here are definitions of key terms used related to GDP reporting:
"Gross Domestic Product (GDP)" is the headline number and the most widely followed broad measure of U.S. economic activity. It is published quarterly by the Bureau of Economic Analysis (BEA), with two successive monthly revisions and with an annual revision the following July.
"Gross Domestic Income (GDI)" is the theoretical equivalent to the GDP, but it is not followed by the popular press. Where GDP reflects the consumption side of the economy and GDI reflects the offsetting income side. When the series estimates do not equal each other, which almost always is the case, the difference is added to or subtracted from the GDI as a "statistical discrepancy." Although the BEA touts the GDP as the more accurate measure, the GDI is relatively free of the monthly political targeting the GDP goes through.
"Gross National Product (GNP)" is the broadest measure of the U.S. economy published by the BEA. Once the headline number, now it rarely is followed by the popular media. GDP is the GNP net of trade in factor income (interest and dividend payments). GNP growth usually is weaker than GDP growth for net-debtor nations. Games played with money flows between the United States and the rest of the world tend to mute that impact on the reporting of U.S. GDP growth.
"Real" means growth has been adjusted for inflation.
"Nominal" means growth or level has not been adjusted for inflation. This is the way a business normally records revenues or an individual views day-to-day income and expenses.
" GDP Implicit Price Deflator (IPD)" is the inflation measure used to convert GDP data from nominal to real. The adjusted numbers are based on "Chained 2005 Dollars," at present, where the 2005 is the base year for inflation, and "chained" refers to the methodology which gimmicks the reported numbers so much that the total of the deflated GDP sub-series misses the total of the deflated total GDP series by nearly $40 billion in "residual" as of second-quarter 2010.
"Quarterly growth," unless otherwise stated, is in terms of seasonally-adjusted, annualized quarter-to-quarter growth, i.e., the growth rate of one quarter over the prior quarter, raised to the fourth power, a compounded annual rate of growth. While some might annualize a quarterly growth rate by multiplying it by four, the BEA uses the compounding method, raising the quarterly growth rate to the fourth power. So a one percent quarterly growth rate annualizes to 1.01 x 1.01 x 1.01 x 1.01 = 1.0406 or 4.1%, instead of 4 x 1% = 4%.
"Annual growth" refers to the year-to-year change of the referenced period versus the same period the year before.
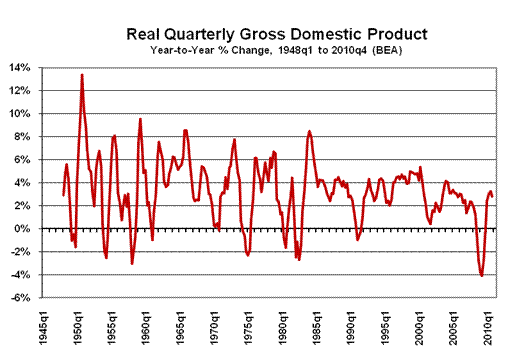
GDP. Published this morning, March 25th, by the Bureau of Economic Analysis (BEA), the "third" estimate (second revision) of real (inflation-adjusted) fourth-quarter 2010 Gross Domestic Product (GDP) annualized quarterly growth revised to 3.11% +/- 3% (95% confidence interval), up from the second estimate of 2.79%, but still down from the initial estimate of 3.17%. The third-quarter 2010 growth estimate was 2.56%. For the year, average 2010 GDP versus 2009 was revised to 2.85% from 2.83% (initially 2.86%), versus a 2.63% decline in 2009 against 2008, while year-to-year change in fourth-quarter 2010 over fourth-quarter 2009 was revised to 2.78% from 2.70% (initially 2.79%), higher than the 1.95% year-to-year gain in fourth-quarter 2009, but still lower than the 3.25% seen in third-quarter 2010.
The fourth-quarter GDP implicit price deflator estimate was revised to an annualized pace of 0.35% from 0.38% (initially 0.26%), versus 2.03% annualized quarterly inflation for third-quarter 2010. In contrast, annualized seasonally-adjusted quarterly inflation for the CPI-U in the fourth-quarter spiked to a seasonally-adjusted 2.62%, from 1.43% annualized inflation in the third-quarter (see Commentary No. 353). The lower the inflation rate that is used in deflating the GDP, the stronger is the resulting inflation-adjusted number and vice versa.
The SGS Alternate-GDP estimate for fourth-quarter 2010 remains an approximate annual contraction of 2.1% versus the official estimate of a 2.8% gain. Such is more negative than the alternate 1.4% annual contraction (3.2% official gain) in the third-quarter (see the Alternate Data tab). While annualized real quarterly growth is not estimated formally on an alternative basis, a flat-to-minus quarter-to-quarter change still appears to have been realistic for the fourth-quarter, in what generally has been a protracted period of bottom-bouncing.
Reflecting the latest revisions, the following graph shows year-to-year percent change in the official inflation-adjusted quarterly GDP for the history of the series. The record annual contraction for the series was 4.11%, seen in second-quarter 2009. The GDP and related series will go through their annual benchmark revisions on July 29, 2011.
GNP. The initial estimate for annualized real growth in fourth-quarter GNP (Gross National Product)—GDP net of trade in factor income (interest and dividend payments)—was 2.75% versus 2.31% in the third-quarter, with year-to-year growth slowing to 2.82% in the fourth-quarter from 3.35% in the third-quarter. For the year, average 2010 GNP versus 2009 was a gain of 3.11% versus a 3.18% decline in 2009 against 2008.
GDI. The initial estimate for annualized real growth in fourth-quarter GDI (Gross Domestic Income)—the economy’s income-side theoretical equivalent measure to the consumption side’s GDP measure—was 4.60% versus 1.21% in the third-quarter, with year-to-year growth slowing to 3.15% in the fourth-quarter from 3.66% in the third-quarter. For the year, average 2010 GDI versus 2009 was a gain of 3.10% versus a 3.80% decline in 2009 against 2008.
The widely followed nondefense capital goods orders rose by 2.5% (up by 4.2% before prior-period revisions) in February, versus a revised monthly gain of 6.6% (previously up by 4.6%) in January. For February, the unadjusted year-to-year growth in the series was 6.5%, down from a revised 13.5% (previously 12.4%) gain in January.
The following graphs are not adjusted for inflation and show the monthly volatility in the seasonally-adjusted durable goods new orders series from airplane orders. The first graph shows commercial aircraft orders on both a monthly and on a six-month moving-average basis, and the second graph shows seasonally-adjusted monthly total new orders for durable goods (NODG), as well as NODG net of aircraft orders.
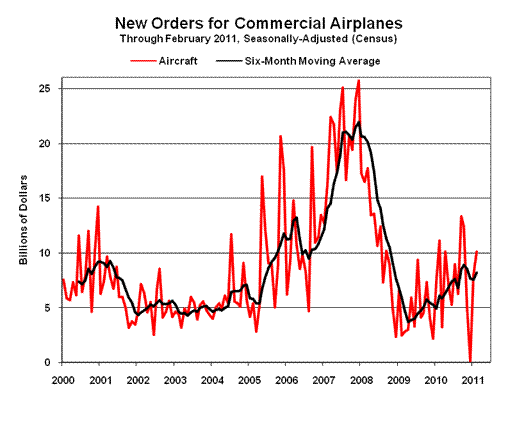

The series appear possibly to be topping out. This is despite last year’s benchmark revision that built an upside bias into the monthly numbers. The plotted data are not adjusted for inflation, because there is no particularly meaningful inflation index that would make sense as the deflator (I deliberately exclude any inflation measures used in the national income series, such as GDP, which have been modeled and massaged in such a fashion as to have little relationship to the real world.) Net of inflation, however, the pattern of monthly increases—seen on average since 2009—would be shallower, much shallower.
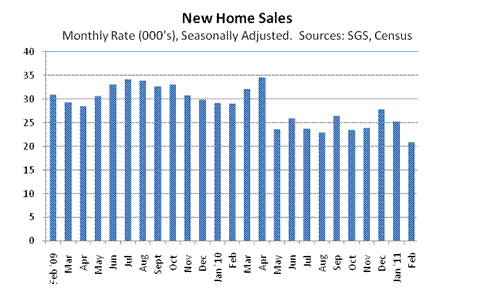
Wednesday’s (March 23rd) reporting of February new-home sales (counted based on contract signings, Census Bureau) showed a statistically-insignificant monthly decline of 16.9% (down 12.0% before prior period revisions) +/- 22.3% (95% confidence interval) from January. January’s revised level was down by 9.6% (previously a 12.6%) from December. The year-to-year decline in February 2011 new-home sales was a statistically-significant 28.0 +/- 17.3% (95% confidence interval), versus a revised 13.8% (previously 18.6%) decline in January.
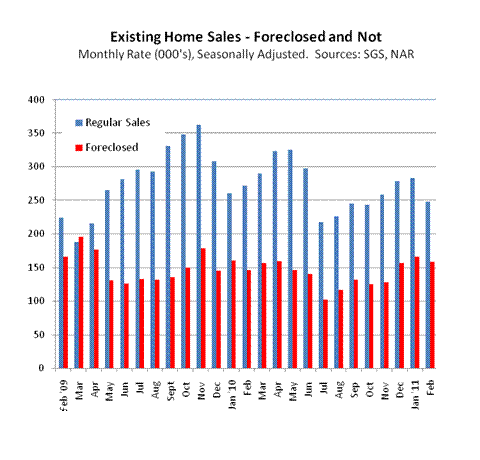
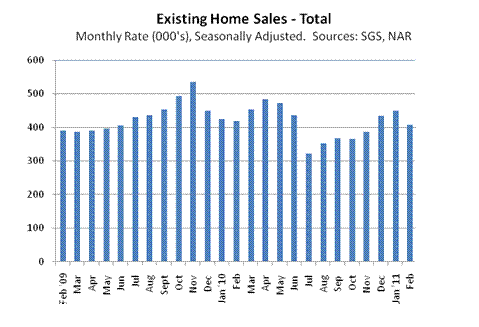
Monday’s (March 21st) release of February existing-home sales (counted based on actual closings, National Association of Realtors [NAR]) showed a 9.6% monthly decline (down 9.0% net of prior-period revisions), versus January’s revised 3.4% (previously 2.7%) gain. On a year-to-year basis, February sales were down by 2.8% from February 2010.
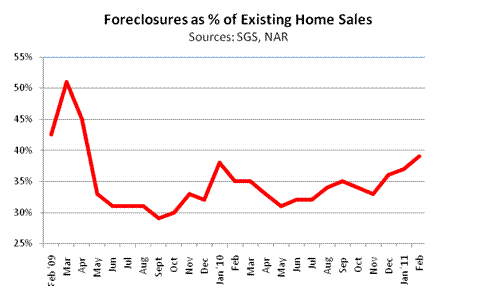
Foreclosure activity remained an intensifying distorting factor for home sales, with "distressed" activity accounting for an estimated 39% of existing sales in the NAR’s February reporting, the highest portion seen since Spring 2009, and up from 37% in January.
Separately, the Census Bureau acknowledges that a portion of new home sales also is from foreclosure activity but offers no estimate as to the scope of the issue. Some in the construction trade have difficulty competing with the pricing of foreclosed properties. Until the foreclosure problems get worked out in the system, monthly changes in these home sales numbers cannot be taken as meaningful positive indicators (when the numbers are positive) of underlying activity in homeowner real estate, as it relates to general economic activity.
Payroll Employment, Unemployment (March 2011). The publication of March 2011 labor conditions is scheduled for Friday, April 1st. Per Briefing.com (as we go to press), the consensus estimates are for March nonfarm payrolls to gain 170,000 versus a 192,000 gain in February, and for the headline U.3 unemployment rate to hold at 8.9%. The reporting here is of particularly poor quality at the moment, as discussed in Commentary No. 355, and those issues will be updated in next week’s payroll Commentary. That said, underlying reality would be consistent with a much-weaker-than-consensus jobs outlook and with a spike in the headline unemployment rate.
SGS Ongoing-M3 Estimate (March 2011). An indication of the preliminary estimate for the SGS Ongoing-M3 Estimate for March will be published with the April 1st Commentary, with formal posting of the estimate in the Alternate Data section over the ensuing weekend. Early-March reporting so far has been consistent with some month-to-month increase, with a narrowing of the year-to-year pace of decline.
__________