SPECIAL COMMENTARY. No. 429: Consumer Liquidity Update, March Retail Sales
SPECIAL COMMENTARY NUMBER 429
Consumer Liquidity Update, March Retail Sales
April 16, 2012
__________
Gain in Inflation-Adjusted March Retail Sales Was Not Statistically Significant
First-Quarter 2012 Consumer Income Increasingly Constrained
Sustainable Economic Growth Is Not Possible Without Underlying Growth in Income and Credit
__________
PLEASE NOTE: The next regular Commentary is scheduled for tomorrow, Tuesday, April 17th, covering March industrial production and housing starts.
Best wishes to all — John Williams
CONSUMER LIQUIDITY UPDATE
Income and Credit Growth Constrained. The latest consumer earnings and credit numbers show ongoing structural deterioration in consumer liquidity. With lack of positive, real (inflation-adjusted) growth in income, there can be no sustainable growth in real personal consumption (71% of GDP). Temporary consumption gains could be fueled by debt expansion, but that option also is not available to most consumers. With limited prospects for income growth and debt expansion in the near future, broad economic activity remains likely to bottom-bounce for the foreseeable future, while healthy, sustainable gains in real retail sales remain improbable.
The discussion that follows—on retail sales and consumer liquidity circumstances—updates and is supplemental to Commentary No. 422, which included detail on consumer liquidity, and to Special Commentary No. 426, which updated broad economic conditions.
Retail Sales. March 2012 retail sales jumped by 0.8% for the month, following a revised 1.0% (previously 1.1%) monthly gain in February. Net of 0.3% headline CPI-U inflation, real March retail sales gained 0.5% for the month, versus 0.6% in February. As discussed in the prior Commentary No.428, though, questionable seasonal adjustments to March gasoline prices likely understated headline inflation significantly. Nonetheless, consider the following graphs.
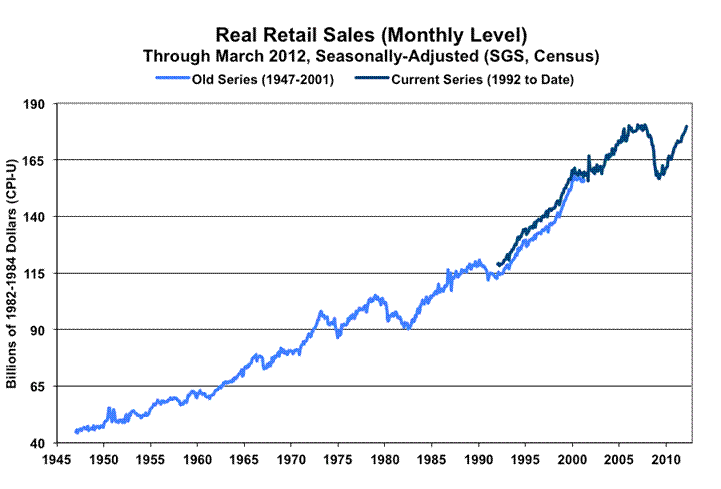
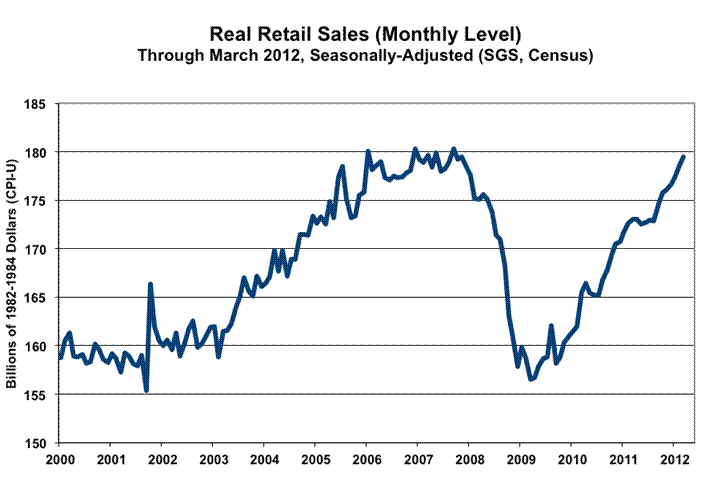
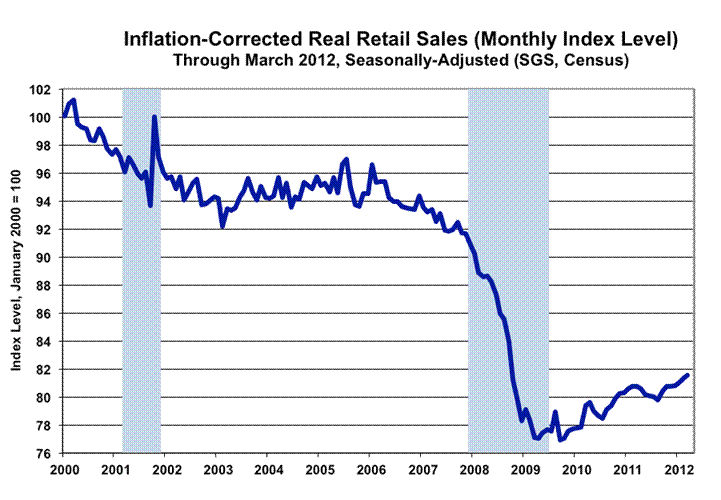
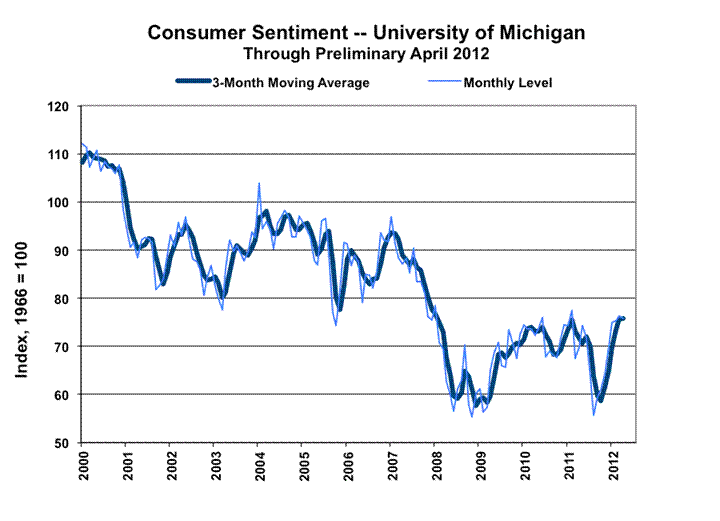
Graph 1 shows real retail sales (inflation-adjusted, deflated by the CPI-U) in historical context since World War II; Graph 2 shows closer historical detail of the same data for the period beginning in 2000. Graph 3 is an “inflation-corrected” version of Graph 2, where the deflator is the SGS-Alternate CPI Inflation (1990 Base), instead of the CPI-U. CPI-U has been heavily distorted in recent years due to shifting methodologies that have depressed reported inflation. This updated version of Graph 27 on page 44 of Hyperinflation 2012 more closely follows the consumer sentiment numbers (Graph 4) and household income numbers (Graph 5), than does Graph 2 (deflated by CPI-U inflation). Graph 5 also is more consistent with the inflation-corrected GDP graph shown in Special Commentary No. 426.
Graph 1
Graph 2
Graph 3
Graph 4
Graph 5
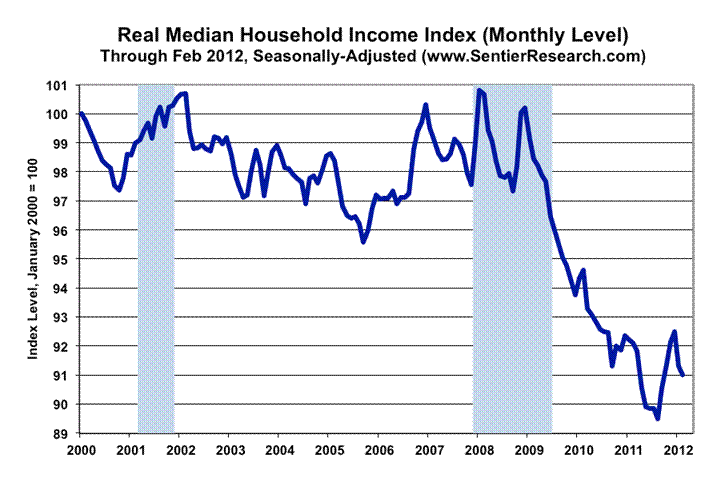
Deteriorating Consumer Income. Graph 5 of median household income has not been updated since its last use in Special Commentary No. 426, but it is included here for ease of comparison with other graphs.
Official reporting of various income measures is suggestive of continuing deterioration in consumer income conditions. February reporting of real (inflation-adjusted) disposable income by the Bureau of Economic Analysis (BEA) showed a seasonally-adjusted monthly decline of 0.2% in January 2012, followed by a 0.1% monthly contraction in February. Year-to-year change slowed from 0.6% growth in January to 0.3% growth in February. Putting aside gimmicked imputations included in the disposable income numbers, if the CPI-U were used to deflate disposable income, instead of the PCE-deflator (which understates inflation by more than the CPI-U does), the monthly real numbers would have been more negative, and the annual numbers would have been negative, instead of positive.
The Bureau of Labor Statistics (BLS) publishes average weekly earnings estimates based on the establishment survey, which also provides the monthly estimates of payrolls. In first-quarter 2012, real average weekly earnings (deflated by the CPI-U) for all employees on private nonfarm payrolls were up 0.1% (not annualized) from fourth-quarter 2011, but down 0.2% from first-quarter 2011.
In first-quarter 2012, real average weekly earnings (deflated by the CPI-W) for production and nonsupervisory employees on private nonfarm payrolls were unchanged from fourth-quarter 2011, and down 0.6% from first-quarter 2011.
Graph 6
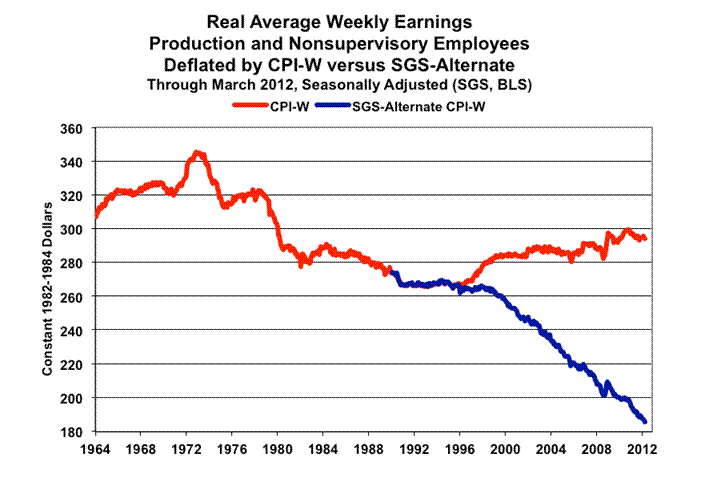
The CPI-U is the inflation measure government statisticians tend to use for the general population, while CPI-W is more of a blue-collar measure. The BLS has been publishing the total average earnings number only since 2006, while the production and nonsupervisory measure has been published since 1964. The two series, since 2006, have had 95% correlation as to level and a 96% correlation as to year-to-year change, which means the two series tend to move with each other.
As shown in the preceding Graph 6, the peak in real average weekly earnings was hit in October 1972. The official accounting for March of 2012—almost 40 years later—still is 14.8% below that pre-1973 recession high. The bounce higher in real earnings starting the mid-1990s was due to post-1990 changes made to the CPI-W and the CPI-U, which lowered official inflation reporting. The blue line shows roughly what those numbers would have looked like today, as estimated by the SGS-Alternate CPI Inflation (1990-Base), had the changes not been made.
Consumer Credit Growth Due Solely to Federal Student Loans. As shown in Graph 7, the happy hype over growth in consumer credit outstanding all is due to student loans from direct lending by the federal government. Credit that consumers more traditionally have used for personal consumption—credit used to improve or to make up for a shortfall in living standards—has been bottom-bouncing along with most sectors of the economy, including the inflation-corrected retail sales shown in Graph 3.
Graph 7
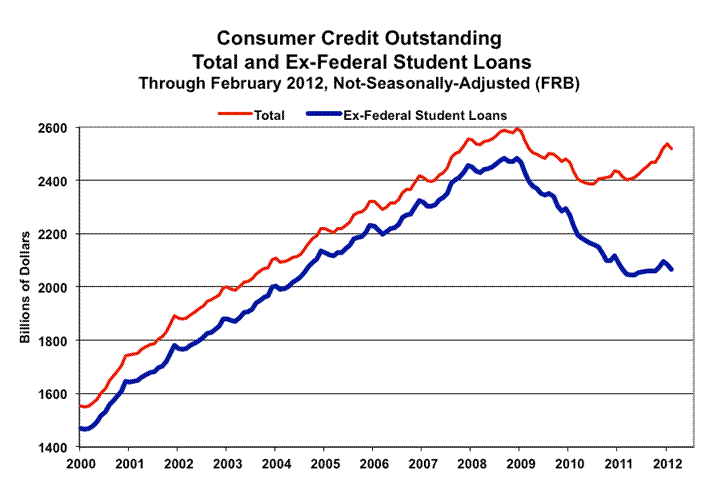
On an unadjusted basis, year-to-year growth in total consumer credit outstanding was 4.3%, per the February 2012 reporting of the Federal Reserve Board, but all of that gain was in federal lending for student loans, which was up by 29.9% from the year before. Net of student loans, year-to-year change in consumer credit outstanding was unchanged at 0.0%.
Structural Liquidity Problems Continue to Impair Economic Prospects. Consumer income currently is in contraction, while consumer credit continues to show no net growth in areas that could buy short-lived expansion in consumption of consumer goods. The issues here involve long-term structural problems with income and an ongoing systemic solvency crisis, as discussed in Hyperinflation 2012. There is no near-term relief in sight.
With consumer liquidity so impaired, and with the consumer confidence and sentiment measures still showing levels so low that they have not been seen outside of the deepest post-World War II recessions, the prospects of a near-term, sustainable economic recovery are nil. That applies as well as to a sustainable recovery in real retail sales. Watch for the April 30th benchmark revision that will restate the last several years of retail sales history.
Hyperinflation Watch. In the context of the updated economic background published in Special Commentary No. 426, and today’s Special Commentary on retail sales and consumer liquidity, and with full consideration to other intervening economic, inflation and financial-market developments since the January 25, 2012 publication of the hyperinflation report, the broad economic, inflation and hyperinflation outlooks discussed in Hyperinflation 2012 have not changed.
__________
REPORTING DETAIL
RETAIL SALES (March 2012)
Upcoming Retail Sales Benchmark Revisions Likely to Show Weaker Historical Activity. The relatively strong March 2012 retail sales report was published in the context of a pending annual benchmark revision, which is due for release in just two weeks, on April 30th. The revised data likely will show that that reported sales activity in recent years has been weaker than previously reported. This should be the case particularly for 2010, the year of the latest Annual Retail Trade Survey. The Census Bureau also should catch-up in its reported concurrent seasonally-adjusted data. As with the payroll series, the monthly revisions to retail sales historical data in the concurrent adjustment process are not published, despite the reported historical data lacking consistency with the most-recent reporting.
Nonetheless, the reporting quality of the series continues to and will continue to suffer from the concurrent seasonal-factor issues and broader distortions seen otherwise in seasonal-adjustment factors and sampling methodologies, as discussed in Hyperinflation 2012. The stability of the seasonal-adjustment process and sampling methods have been disrupted severely by the unprecedented depth and length of the current economic downturn in the post-World War II era (the period of modern economic reporting). More-common seasonal-adjustment issues also have surfaced in the current reporting, with likely positive contributions to adjusted sales activity from unseasonably mild weather. That factor should swing into a net-negative contributor status by April reporting.
Under such circumstances, where the markets effectively are flying blind as to actual economic activity, consideration of broad underlying fundamentals is essential. Consumer income and credit remain structurally impaired, as discussed in the Consumer Liquidity section and previously in Commentary No. 422 and Special Commentary No. 426. Those factors continue to signal economic deterioration, not recovery, with the broad economy remaining in serious trouble.
Nominal (Not-Adjusted-for-Inflation) Retail Sales. Today’s (April 16th) report on March 2012 retail sales—issued by the Census Bureau—indicated a statistically-significant, seasonally-adjusted monthly gain of 0.78% (up by 0.80% before prior-period revisions) +/- 0.6% (all confidence intervals are at the 95% level). March’s increase followed a revised February gain of 1.00% (previously 1.06%).
March 2012 retail sales were reported up by 6.45% +/- 0.8%, where year-to-year growth in February 2012 retail sales was a revised 6.43% (previously 6.48%).
The retail numbers are heavily modeled and include generally overly-optimistic underlying assumptions at this stage of reporting. With the annual benchmark revision (April 30th), the revamped data commonly would show downside revisions to sales data of recent years, with the happy assumptions replaced by hard data.
Core Retail Sales. In March 2012 retail sales reporting, both gasoline stations and groceries stores showed increases in monthly sales, but seasonally-adjusted gasoline sales were not up was much as they were in February. Assuming that the bulk of non-seasonal variability in food and gasoline sales is in pricing, instead of demand, “core” retail sales—consistent with the Federal Reserve’s preference for ignoring food and energy prices when “core” inflation is lower than full inflation—are estimated using two approaches:
Version I: March 2012 versus February 2012 seasonally-adjusted retail sales series—net of total grocery store and gasoline station revenues—up by 0.80%, versus an official gain of 0.78%.
Version II: March 2012 versus February 2012 seasonally-adjusted retail sales series—net of the monthly change in revenues for grocery stores and gas stations—was up by 0.61% versus an official gain of 0.78%.
Real (Inflation-Adjusted) Retail Sales. As noted in Commentary No.428, the seasonally-adjusted March 2012 CPI-U was seriously understated due to seasonal-factor distortions used in adjusting gasoline prices. With more-regular adjustments, the adjusted CPI-U would have been at least double the headline 0.3%, covering the bulk of today’s (April 16th) headline gain in March retail sales. It is, however, the official headline CPI-U that is used by the St. Louis Fed in its monthly deflation of the retail sales series.
Accordingly, inflation- and seasonally-adjusted March 2012 retail sales rose by 0.49% for the month, where, before inflation-adjustment, the current number was up by 0.78%. February real retail sales revised lower to a 0.59% (initially a 0.65%) gain, where the nominal (not-adjusted-for-inflation) number revised to a 1.00% (previously 1.06%) increase. Net of the increases in retail prices, the implied current and recent monthly gains in the physical volume of goods and services sold have not been statistically meaningful.
March real retail sales rose at a year-to-year pace of 3.71%, versus a revised 3.45% (previously 3.49%) gain in February.
The ongoing “recovery” in real retail sales is reflected in graphs in the Consumer Liquidity section. Shown there are the latest regular monthly graphs of the levels of CPI- and seasonally-adjusted activity, as well as an “inflation-corrected” real retail sales graph, which adjusts the deflation process to reflect the use of the SGS-Alternate CPI Inflation, which removes the dampening effects on reported inflation from the post-1990 methodological changes in the CPI reporting.
As official consumer inflation picks up further, and as overall retail sales suffer from the ongoing consumer liquidity squeeze, these data should turn down meaningfully in what eventually will become a formal double-dip recession.
There has been no change in the underlying fundamentals. There is nothing that would support a sustainable turnaround in retail sales, personal consumption or in general economic activity. There is no recovery, just general bottom-bouncing. Accordingly, real retail sales levels in the months ahead should turn negative, as discussed in the Consumer Liquidity section.
Week Ahead. Recognition of an intensifying double-dip recession as well as an escalating inflation problem remains sporadic. The political system would like to see the issues disappear until after the election; the media does its best to avoid publicizing unhappy economic news; and the financial markets will do their best to avoid recognition of the problems for as long as possible, problems that have horrendous implications for the markets and for systemic stability.
Until such time as financial-market expectations move to catch up fully with underlying reality, or underlying reality catches up with the markets, reporting generally will continue to show higher-than-expected inflation and weaker-than-expected economic results in the months and year ahead. Increasingly, previously unreported economic weakness should show up in prior-period revisions.
Industrial Production (March 2012). The release of March industrial production is scheduled for tomorrow, Tuesday, April 17th. Given what appears to have been some catch-up from prior poor-quality reporting with weaker-than-expected March payrolls, a similar pattern also could follow in production. Usually, an involuntary build-up in inventories—as seen in recent months—is followed by a corrective pullback in production. Net of any revisions, production should have been close to flat, which would be weaker than softening consensus expectations.
Residential Construction (March 2012). The March housing starts data are scheduled for release on Tuesday, April 17th. To the extent there is a monthly gain in this highly volatile series, it should not be statistically significant. Bottom-bouncing at historically low levels—the pattern of the last three-plus years—likely will continue.
Home Sales (March 2012). The March 2012 existing home sales release is scheduled for Thursday, April 19th, from the National Association of Realtors. New home sales data are due for release from the Census Bureau on the following Tuesday, April 24th. As usually is the case for both series, entrenched patterns of bottom-bouncing likely will continue, and the new monthly results are not likely to be statistically meaningful.
__________