No. 430: March Industrial Production and Housing Starts
COMMENTARY NUMBER 430
March Industrial Production and Housing Starts
April 17, 2012
__________
Industrial Production Unchanged for Second Month
Housing Starts in 40th Month of Historically-Low-Level Stagnation,
Following 2006-to-2008 Collapse in Activity
__________
PLEASE NOTE: The next regular Commentary is scheduled for Wednesday, April 25th, covering March new orders for durable goods and existing and new home sales. A subsequent Commentary on Friday, April 27th, will cover the advance estimate of first-quarter 2012 GDP.
Best wishes to all — John Williams
Opening Comments and Executive Summary. This morning’s (April 17th) economic data tended to confirm an ongoing pattern of economic stagnation in housing starts and showed perhaps the early stages of renewed stagnation in industrial production. This Commentary will be relatively brief, updating the new housing and production data in the context of recent Special Commentaries No. 426 and No. 429 on the economy and consumer liquidity.
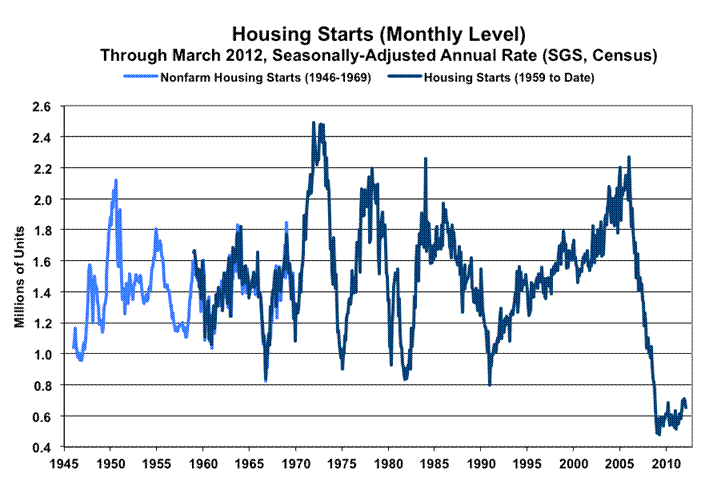
Housing Starts. March 2012 housing starts fell by a statistically-insignificant 5.8%, versus February 2012, but that was no more than the 40th-straight month of stagnant business activity. This period of stagnation, or bottom-bouncing at historically-low levels, followed an unprecedented 75% plunge in housing activity from 2006 through the end of 2008. As discussed in the Special Commentaries and in Hyperinflation 2012, there is no recovery or relief evident in the housing numbers.

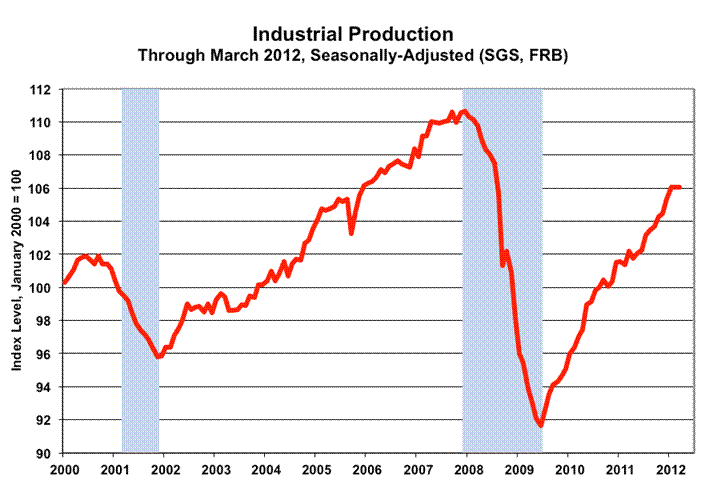
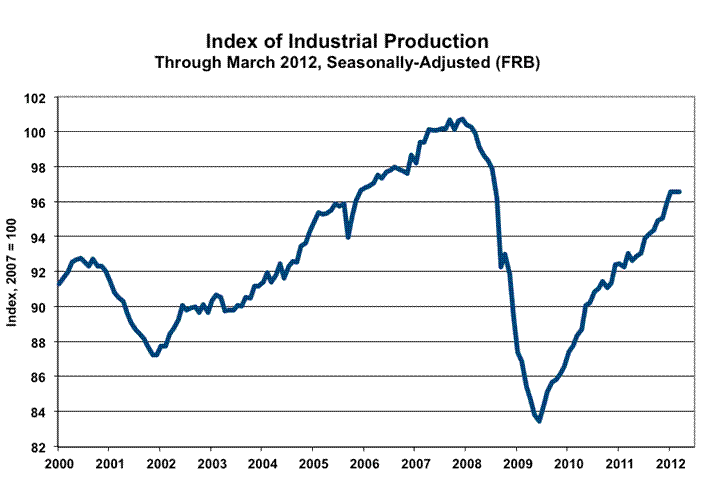
Industrial Production. With minor downside revisions to recent history in place from the benchmark revision, industrial production in March 2012 was unchanged for the second month. Year-to-year change slowed to 3.8% in March from 4.6% in February. With no obvious impact from unseasonable weather patterns, March manufacturing production dropped by 0.2% for the month, as industries moved to work-down excess inventories.
Inflation-Corrected Industrial Production. A portion of industrial production (largely high tech, such as computers) is estimated by deflating nominal (not-adjusted-for-inflation) numbers with inflation measures of a nature similar to those used in the GDP estimates. Hedonic price adjustments usually lower estimated inflation for nebulous quality improvements that otherwise cannot be measured directly. Where those inflation estimates are understated, the resulting inflation-adjusted production growth is overstated.
As discussed and graphed in Hyperinflation 2012, and as graphed below, the inflation-corrected industrial production series is an approximation of what production would look like with the hedonic inflation gimmicks removed.
Please note that the graphs here are indexed to January 2000 = 100, the same basis as, and for comparison purposes with, the inflation-corrected retail sales series shown in yesterday’s Special Commentary No. 429 and the inflation-adjusted GDP series shown in Special Commentary No. 426. The graphs of the index of industrial production in the Reporting Detail section are based with the index set at 2007 = 100, as reported by the Federal Reserve.

Hyperinflation Watch. March payroll employment, housing starts and industrial production all came in below consensus estimates. While the headline retail sales number was stronger than expected, the March monthly gain was statistically-insignificant net of inflation effects. The economy has not recovered from its multi-year plunge in activity from 2006/2007 into late-2008/mid-2009. Reported recent economic gains largely have been illusions, tied to the effects of underestimated inflation. As economic reporting begins to catch up with underlying economic reality, the implications for the system are not positive.
Ongoing economic stagnation and renewed contraction will mean much-worse-than-anticipated federal budget deficits, U.S. Treasury funding needs and banking-system solvency issues. The resulting economic and financial-system instabilities promise a particularly unusual 2012 election year. More on that will follow in a later Commentary.
In the context of the updated economic background published in Special Commentary No. 426, and yesterday’s Special Commentary No. 429 on consumer liquidity, and with full consideration to other intervening economic, inflation and financial-market developments since the January 25, 2012 publication of the hyperinflation report, the broad economic, inflation and hyperinflation outlooks discussed in Hyperinflation 2012 have not changed.
__________
REPORTING DETAIL
INDEX OF INDUSTRIAL PRODUCTION (March 2012)
Industrial Production Unchanged for Second Month. Despite the March 30th publication of the annual benchmark revision to the industrial production series, further revisions have been added to the series with today’s (April 17th) reporting, beginning in October 2011, adding about 0.4% to the level of the just-benchmarked February 2012 number. That said, March 2012 reporting shows production to have stalled, with manufacturing pulling back as part of a process to reduce excess inventories.
As discussed in Special Commentary No. 426, and incorporated here by reference, the production benchmark revisions were small and generally to the downside, but the presentation of the revisions was something of a sham. Where the index is based on the year 2007 = 1000, the year 2007 also was covered by the revisions. Where the revisions were to the downside for 2007, the effect of the restated series also being set at 2007 = 100 was to make the post-2007 revised data look stronger than they actually were, relative to the old series.
March 2012 Reporting. Starting with fresh data, subsequent to the Federal Reserve Board’s restatement of recent production history, the release of seasonally-adjusted March 2012 industrial production showed production to have been unchanged month-to-month versus February, which, in turn, was unchanged from January. At the third decimal point, March production was down by 0.005%, while February’s gain was 0.002%, changes that effectively were nil, less than 0.01%.
After a 0.8% gain in February, manufacturing production fell by 0.2% in March, as efforts were made to reduce excess inventories. There was no obvious impact in the latest numbers from the unseasonably-mild winter.
Year-to-year growth in March 2012 aggregate production softened to 3.78% from 4.64% in February, well off the series’ recent relative peak annual growth of 8.13% in June 2010. The year-to-year contraction of 15.15% seen in June 2009, at the end of second-quarter 2009, was the steepest annual decline in production growth since the shutdown of war-time production following World War II.
The “recovery” in industrial production is reflected in the following graphs, which incorporate all revisions. Both graphs show the monthly level of the production index. The first of these shows recent historical detail for the period beginning in 2000, the second shows the same data in historical context since World War II.
Corrected for the understatement of inflation used in deflating portions of the industrial production index, the series has shown more of a bottom-bouncing pattern since 2009. The inflation-corrected production series is graphed in the Opening Comments and Executive Summary section.

RESIDENTIAL CONSTRUCTION (March 2012)
March Housing Starts Continued Bottom-Bouncing. Housing starts showed a statistically-insignificant monthly downside bounce in March, partially reflecting a downside move in the particularly-volatile apartment-starts component. The regularly volatile aggregate housing starts series continued its protracted bottom-bouncing, with the series well into its fourth year of activity at 75% below 2006’s record construction level. There remains no recovery or relief in sight.
March 2012 Reporting. The Census Bureau reported today (April 17th) a statistically-insignificant month-to-month decline in seasonally-adjusted housing starts of 5.8% (down 6.3% before prior-period revisions) +/- 18.2% (all confidence intervals are at the 95% level) for March 2012. February starts were revised to a monthly decline of 2.8% (previously a decline of 1.1%).
Starts for apartment buildings remained highly volatile, month-to-month, falling by a statistically-insignificant 19.8% +/- 43.7%, after rising by a revised 17.5% (previously 28.7%) in February. The “one-unit” category for March eased by 0.2% +/- 13.3%, following a revised 9.0% (previously 9.9%) monthly decline in February.
The year-to-year change in aggregate March 2012 housing starts was a statistically-insignificant increase of 10.3% +/- 17.0%, following a revised 34.0% (previously 34.7%) annual gain in February.
For the last 40 months, the pattern of housing starts has remained one of stagnation at an historically low-level plateau of activity. Since December 2008, housing starts have averaged a seasonally-adjusted annual rate of 590,000. In that period, all monthly readings have been within the normal range of monthly variability for the aggregate series, around that average, with the 654,000 annual rate for March 2012 at 10.8% above average.
As shown in the graph in the Opening Comments and Executive Summary, current monthly housing starts activity remains off the record monthly low seen for the present series in April 2009. Recent series detail is seen more easily in that graph, which covers reporting since 2000. The following graph shows that current activity is well below any level reported prior to the 2006 peak in the current series or in the predecessor nonfarm housing starts series, which was introduced in 1946.
Week Ahead. Recognition of an intensifying double-dip recession as well as an escalating inflation problem remains sporadic. The political system would like to see the issues disappear until after the election; the media does its best to avoid publicizing unhappy economic news; and the financial markets will do their best to avoid recognition of the problems for as long as possible, problems that have horrendous implications for the markets and for systemic stability.
Until such time as financial-market expectations move to catch up fully with underlying reality, or underlying reality catches up with the markets, reporting generally will continue to show higher-than-expected inflation and weaker-than-expected economic results in the months and year ahead. Increasingly, previously unreported economic weakness should show up in prior-period revisions.
Home Sales (March 2012). The March 2012 existing home sales release is scheduled for Thursday, April 19th, from the National Association of Realtors. New home sales data are due for release from the Census Bureau on the following Tuesday, April 24th. As usually is the case for both series, entrenched patterns of bottom-bouncing likely will continue, and the new monthly results are not likely to be statistically significant.
New Orders for Durable Goods (March 2012). The March release on new orders for durable goods is scheduled for Wednesday, April 25th. As has been the case in recent months, whatever change is reported for this regularly volatile series, it likely will not be meaningful, remaining well within the bounds of regular month-to-month swings, and subject to the irregular activity in nondefense aircraft orders.
In terms of potential inflation contribution to the new orders level, the seasonally-adjusted, month-to-month change in the March PPI finished goods capital equipment index was an increase of 0.2%, with year-to-year inflation at 2.1%.
Gross Domestic Product—GDP (First-Quarter 2012, First or “Advance” Estimate). The Bureau of Economic Analysis (BEA) usually targets the consensus estimate, when making its initial guess at economic activity for a new quarter, as reflected in the GDP. The “advance” estimate of first-quarter 2012 GDP is due for release on Friday, April 27th, with the early consensus outlook for headline-GDP growth (annualized and inflation-adjusted) at 2.3% (MarketWatch.com), down from the latest reported GDP headline growth of 3.0% for fourth-quarter 2011.
Underlying economic reality would suggest a downside reporting surprise for this most worthless of government statistics. The actual estimate most certainly will not be statistically significant. Separately, the hard data—on which the estimate will be based—are so sparse that BEA will not even try to make an initial guess at first-quarter 2012 gross domestic income (GDI) and gross national product (GNP) for another month.
__________