No. 447: May CPI, Real Retail Sales, Real Earnings
COMMENTARY NUMBER 447
May CPI, Real Retail Sales, Real Earnings
June 14, 2012
__________
Softening Inflation Pattern Is About to Reverse
May Year-to-Year Inflation: 1.7% (CPI-U), 1.6% (CPI-W), 9.3% (SGS)
Real Retail Sales and Real Earnings Revise Lower
__________
CORRECTION: In yesterday’s Commentary No. 446, a transcription error showed a “0.56%” that should have been “0.26%” in the following sentence: “April 2012 previously was reported with an inflation-adjusted monthly gain of 0.11%, which is now a 0.26% [corrected] monthly contraction.” The Commentary posted on www.shadowstats.com has been corrected. I apologize for the error.
PLEASE NOTE: The next regular Commentary is scheduled for tomorrow, Friday, June 15th covering May industrial production.
Best wishes to all — John Williams
Opening Comments and Executive Summary. The headline 0.3% decline in May inflation and recent softness in inflation reporting have been due largely to lower oil prices and to negative seasonal-adjustments of same. That pattern is about to reverse.
On the real retail sales front, activity still is looking weak, despite the monthly decline in the CPI-U used in deflating the series. The weakening pattern of sales is due to the downside revisions in May’s nominal retail sales reporting (see Commentary No. 446). A similar pattern also was seen in today’s (June 14th) reporting of real earnings. A general review of May economic reporting will follow in tomorrow’s (Friday, June 15th) regular Commentary that will cover May industrial production.
Seasonal-Adjustment Reduction to Gasoline Prices Is About to Reverse Sharply. The 6.8% decline in May gasoline prices—that dominated the 0.3% seasonally-adjusted headline decline in the CPI-U—is an artificial number created in the Bureau of Labor Statistics’ (BLS) seasonal-adjustment process. The country actually did not see a 6.8% decline in prices at the gas pump. Gasoline prices really dropped by 3.6% (per the BLS), or by 4.2% (per the Department of Energy), not by the headline 6.8%.
The regular, artificial depression of adjusted gasoline prices at this time of year, however, is due for a sharp reversal. In June, seasonal adjustments for gasoline prices usually move towards neutral, turning much less negative in impact. In July, seasonal adjustments flip and turn strongly positive, boosting reported headline gasoline price inflation and often turning actual price declines into adjusted increases.
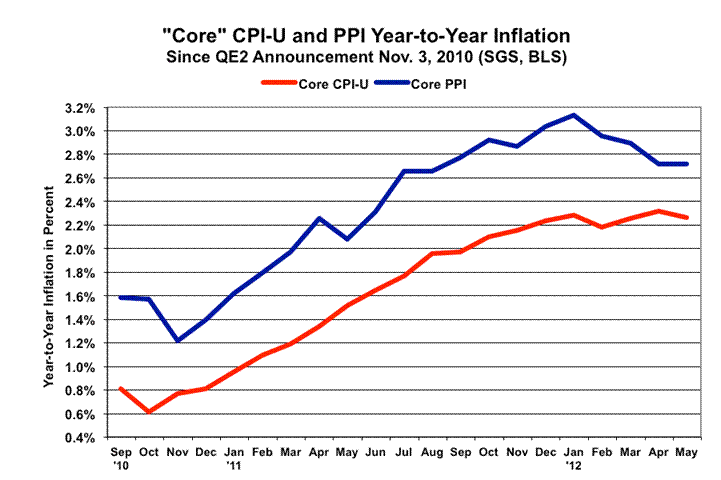
Considering, as indicated in the preceding graph, that “core” inflation remains strong, the addition of a stabilization or an upturn in adjusted gasoline prices would reverse the recent softness in the headline CPI. In the event of a shift in underlying monetary or political fundamentals that spike oil and energy-related prices, the effects on near-term, seasonally-adjusted CPI inflation reporting could be devastating.
Real Retail Sales Flatten Out (Inflation-Corrected Series Turns Down). The following charts update Graphs 28 and 29 in Special Commentary No. 445. The 0.3% decline in the May CPI-U pushed the headline 0.2% decline in May retail sales to a real (inflation-adjusted) 0.1% gain.

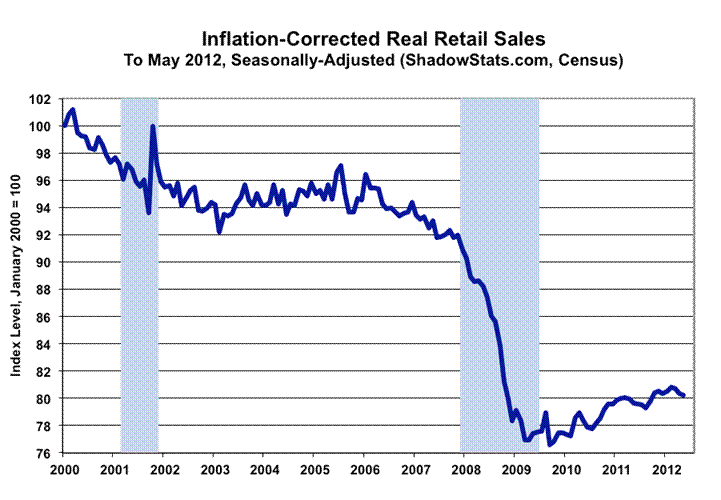
The downside revisions to the nominal (not-adjusted-for-inflation) retail sales numbers in May had the effect of flattening or creating a topped-out pattern for real retail sales in early-2012.
That near-term pattern turned negative in the updated “inflation-corrected” real retail sales graph. The inflation-corrected numbers use the SGS-Alternate Inflation Measure (1990-Base) for deflation instead of the CPI-U. As discussed in Hyperinflation 2012 and Special Commentary No. 445, deflation by too-low an inflation number (such as the CPI-U) results in overstated real growth.
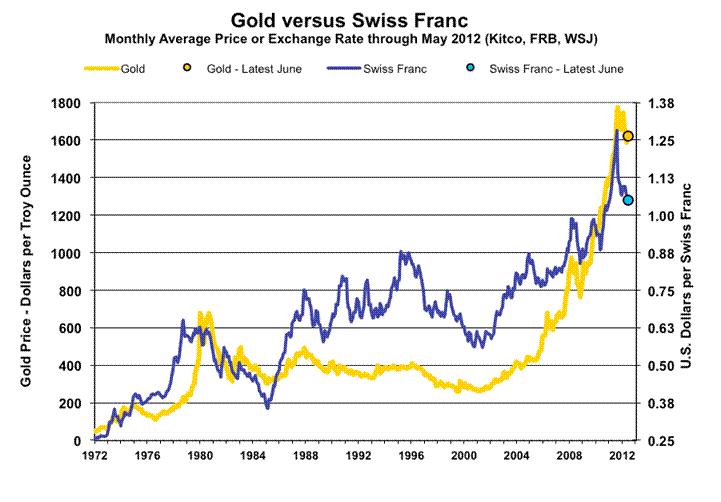
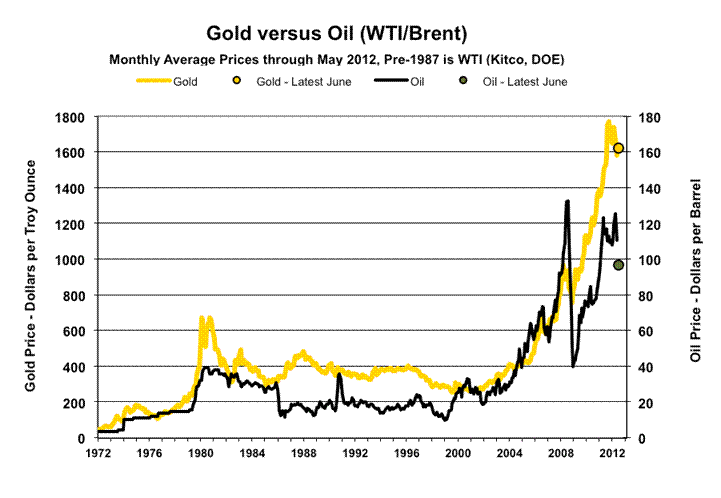
Hyperinflation Watch. Special Commentary No. 445 (June 12th) updated the hyperinflation outlook, as well as U.S. economic, U.S. dollar, and systemic-solvency conditions. The Special Commentary is a supplement to Hyperinflation 2012 (January 25th), which remains the primary missive detailing the hyperinflation story.
Following are the updated graphs of gold versus the Swiss franc, oil and silver that regularly are included with the monthly CPI Commentary. Again, see the Special Commentary for the current outlook.

__________
REPORTING DETAIL
CONSUMER PRICE INDEX—CPI (May 2012)
May Inflation Hit by Lower Gasoline Prices, But Change Is Afoot. The 0.3% headline decline in the May 2012 CPI-U was tied largely to an actual decline in gasoline prices exacerbated by negative seasonal adjustments, but those seasonal patterns are about to reverse. In combination with continuing inflation in the broad economy, stable-to-rising gasoline prices—coming out of the Bureau of Labor Statistics’ (BLS) seasonal-adjustment process in the months ahead—should reverse recent softness in headline inflation. The process would help to spike prices sharply, if likely underlying monetary and political developments evolve in such manner as to renew upside pressure on oil and energy-related prices.
Notes on Different Measures of the Consumer Price Index.
The Consumer Price Index (CPI) is the broadest inflation measure published by U.S. Government, through the Bureau of Labor Statistics (BLS), Department of Labor:
The CPI-U (Consumer Price Index for All Urban Consumers) is the monthly headline inflation number (seasonally adjusted) and is the broadest in its coverage, representing the buying patterns of all urban consumers. Its standard measure is not seasonally adjusted, and it never is revised on that basis except for outright errors,
The CPI-W (CPI for Urban Wage Earners and Clerical Workers) covers the more-narrow universe of urban wage earners and clerical workers and is used in determining cost of living adjustments in government programs such as Social Security. Otherwise its background is the same as the CPI-U.
The C-CPI-U (Chain-Weighted CPI-U) is an experimental measure, where the weighting of components is fully substitution based. It generally shows lower annual inflation rate than the CPI-U and CPI-W. The latter two measures once had fixed weightings—so as to measure the cost of living of maintaining a constant standard of living—but now are quasi-substitution-based. Since it is fully substitution based, the series tends to reflect lower inflation than the other CPI measures. Accordingly, the C-CPI-U is the "new inflation" measure being proffered by Congress and the White House as a tool for reducing Social Security cost-of-living adjustments by stealth. Moving to accommodate the Congress, the BLS announced pending changes to the C-CPI-U estimation and reporting process on October 22, 2014, which are described in Commentary No. 668
The ShadowStats Alternative CPI-U measures are attempts at adjusting reported CPI-U inflation for the impact of methodological change of recent decades designed to move the concept of the CPI away from being a measure of the cost of living needed to maintain a constant standard of living.
The BLS estimated a not-seasonally-adjusted 3.6% decline in May gasoline prices, versus a 4.2% monthly decline indicated in the more-comprehensive surveying of the Department of Energy. Seasonal adjustments in May further depressed reported gasoline price inflation, turning that unadjusted 3.6% monthly decline into a seasonally-adjusted 6.8% contraction.
It is important to keep in mind that actual gasoline prices dropped by 3.6% (or 4.2%) in May, not by 6.8%. The 6.8% is an artifact of the seasonal-adjustment process. The recent, seasonally-adjusted depression of adjusted gasoline prices, however, is about to reverse, as it usually does at this time of year. In June, the seasonal adjustments for gasoline prices move towards neutral, turning much less negative. In July, the seasonals flip and turn strongly positive, boosting the reported headline gasoline price inflation.
After 17 of the last 18 months showed rising annual “core” CPI-U inflation (net of food and energy inflation), the May 2012 year-to-year core rate backed off April’s cycle-high of 2.31%, to 2.26%. That still was well above the core inflation of 0.61%, in November 2010, when Mr. Bernanke introduced QE2 in a successful bid to debase the U.S. dollar, with the effect of spiking oil prices. The core annual inflation numbers for both the CPI-U and PPI reflect the ongoing impact of higher energy prices in the broad economy (see the graph and comments in the Opening Comments and Executive Summary).
May 2012 unadjusted year-to-year CPI-U inflation moved lower, to 1.70%, versus 2.30% in April.
Year-to-year total CPI-U inflation would increase or decrease in next month’s June 2012 reporting, dependent on the seasonally-adjusted monthly change, versus the 0.09% gain in the adjusted monthly level reported for June 2011. I use the adjusted change here, since that is how consensus expectations are expressed. To approximate the annual unadjusted inflation rate for June 2012, the difference in June’s headline monthly change (or forecast of same) versus the year-ago monthly change should be added to or subtracted directly from the May 2012 annual inflation rate of 1.70%.
CPI-W. The headline seasonally-adjusted CPI-W, which is a narrower series and has greater weighting for gasoline than does the CPI-U, declined by 0.40% (down by 0.18% unadjusted) in May, following an effectively unchanged April, which was down by 0.03% (up by 0.31% unadjusted).
Unadjusted, May 2012 year-to-year CPI-W inflation was 1.64%, down from 2.38% in April.
C-CPI-U. Year-to-year inflation for the May 2012 C-CPI-U was 1.61%, versus 2.07% in April.
The chain-weighted CPI-U is the fully substitution-based series that gets touted as a CPI replacement by inflation apologists and by those who oppose use of the existing CPI-U and CPI-W, including a number of politicians looking to cut deficit spending by using the C-CPI-U to reduce Social Security annual cost of living (COLA) adjustments artificially. The series is reported only on an unadjusted basis and is revised annually for the prior two years, unlike the unadjusted CPI-U, which never is revised, except for outright calculation errors.
Alternate Consumer Inflation Measures. Adjusted to pre-Clinton (1990) methodology, annual CPI inflation was roughly 5.1% in May 2012, versus 5.6% in April. The SGS-Alternate Consumer Inflation Measure, which reverses gimmicked changes to official CPI reporting methodologies back to 1980, was about 9.3% (9.30% for those using the extra digit) in May 2012, against April’s 9.9%.
The SGS-Alternate Consumer Inflation Measure adjusts on an additive basis for the cumulative impact on the annual inflation rate of various methodological changes made by the BLS (the series is not recalculated). Over the decades, the BLS has altered the meaning of the CPI from being a measure of the cost of living needed to maintain a constant standard of living, to something that neither reflects the constant-standard-of-living concept nor measures adequately most of what consumers view as out-of-pocket expenditures. Roughly five percentage points of the additive SGS adjustment reflect the BLS’s formal estimate of the annual impact of methodological changes; roughly two percentage points reflect changes by the BLS, where SGS has estimated the impact not otherwise published by the BLS. (See the Public Commentary on Inflation Measurement for further detail.)

Gold and Silver Highs Adjusted for CPI-U/SGS Inflation. Despite the September 5, 2011 historic-high gold price of $1,895.00 per troy ounce (London afternoon fix), and despite the multi-decade-high silver price of $48.70 per troy ounce (London fix of April 28, 2011), gold and silver prices have yet to re-hit their 1980 historic levels, adjusted for inflation. The earlier all-time high of $850.00 (London afternoon fix, per Kitco.com) of January 21, 1980 would be $2,511 per troy ounce, based on May 2012 CPI-U-adjusted dollars, $9,227 per troy ounce based on SGS-Alternate-CPI-adjusted dollars (all series not seasonally adjusted).
In like manner, the all-time high price for silver in January 1980 of $49.45 per troy ounce (London afternoon fix, per silverinstitute.org), although approached in 2011, still has not been hit since 1980, including in terms of inflation-adjusted dollars. Based on May 2012 CPI-U inflation, the 1980 silver price peak would be $146 per troy ounce and would be $537 per troy ounce in terms of SGS-Alternate-CPI-adjusted dollars (again, all series not seasonally adjusted).
As shown in Table 1 on page 50 of Hyperinflation 2012, over the decades, the increases in gold and silver prices have compensated for more than the loss of the purchasing power of the U.S. dollar as reflected by CPI inflation, while they effectively have compensated fully for the loss of purchasing power of the dollar based on the SGS-Alternate Consumer Price Measure (1980 Methodologies Base).
Real (Inflation-Adjusted) Retail Sales. As suggested in the Commentary No. 446 on the May retail sales report, a decline (0.3%) in monthly May CPI-U offset the 0.2% headline contraction in May retail sales, leaving real monthly growth at a minimal 0.1%. Downside revisions in the latest retail sales report also revised away any real growth of recent months, leaving the inflation-adjusted retail sales series flat since the beginning of 2012.
Based on May CPI-U reporting, inflation- and seasonally-adjusted May retail sales rose by 0.11% for the month, where, before inflation-adjustment, the current number was down by 0.17% (see Commentary No. 446 for detail of the retail sales report). April real retail sales were revised to a 0.26% monthly contraction (initially a 0.11% gain), versus a revised nominal 0.22% contraction (previously a 0.15% gain); and real March retail sales showed a revised 0.08% gain (previously up by 0.39%), versus revised nominal growth of 0.37% (previously 0.68%). Net of the changes in retail prices, the implied current and recent monthly gains in the physical volume of goods and services sold have not been statistically significant.
May real retail sales rose at a year-to-year pace of 3.50%, versus a revised 3.22% (previously 3.97%) in April, and versus a revised 3.56% (previously 3.88%) in March.
The ongoing “recovery” in real retail sales is reflected in the following monthly graphs. Revisions in May reporting wiped out growth previously estimated for recent months, leaving a topped-out pattern for early-2012.
The first graph shows the post-World War II real (deflated by the CPI-U) retail sales activity. The second graph shows the same numbers in greater detail since 2000.

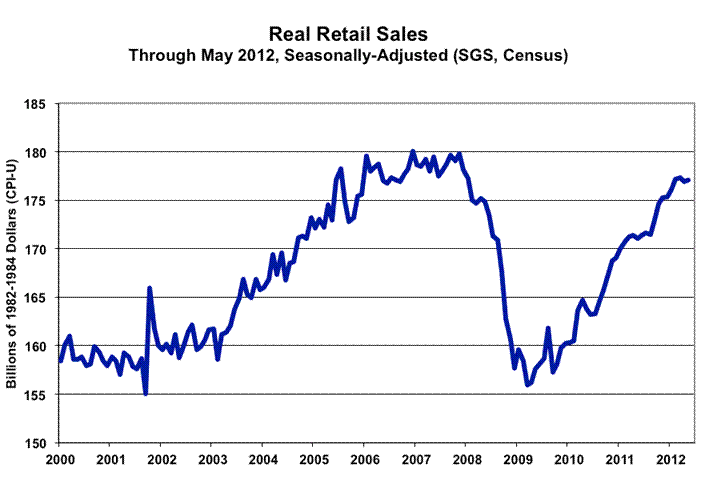
The recent pattern turns negative in the updated “inflation-corrected” real retail sales graph shown in the Opening Comments and Executive Summary section. The inflation-corrected numbers use the SGS-Alternate Inflation Measure (1990-Base) for deflation instead of the CPI-U. As discussed in Hyperinflation 2012 and Special Commentary No. 445, deflation by too-low an inflation number (such as the CPI-U) results in the deflated series overstating economic growth.
As official consumer inflation picks up again, and as overall retail sales suffer from the ongoing consumer liquidity squeeze, these data should turn down meaningfully in what eventually will become a formal double-dip recession.
There has been no change in the underlying fundamentals. There is nothing that would support a sustainable turnaround in retail sales, personal consumption or in general economic activity. There is no recovery, just general bottom-bouncing. Accordingly, real retail sales levels in the months ahead should turn negative.
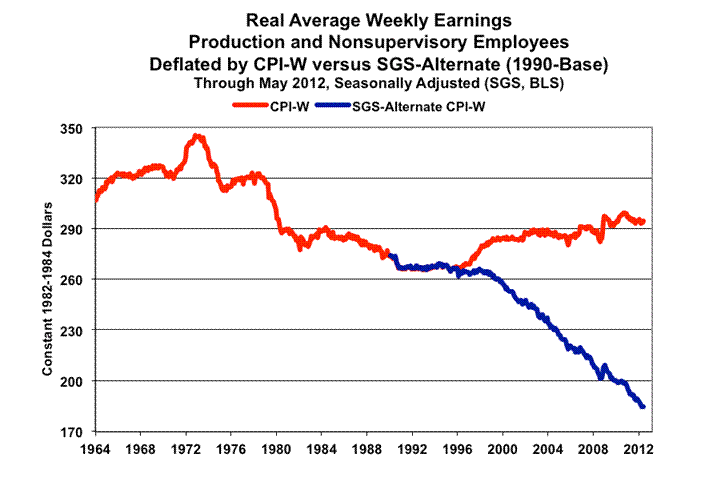
Real Earnings. Coincident with today’s (June 14th) CPI release, the BLS published real (inflation-adjusted) average weekly earnings for May 2012. For all employees on private nonfarm payrolls, real average weekly earnings (deflated by the CPI-U) were rose by 0.1% (fell by 0.2% before inflation-adjustment) in May, following a revised 0.1% real gain (previously unchanged) in April. Year-to-year, real earnings were unchanged in May, versus an unrevised 0.2% decline in April.
As with the retail sales series—just published by the Commerce Department—the production and nonsupervisory employees series showed unusually large downside revisions in March and April, which shifted the pattern of recent official reporting to a steeper decline. For May 2012, real average weekly earnings (deflated by the CPI-W) were up by 0.4% (down by 0.1% before inflation-adjustment), following an unrevised 0.2% real gain in April. Year-to-year, real earnings were unchanged in May, versus a downwardly revised drop of 0.7% (initially a 0.4% contraction) in April, and a downwardly revised drop of 0.8% (previously a decline of 0.4%) in March.
The production and nonsupervisory employees series is the only one with meaningful historical data, and is shown in the previous graph. The chart shows both CPI-W deflation and deflation using the SGS-Alternate Inflation Measure (1990-Base), updating Graph 13 in Special Commentary No. 445.

Real Money Supply M3. The signal for a double-dip or ongoing recession, based on annual contraction in the real (inflation-adjusted) broad money supply (M3), discussed in the in Hyperinflation 2012, remains in place and continues, despite real annual M3 growth having turned to the upside. As shown in the preceding graph—based on the May 2012 CPI-U report and the latest May SGS-Ongoing M3 Estimate—the annual growth in real M3 for May 2012 slowed to a 0.7% gain, versus a 0.8% gain estimated for April. As with the nominal M3 series, the pick-up in annual growth has stalled. Real year-to-year growth could turn negative, again, in the next several months, generating still another signal.
The signal for a downturn or an intensified downturn is generated when annual growth in real M3 first turns negative in a given cycle; the signal is not dependent on the depth of the downturn or its duration. Breaking into positive territory does not generate a meaningful signal one way or the other for the broad economy. The current downturn signal was generated in December 2009. The broad economy tends to follow in downturn or renewed deterioration roughly six-to-nine months after the signal. Weaknesses in a number of series continued in 2011, with some new softness seen in recent reporting. A renewed downturn in official data should be obvious to most observers by mid-2012—before the election—eventually leading to recognition of a double-dip recession.
Week Ahead. Recognition of an intensifying double-dip recession as well as a pending, escalating inflation problem remains sporadic. The political system would like to see the issues disappear until after the election; the media does its best to avoid publicizing unhappy economic news; and the financial markets will do their best to avoid recognition of the problems for as long as possible, problems that have horrendous implications for the markets and for systemic stability.
Until such time as financial-market expectations move to catch up fully with underlying reality, or underlying reality catches up with the markets, reporting generally will continue to show higher-than-expected inflation and weaker-than-expected economic results in the months and year ahead. Increasingly, previously unreported economic weakness should show up in prior-period revisions.
Industrial Production (May 2012). Due for release Friday, June 15th, by the Federal Reserve, the headline industrial production number should contract for May, following the 1.1% monthly gain initially reported for April. Where the working-off of excess inventories should result in softer production numbers, expectations for headline growth seem to have settled around flat-to-plus.
Despite the recent benchmark revision to industrial production, the April reporting showed post-benchmark revisions that were unusually large and irregular. As always is the case, the accuracy of headline numbers is subject to whatever surveying or reporting problems the Federal Reserve may be having with its series.
Residential Construction (May 2012). The detail on May housing starts is due for release on Tuesday, June 19th. The four-year pattern of housing starts stagnation—at an historically low level of activity—likely has not changed. As has become the standard circumstance, any reported monthly gain likely would not be statistically significant.
__________