No. 452: Consumer Liquidity, Construction Spending, PCE Deflator
COMMENTARY NUMBER 452
Consumer Liquidity, Construction Spending, PCE Deflator
July 2, 2012
__________
Private Nonresidential Construction Took A Hit in Revision
Consumer Liquidity Outlook Remains Dim
__________
PLEASE NOTE: The next regular Commentary is scheduled for Friday, July 6th, covering June employment and unemployment.
Happy Fourth of July! Best wishes to all — John Williams
Opening Comments and Executive Summary. Domestic economic prospects were not brightened by economic releases of the last couple of days. Consumer liquidity conditions remain bleak, and construction spending revised lower in 2011 and continues to stagnate.
Consumer Problems Persist. The following graphs give a sense of current consumer conditions. The first two reflect the updated University of Michigan’s consumer sentiment and the Conference Board’s consumer confidence measures. The confidence graph is repeated from the prior Commentary for ease of comparison.
Both series have turned lower on a monthly as well as a three-month moving-average basis. Despite volatility since the economic plunge, both series remain at levels not seen outside of severe recession.


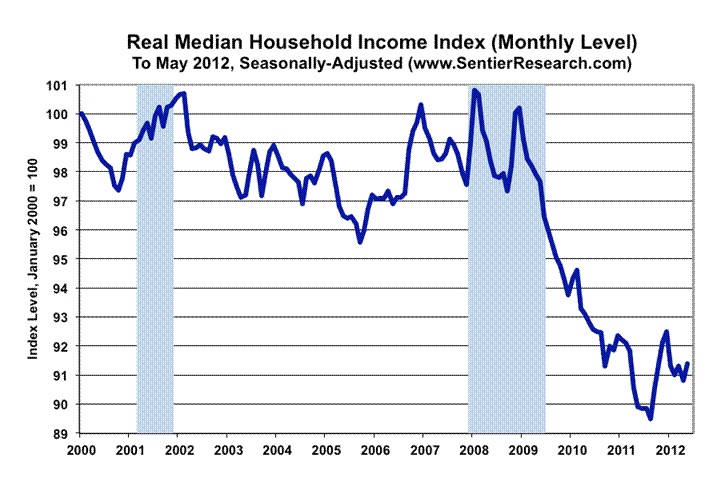
The sentiment and confidence measures tend to reflect the economic outlook that dominates the popular media. It also reflects the current financial circumstance of the consumer. The inflation-adjusted measure of median household income just was updated by www.SentierResearch.com and is plotted in the next graph. Despite a small upturn in May, the series has continued to bottom-bounce since 2010, and it remains not far off the cycle low seen in this period of economic non-recovery. All the consumer-related graphs remain suggestive of ongoing stagnation or contraction.
June Purchasing Managers (ISM) Survey Contracts. The release of the June 2012 manufacturing survey, released by the ISM, showed manufacturing falling into contraction (below 50.0) at 49.7, down from 53.5 in May; new orders fell to 47.8 from 60.1. Although these plunges in activity reflect some long-overdue seasonal-factor catch-up, they also may reflect some actual weakness in the economy.
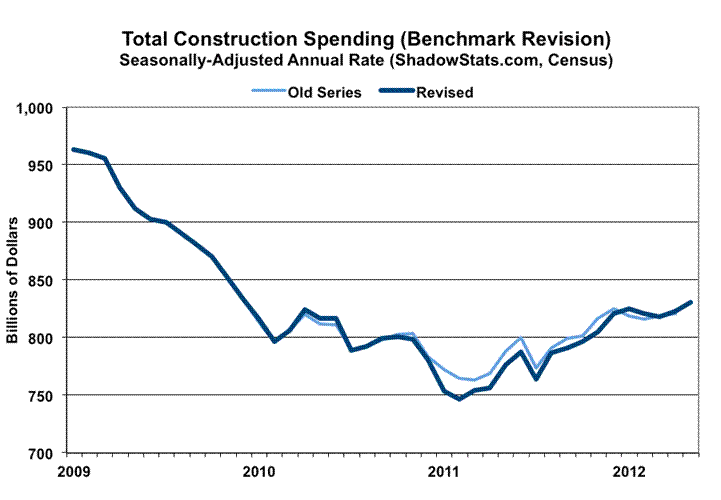
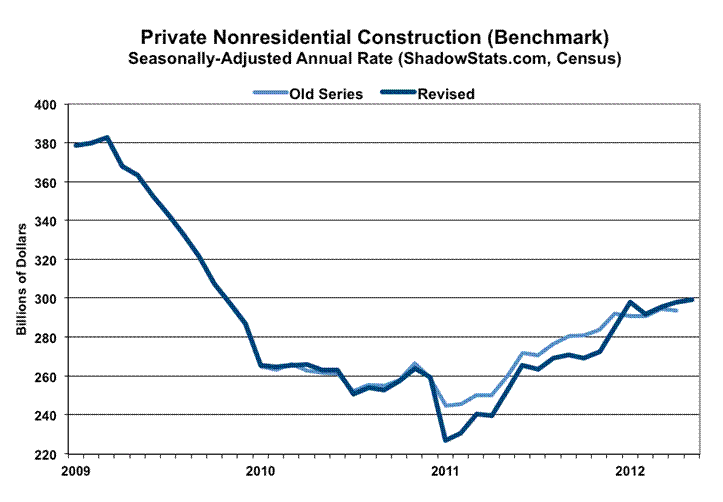
Construction Spending—Revisions and May 2012. The estimate of the value of total U.S. construction put in place in May 2012 was up by a statistically-insignificant 0.9% versus April 2012, but such was in the context of annual revisions in the series back to January of 2010. As revised, April was up 0.6% from March. By major sector, monthly gains were strong in private-residential, soft in private-nonresidential and were continuing to contract in public construction. Keep in mind that these numbers are before any adjustment for inflation.
The benchmark revisions primarily were to 2011, where annual activity revised lower by 1.4%, dominated by a 3.8% downside revision to private-nonresidential activity, as shown in the following graphs. See the Reporting Detail section for further breakout and graphics. The construction spending revisions should have some downside impact on 2011 GDP in the pending July 27th annual revisions to that series.
PCE Deflator Decline Reflected Gasoline Prices and Revisions. The 0.2% monthly decline reported for May 2012 PCE inflation largely reflected a revision to April, which was revised from being unchanged to showing a gain of 0.2%. Nonetheless lower gasoline prices brought the year-to-year inflation rate down to 1.5% from a revised 1.9% (previously 1.8%) in April, versus the Federal Reserve’s target of 2.0%. Aside from the games played by the Fed, the PCE deflator has little relationship to real-world activity.
Hyperinflation Watch: U.S. Dollar Remains Key. At such time as the euro-area financial situation stabilizes, global markets again will turn to the primary issues facing global financial-system stability: U.S. solvency concerns and the related exchange-rate value of the U.S. dollar. Market gyrations of the last several business days again demonstrated the close tie of dollar movements to oil and gold prices. As the dollar tanked against the euro on Friday (June 29th), oil and gold prices jumped in tandem. The reverse had been seen recently, too. The outlook remains bleak for the U.S. currency, with a massive dumping of the dollar and dollar-denominated paper assets likely in the not-too-distant future, along with a related upside spike in domestic inflationary pressures.
Note: The general outlook is unchanged. Special Report No. 445 (June 12th) updated the hyperinflation outlook and the outlook for U.S. economic, U.S. dollar, and systemic-solvency conditions. The Special Report supplemented Hyperinflation 2012 (January 25th), which remains the primary missive detailing the hyperinflation story. This circumstance will be updated further as new developments unfold.
__________
REPORTING DETAIL
CONSTRUCTION SPENDING (May 2012, Benchmark Revision)
Benchmark Revision Hit 2011 Private Nonresidential Construction. Although the benchmarking went back to January 2010, the aggregate 2010 revisions were minimal. For 2011, total construction spending was revised lower by 1.4%, reflecting a 0.2% downside revision to private-residential construction, a 3.8% downside revision to private-nonresidential construction, and an unchanged public construction number. In all instances, activity was brought back to or above pre-existing levels in the late-2011 and 2012 activity, based on happy assumptions going forward, versus the revamped earlier data.
Nonetheless, these revisions should take a small notch out of 2011 GDP in the upcoming annual revisions to that series on July 27th.
Graphs of the benchmark revision versus prior reporting are plotted in this section (small or no revisions tend to mask prior reporting), with more-visible detail of key changes incorporated into graphs in the Opening Comments and Executive Summary.
Trend of Low-Level Stagnation Continued. In the context of the benchmark revision, the latest construction activity remained heavily impaired, bouncing along at levels near current-cycle lows. The downwardly revised increases in private-nonresidential activity and insignificant gains in residential activity were at least partially offset by ongoing contraction in the public sector.
The Census Bureau reported today, July 2nd, that the total value of construction put in place in the United States during May 2012 was $830.0 billion, on a seasonally-adjusted—but not inflation-adjusted—annual-rate basis. That estimate was up by a statistically-insignificant 0.9% +/- 1.8% (all confidence intervals are at a 95% level) from an upwardly benchmark-revised $822.5 billion, previously ($818.1 billion) in April. As revised, the monthly gain for April was 0.6%.
Although construction was up year-to-year by a statistically-significant 7.0% +/- 2.3% in May, the gain likely was more than covered by increases in construction costs. Year-to-year, April construction was up by a benchmark-revised 8.9% (previously 6.9%).
The insignificant gain in monthly construction spending reflected a continued decline in public spending, which was more than offset by gains in the private sector. As reflected in the accompanying graphs, May private construction rose by 1.6% for the month, with residential construction up 3.0% and nonresidential construction up by 0.4%. May public construction continued in decline, down by 0.4% for the month.


As shown in the preceding graph, and in line with the ongoing bottom-bouncing reported through May 2012 in construction spending, seasonally-adjusted May construction employment turned to the downside. May construction jobs reportedly declined by 28,000 (down by 42,000 before prior-period revisions) for the month, to a level of 5.516 million, from a revised 5.544 (previously 5.558) million in April, per the May payroll survey as published by the Bureau of Labor Statistics.
PERSONAL CONSUMPTION EXPENDITURE (PCE) DEFLATOR (May 2012)
May PCE Deflator Dropped by 0.2% for the Month; Year-to-Year Inflation at 1.5%. Reflecting large revisions and the impact of a sharp but likely short-lived decline in gasoline prices, inflation—as measured by the PCE deflator—retreated in May 2012 reporting. As published by the Bureau of Economic Analysis (BEA) on June 29th, the seasonally-adjusted May PCE deflator declined by 0.19% month-to-month (down by 0.05% before prior-period revisions), against a revised increase of 0.23% in April (previously estimated as “unchanged”). The magnitude of the regular monthly revisions to these data continues to suggest that initial estimates of monthly change are not meaningful.
Year-to-year PCE deflator growth continued to soften, at 1.52% in May, which was down from a revised 1.88% (previously 1.81%) in April. Annual PCE inflation held below the Fed’s 2.0% target for a second month. Below-target PCE inflation reporting, however, should not become a protracted pattern here, especially with the series facing its annual benchmark revision on July 31st.
Following in the gimmicked reporting of its quarterly GDP parent series, the monthly PCE deflator can vary widely month-to-month, thanks to prior-period revisions. Unlike the CPI-U series—which never is revised on a not-seasonally-adjusted basis so that the reported year-to-year inflation always remains fixed—the PCE deflator always is seasonally adjusted. The PCE deflator is not even estimated on an unadjusted basis.
In theory the PCE deflator measure should be virtually identical to the chain-weighted-CPI (C-CPI-U) (see Commentary No. 447 for details of the latest C-CPI-U and other inflation measures). The May 2012 PCE deflator showed 1.5% year-to-year inflation, versus a revised 1.9% (previously 1.8%) in April; such compared with annual inflation in the May C-CPI-U at 1.6%, versus 2.1% in April; May CPI-U at 1.7%, versus 2.3% in April; May CPI-W at 1.6%, versus 2.4% in April; and the May SGS-Alternate (1980-Base) at 9.3%, versus 9.9% in April. Reported annual PCE-deflator inflation is shown in the following graphs against the C-CPI-U and the CPI-U.
This “inflation targeting” effort by the Federal Reserve primarily is window-dressing for those in the markets who think the Fed really would move to contain inflation at the cost of impairing already-fragile banking-system solvency. The Fed’s primary function remains keeping the banking system afloat, at any cost.
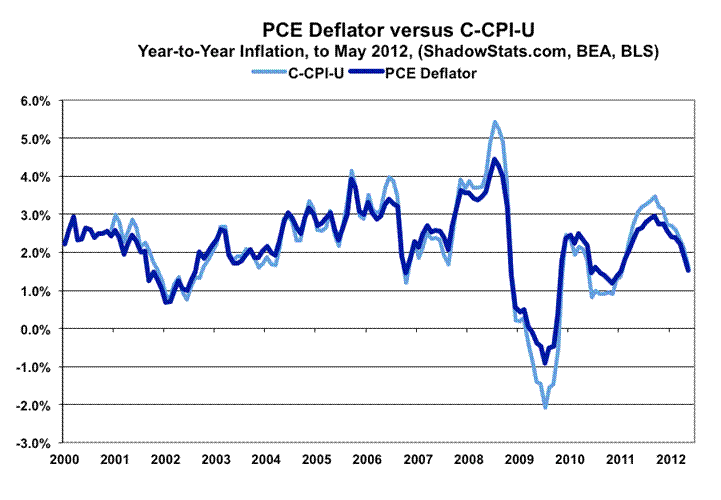

NOTE: The PCE deflator is the heavily massaged and modeled inflation rate for personal consumption expenditure, published on a monthly basis by the Bureau of Economic Analysis (BEA), and quarterly as part of the GDP release. The monthly series, which is a surrogate measure of consumer inflation—fully substitution and hedonic-based—currently is yielding the lowest annual consumer inflation rate of the major series (see the preceding graphs of the PCE deflator versus the CPI-U and the C-CPI-U. Unlike the more widely followed CPI-U measure, which never is revised and is published on a seasonally unadjusted-basis, the PCE deflator is heavily revised for many years following initial reporting, and it is available only on a heavily-massaged, seasonally-adjusted basis.
Week Ahead. Market recognition of an intensifying double-dip recession has started to take a stronger hold, at the moment, while recognition of a mounting inflation threat remains sparse. The political system would like to see the issues disappear until after the election; the media does its best to avoid publicizing unhappy economic news or to put a happy spin on the numbers; and the financial markets will do their best to avoid recognition of the problems for as long as possible, problems that have horrendous implications for the markets and for systemic stability.
Until such time as financial-market expectations move to catch up fully with underlying reality, or underlying reality catches up with the markets, reporting generally will continue to show higher-than-expected inflation and weaker-than-expected economic results in the months and year ahead. Increasingly, previously unreported economic weakness should show up in prior-period revisions.
Employment and Unemployment (June 2012). June labor data are due for release on Friday, July 6th, from the Bureau of Labor Statistics (BLS). The consensus jobs estimate usually comes in close to the trend estimate that comes out of the BLS seasonal-adjustment models. The payroll trend number for June is 113,000 as discussed in Commentary No. 443.
Nonetheless, June data likely will disappoint market expectations, again, given intensifying underlying weakness in related economic fundamentals. Payroll growth could be even weaker than the initial reporting of a 69,000 jobs gain reported in May. Another upside tick in the unemployment rate—to 8.3%—also is possible, but concurrent-seasonal-factor adjustment issues raise serious questions as to the significance of any published monthly changes, where the latest reporting is not consistent with the prior month’s reporting, as discussed in the Commentary No. 451.
__________